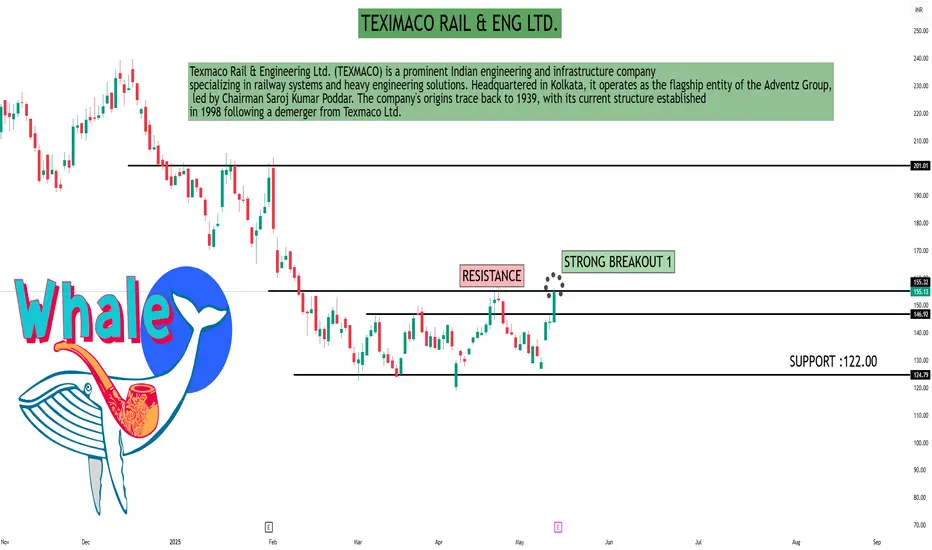
TEXIMACO RAIL & ENG LTD.✓
TIME FOR RAILWAY STOCKS:
#TEXRAIL (Texmaco Rail.)
+ Entry : 152
SL : 142
TARGET: 180
? FORMING BOTTOM!
Tecnical
Option Trading Options trading gives you the right or obligation to buy or sell a specific security on or by a specific date at a specific price. An option is a contract that's linked to an underlying asset, such as a stock or another security.

Support and Resistance part 2In technical analysis, support and resistance refer to price levels on a chart where the market's movement is expected to pause or reverse due to the forces of supply and demand. Support is a price level where the price has historically stopped falling, indicating that buyers are plentiful at that price point, and that the market is likely to bounce back upwards. Resistance, on the other hand, is a price level where the price has historically stopped rising, suggesting that sellers are abundant and the market is likely to fall back down.

Nifty Level For Tomorrow ( Price Action Analysis),IF MARKET OPEN 15690 AND TAKING SUPPORT THEN GO LONG UPTO 1574.
IF MARKET BREAK THIS LEVEL THATS IS 15690 THEN GO SHORT For 50-80 Point Down
Or
IF Market Open on 15748 then Go Short For 100 Point Down If LEVEL BREAKS THEN CONTINUE
IF mARKET GO SIDE WAYS THEN DONT TRADE IF LEVEL BREAKS THEN TAKE TRADE
MAJOR RESISTANCE:- 15750, 15900
MAJOR SUPPORT :- 15680 ,15600 ,15531
ALL Advice is given for Educational Purpose
Analysis Based on Purely Price Action.........

HDFC BANK POSITIONAL TRADE VIEWHDFC BANK POSITIONAL TRADE VIEW
Entry and Exit and Target Levels are marked in the chart
HDFC Bank made triangle formation and it has broken the upper resistance line.

Bajaj Finance Start for upward RallyAfter breakout test the breakout level and now start the pullback....
