solarindsLet's analyze **Solar Industries India Ltd. (SolarInds)** from both a **fundamental** and **technical** perspective.
### **Fundamental Analysis of Solar Industries India Ltd. (SolarInds)**
#### **Overview of Solar Industries India Ltd.**
- **Sector:** Chemicals, Industrials
- **Industry:** Explosives, Defense & Aerospace, and Industrial Products
- **Founded:** 1995
- **Headquarters:** Nagpur, Maharashtra, India
- **Market Cap:** Approx. ₹40,000 crore (as per the latest data)
**Solar Industries India Ltd.** is a leading manufacturer of **industrial explosives** and related products. The company is one of the largest producers of explosives in India and has a diverse portfolio that includes products used in **mining**, **construction**, **defense**, and **aerospace** industries. The company also specializes in providing **explosive solutions** for various commercial and military applications.
Key areas of Solar’s operations include:
- **Industrial Explosives:** Solar produces a wide range of explosives for mining, quarries, and construction.
- **Defense:** The company provides solutions for the defense sector, including ammunition and explosive devices.
- **Aerospace & Other:** Solar manufactures various products for the aerospace and defense sectors, such as high-grade explosives and related services.
#### **Key Financials (Latest Report)**
- **Revenue Growth:** Solar Industries has consistently shown strong revenue growth due to its diversified customer base in industries like mining, infrastructure, and defense. Demand for industrial explosives in infrastructure projects and mining has been a significant growth driver.
- **Profitability:** Solar's profitability is solid, driven by strong margins in its high-demand products. The company benefits from its leadership in the industrial explosives sector and has a strong track record of generating healthy profits.
- **Debt Levels:** The company maintains a relatively low level of debt, allowing it to fund its growth and expansion without significant interest burden. Its ability to generate strong operational cash flow supports its debt servicing.
- **Cash Flow & Dividend Yield:** Solar has a strong cash flow from operations, which allows it to reinvest in growth while also rewarding shareholders with consistent dividend payouts.
#### **Valuation Ratios**
- **P/E Ratio:** Solar’s P/E ratio is generally higher than the broader market due to its leadership position in the explosives and defense sectors. This can reflect the market’s expectation of continued growth and profitability.
- **P/B Ratio:** The P/B ratio of Solar is relatively high, indicating that the market values its equity significantly due to its strong asset base and profitability.
- **Dividend Yield:** Solar has a healthy dividend payout ratio, providing attractive dividends for long-term investors.
#### **Industry & Macro Trends**
- **Infrastructure & Mining Demand:** The demand for explosives in mining and infrastructure is strong, particularly in India, which has seen increased investments in infrastructure development, mining, and construction projects.
- **Defense Spending:** Solar’s defense segment benefits from growing defense budgets, both in India and internationally. With increased defense spending in India, Solar is well-positioned to expand its presence in the sector.
- **Government Initiatives:** The government’s push for infrastructure development, especially in roads, railways, and mining, supports long-term demand for Solar's explosives.
- **Regulations & Safety Standards:** As a manufacturer of explosives, Solar is highly regulated. Changes in regulations or safety standards could impact operations and increase compliance costs.
---
### **Technical Analysis of Solar Industries India Ltd. (SolarInds)**
Let’s evaluate the **technical outlook** of Solar Industries based on its price action, key levels, moving averages, and momentum indicators.
#### **Price Action:**
- **Current Price:** Solar Industries has demonstrated strong upward momentum over the years, benefiting from steady demand in its industrial explosives and defense sectors.
#### **Key Levels:**
- **Support Levels:**
- **₹3,200-₹3,300:** This support range has been tested multiple times in the past. A move below this support could suggest further downside potential.
- **₹2,900-₹3,000:** If the stock faces a significant pullback, this is another key support level to monitor.
- **Resistance Levels:**
- **₹3,600-₹3,700:** This level has historically acted as a strong resistance zone. A breakout above this level would signal a bullish trend, potentially leading to further upside.
- **₹3,800:** This is a psychological resistance level, and a breakout above ₹3,800 could lead to a more significant upward momentum in the stock.
#### **Moving Averages:**
- **50-Day Moving Average (50-MA):** If Solar is trading above its 50-day moving average, it suggests short-term bullishness. A price drop below this level could indicate weakening momentum.
- **200-Day Moving Average (200-MA):** The 200-day moving average is a strong indicator of long-term trends. A stock trading above this level signals that the long-term trend remains bullish.
#### **Momentum Indicators:**
- **RSI (Relative Strength Index):**
- An RSI above 70 indicates that the stock could be overbought, and a pullback might be on the horizon.
- An RSI below 30 suggests that Solar Industries might be oversold, signaling a potential buying opportunity if other indicators support it.
- **MACD (Moving Average Convergence Divergence):**
- A positive MACD crossover (when the MACD line crosses above the signal line) would suggest strong bullish momentum.
- A negative MACD crossover could indicate weakening momentum or the potential for a bearish reversal.
#### **Volume Analysis:**
- **Volume Trends:** Rising volume alongside price increases signals strong buying interest, supporting the bullish trend. Conversely, volume spikes during price declines can indicate strong selling pressure.
- **Volume Spikes:** Pay attention to volume spikes near key levels such as ₹3,600-₹3,700 or ₹3,800. A breakout or breakdown accompanied by significant volume could confirm the direction of the next trend.
---
### **Conclusion:**
- **Fundamental Strengths:**
- Solar Industries has a strong foothold in the **industrial explosives** and **defense sectors**, which are expected to continue growing, driven by infrastructure projects and defense spending.
- The company’s financial health, characterized by consistent revenue growth, low debt levels, and strong profitability, supports its long-term potential.
- Government policies promoting infrastructure development and defense spending are favorable for Solar’s business outlook.
- **Technical Outlook:**
- **Support levels:** ₹3,200-₹3,300 (primary), ₹2,900-₹3,000 (secondary).
- **Resistance levels:** ₹3,600-₹3,700 (primary), ₹3,800 (psychological resistance).
- The stock is likely to continue benefiting from strong demand in its key sectors, and a breakout above resistance levels could lead to further upside momentum.
#### **Risks to Consider:**
- **Commodity Price Fluctuations:** Changes in the prices of raw materials (such as chemicals and energy) used in the production of explosives could impact margins.
- **Regulatory Risks:** Stringent safety regulations and compliance requirements for the explosives industry could impact operations and cost structures.
- **Defense and Global Competition:** While Solar enjoys a strong position in the defense sector, it faces competition from both domestic and international players.
---
**Disclaimer:**
The information provided is for educational purposes only and should not be construed as financial or investment advice. I am not a SEBI-registered advisor, and this analysis is not a recommendation to buy, sell, or hold any securities. Accuracy and timeliness of the data cannot be guaranteed. Always conduct your own research or consult with a professional before making investment decisions. I do not take responsibility for any losses incurred.
Tecnicalanalysis

HindalcoLet's analyze **Hindalco Industries Ltd.** from both a **fundamental** and **technical** perspective.
### **Fundamental Analysis of Hindalco Industries Ltd.**
#### **Overview of Hindalco Industries Ltd.**
- **Sector:** Metals, Mining, Aluminium, Copper
- **Industry:** Aluminium, Copper, and Metal Products
- **Founded:** 1958
- **Headquarters:** Mumbai, Maharashtra, India
- **Market Cap:** Approx. ₹90,000 crore (as per the latest data)
**Hindalco Industries Ltd.**, a part of the **Aditya Birla Group**, is one of the largest manufacturers of aluminium and copper products in India. The company is a leading player in the metal sector, with a diverse product portfolio, including aluminium sheets, foil, wire rods, copper cathodes, and more.
Hindalco operates through two primary business segments:
- **Aluminium:** Including alumina refining, primary aluminium production, rolling, and extrusions.
- **Copper:** Includes copper cathodes and related products, which are widely used in electrical, industrial, and telecommunications applications.
#### **Key Financials (Latest Report)**
- **Revenue Growth:** Hindalco has seen consistent revenue growth driven by strong demand in both aluminium and copper products. The company benefits from robust demand in the infrastructure, automotive, and electrical industries.
- **Profitability:** Hindalco's profitability is relatively stable, benefiting from economies of scale, a diversified product portfolio, and integrated operations. The company has maintained solid operating margins.
- **Debt Levels:** Hindalco has a manageable debt load, though it operates in a capital-intensive sector. The company has demonstrated a consistent ability to service debt, supported by strong cash flows from operations.
- **Cash Flow & Dividend Yield:** Hindalco generates strong operational cash flow, allowing it to fund capital expenditures, debt servicing, and pay consistent dividends to shareholders.
#### **Valuation Ratios**
- **P/E Ratio:** Hindalco's P/E ratio is typically lower than that of high-growth sectors, reflecting its cyclical nature. However, its stable growth in aluminium and copper makes it a defensive play in the metals sector.
- **P/B Ratio:** The P/B ratio is moderate, reflecting Hindalco’s substantial asset base in aluminium and copper production. This ratio tends to track closely with the company’s earnings growth and commodity prices.
- **Dividend Yield:** Hindalco is known for paying consistent and healthy dividends, which is attractive for long-term investors seeking income alongside capital appreciation.
#### **Industry & Macro Trends**
- **Global Aluminium and Copper Demand:** The demand for aluminium and copper is tied to global economic growth, particularly in infrastructure, automotive, and construction sectors. Hindalco benefits from rising global demand for lightweight materials like aluminium.
- **Commodity Prices:** Hindalco’s margins are highly sensitive to fluctuations in the prices of aluminium, copper, and energy. The prices of these commodities are volatile and can impact profitability, especially in periods of global supply disruptions or changes in demand.
- **Government Regulations and Policies:** Being in the metals sector, Hindalco is impacted by government policies related to environmental regulations, mining rights, and pricing regulations for raw materials.
- **Competition:** Hindalco competes with global players such as **Norsk Hydro**, **Rio Tinto**, and **Vedanta** in aluminium and copper. Domestic competitors include **National Aluminium Company (NALCO)** and **Vedanta Limited**.
---
### **Technical Analysis of Hindalco Industries Ltd.**
Let’s evaluate the **technical outlook** of Hindalco based on its stock price patterns, momentum indicators, and key levels:
#### **Price Action:**
- **Current Price:** Hindalco has experienced volatility over time, reflecting both global commodity price trends and company-specific events. The stock could move in line with broader metal sector trends.
#### **Key Levels:**
- **Support Levels:**
- **₹430-₹450:** This support level has historically been an important area where Hindalco’s stock tends to find buying interest. A fall below this zone could signal further downside risk.
- **₹400-₹420:** If the stock pulls back, this level could provide another level of support, especially during market corrections or commodity price pullbacks.
- **Resistance Levels:**
- **₹500-₹520:** This range is a significant resistance zone for Hindalco. A breakout above this level would signal strong bullish momentum, especially if accompanied by high volume.
- **₹550:** This is another key resistance level. A break above ₹550 could signal that the stock is entering a new bullish phase and could lead to further upside.
#### **Moving Averages:**
- **50-Day Moving Average (50-MA):** If Hindalco is trading above its 50-day moving average, it is considered to be in a short-term uptrend. A cross below the 50-day MA would indicate a potential shift to a bearish phase.
- **200-Day Moving Average (200-MA):** The 200-day moving average is a strong indicator of the long-term trend. A stock trading above this level signals long-term bullishness, while a fall below this would indicate a bearish trend.
#### **Momentum Indicators:**
- **RSI (Relative Strength Index):**
- An RSI above 70 would suggest that Hindalco might be overbought and due for a pullback.
- An RSI below 30 indicates the stock may be oversold and could be due for a reversal or consolidation.
- **MACD (Moving Average Convergence Divergence):**
- A positive MACD (when the MACD line crosses above the signal line) would suggest upward momentum.
- A negative MACD (when the MACD line crosses below the signal line) would indicate weakening momentum or potential reversal to the downside.
#### **Volume Analysis:**
- **Volume Trends:** Rising volume during price increases suggests strong buying interest and can confirm a bullish trend. Similarly, decreasing volume during price drops could indicate that selling pressure is subsiding.
- **Volume Spikes:** A large spike in volume at key support or resistance levels (₹450, ₹500) could signal a breakout or breakdown, depending on the direction of the price move.
---
### **Conclusion:**
- **Fundamental Strengths:**
- Hindalco Industries is a dominant player in the global aluminium and copper markets with strong fundamentals, including a solid revenue base, good profitability, and strong cash flow.
- The company is well-positioned to benefit from the growing demand for aluminium, driven by sectors like automotive, infrastructure, and electrical.
- Despite the cyclical nature of the metals industry, Hindalco’s diversified business and strong management enable it to weather volatility and continue to generate value for shareholders.
- **Technical Outlook:**
- **Support levels:** ₹430-₹450 (primary), ₹400-₹420 (secondary).
- **Resistance levels:** ₹500-₹520 (primary), ₹550 (psychological resistance).
- The stock is likely to follow the global trends in aluminium and copper prices. Keep an eye on the breakout above resistance levels for further upward momentum.
#### **Risks to Consider:**
- **Commodity Price Volatility:** Hindalco’s performance is closely tied to fluctuations in aluminium and copper prices. Global economic conditions and supply-demand imbalances in metals can significantly impact profitability.
- **Geopolitical Risks:** Trade tariffs, sanctions, and other geopolitical factors can impact the prices and supply of raw materials, potentially affecting Hindalco’s margins.
---
**Disclaimer:**
The information provided is for educational purposes only and should not be construed as financial or investment advice. I am not a SEBI-registered advisor, and this analysis is not a recommendation to buy, sell, or hold any securities. Accuracy and timeliness of the data cannot be guaranteed. Always conduct your own research or consult with a professional before making investment decisions. I do not take responsibility for any losses incurred.

Chambl-Fertilizer watch for breakoutLet's analyze **Chambal Fertilizers and Chemicals Ltd. (CHAMBLFERT)** from both a **fundamental** and **technical** perspective.
### **Fundamental Analysis of Chambal Fertilizers & Chemicals Ltd. (CHAMBLFERT)**
#### **Overview of Chambal Fertilizers & Chemicals Ltd.**
- **Sector:** Fertilizers & Agrochemicals
- **Industry:** Fertilizers, Chemicals
- **Founded:** 1985
- **Headquarters:** Kota, Rajasthan, India
- **Market Cap:** Approx. ₹20,000 crore (as per the latest data)
Chambal Fertilizers & Chemicals Ltd. is one of India’s leading manufacturers and marketers of fertilizers. The company primarily produces Urea and other nitrogenous fertilizers. It is part of the **SKS Group**, which has a strong presence in the Indian agricultural and chemical sectors.
#### **Key Financials (Latest Report)**
- **Revenue Growth:** Chambal Fertilizers has shown consistent growth, driven by increased demand for fertilizers, especially in India’s agricultural sector. The company's revenue is sensitive to changes in fertilizer subsidies, raw material costs, and government policies.
- **Profitability:** The company has maintained stable profitability due to its scale and integrated operations, with a focus on efficient production. Chambal Fertilizers benefits from favorable subsidies provided by the Indian government to the fertilizer sector.
- **Debt Levels:** Chambal Fertilizers has a moderate debt-to-equity ratio typical for companies in the capital-intensive fertilizer industry. The company’s debt levels have been manageable, as it generates stable cash flows.
- **Cash Flows:** The company benefits from a predictable cash flow structure due to the government support for fertilizers. However, fluctuations in raw material costs and subsidy payments can affect cash flow in the short term.
#### **Valuation Ratios**
- **P/E Ratio:** Chambal Fertilizers has a relatively low P/E ratio compared to many other sectors, which is typical for companies in the fertilizer space. The P/E ratio is influenced by the company's steady revenue and stable margins.
- **P/B Ratio:** The price-to-book ratio of Chambal Fertilizers is generally moderate, reflecting its asset base and efficient management of capital.
- **Dividend Yield:** Chambal Fertilizers has a strong dividend track record, reflecting its stable earnings and cash flow generation. Investors in this stock typically benefit from a regular dividend payout.
#### **Industry & Macro Trends**
- **Fertilizer Demand in India:** India remains one of the largest consumers of fertilizers due to its large agricultural sector. Government subsidies and policies support demand for fertilizer products, including urea and other nitrogenous fertilizers.
- **Subsidy Support:** The Indian government has a significant impact on the fertilizer sector due to subsidies for urea. Any changes in subsidy policy can influence the profitability of companies like Chambal Fertilizers.
- **Raw Material Costs:** Chambal Fertilizers' margins are sensitive to fluctuations in raw material costs, such as natural gas (used for urea production), which can affect production costs.
- **Agricultural Growth:** The growth in India’s agricultural output, including increased acreage for key crops like wheat and rice, directly impacts the demand for fertilizers.
- **Competition:** Chambal Fertilizers faces competition from other major fertilizer producers like National Fertilizers Ltd., IFFCO, and Rashtriya Chemicals and Fertilizers (RCF).
---
### **Technical Analysis of Chambal Fertilizers & Chemicals Ltd. (CHAMBLFERT)**
Let’s evaluate the **technical outlook** of Chambal Fertilizers, based on its stock price patterns and key levels:
#### **Price Action:**
- **Current Price:** Chambal Fertilizers' stock price tends to move in tandem with the overall agricultural and chemical sector sentiment. The price may consolidate within a range depending on the broader market conditions and agricultural output forecasts.
#### **Key Levels:**
- **Support Levels:**
- **₹300-₹320:** This range could be considered as the first level of support. If the stock approaches this level and bounces, it would suggest buying interest around this zone.
- **₹280-₹290:** If the stock falls below the ₹300 level, the ₹280-₹290 range could act as a secondary support level, marking a strong point for potential price stabilization or reversal.
- **Resistance Levels:**
- **₹350-₹370:** This level is a critical resistance zone, where selling pressure might emerge. A breakout above this level could signal bullish movement in the stock.
- **₹400:** This is a key psychological resistance level. If the stock breaks above ₹400 with strong volume, it could indicate further upside potential.
#### **Moving Averages:**
- **50-Day Moving Average (50-MA):** If the stock is trading above the 50-day moving average, it suggests short-term bullish momentum. A cross below the 50-MA could signal weakness.
- **200-Day Moving Average (200-MA):** This is the key indicator for long-term trends. If the stock is above the 200-day MA, it suggests that the long-term trend remains bullish. If the stock is below, it could indicate a prolonged downtrend or neutral market conditions.
#### **Momentum Indicators:**
- **RSI (Relative Strength Index):**
- An RSI above 70 would indicate that the stock is overbought and might be due for a pullback.
- An RSI below 30 suggests oversold conditions and could present a buying opportunity if the stock shows signs of reversal.
- **MACD (Moving Average Convergence Divergence):**
- A positive MACD (when the MACD line crosses above the signal line) would suggest bullish momentum.
- A negative MACD (when the MACD line crosses below the signal line) would suggest weakening momentum.
#### **Volume Analysis:**
- **Volume Trends:** Pay attention to volume trends. If the stock rallies with increasing volume, it would suggest strong buying conviction. Conversely, declining volume during price increases may suggest a lack of conviction.
- **Volume Spikes:** A significant volume spike at key support or resistance levels could indicate that a breakout or breakdown is imminent.
---
### **Conclusion:**
- **Fundamental Strengths:**
- Chambal Fertilizers benefits from a stable and predictable demand for its products due to India’s large agricultural sector and government subsidies.
- The company has a robust track record of profitability, strong cash flows, and a shareholder-friendly dividend policy.
- It faces risks from raw material cost fluctuations and any changes in government subsidy policy but is well-positioned in the fertilizer market due to its scale and distribution reach.
- **Technical Outlook:**
- **Support levels:** ₹300-₹320 (primary) and ₹280-₹290 (secondary).
- **Resistance levels:** ₹350-₹370 (primary) and ₹400 (psychological resistance).
- The stock is likely to remain range-bound unless it breaks out of the key resistance levels. Watch for momentum indicators like the MACD and RSI for potential trend changes.
#### **Risks to Consider:**
- **Policy Risks:** Any changes in fertilizer subsidies or government regulations could impact profitability.
- **Commodity Price Volatility:** Rising raw material costs could compress margins.
---
**Disclaimer:**
The information provided is for educational purposes only and should not be construed as financial or investment advice. I am not a SEBI-registered advisor, and this analysis is not a recommendation to buy, sell, or hold any securities. Accuracy and timeliness of the data cannot be guaranteed. Always conduct your own research or consult with a professional before making investment decisions. I do not take responsibility for any losses incurred.

Sardaen stock for watchLet's dive into the analysis of **Sarda Energy & Minerals Ltd.** (often referred to as **Sarda Energy**), which is a leading player in the Indian steel industry, focusing on both production and power generation.
### **Fundamental Analysis of Sarda Energy & Minerals Ltd.**
#### **Overview of Sarda Energy & Minerals Ltd.**
- **Sector:** Steel, Mining, Power Generation
- **Industry:** Steel, Iron & Steel Products, Power
- **Founded:** 1973 by Mr. Sushil Sarda
- **Headquarters:** Raipur, Chhattisgarh, India
- **Market Cap:** Approx. ₹5,000-6,000 crore (as per the latest data)
Sarda Energy & Minerals Ltd. (SEML) is a diversified company involved in manufacturing steel, ferro alloys, power generation, and mining. It is known for its integrated steel plant in Chhattisgarh, and the company also focuses on power generation through its captive power plants.
#### **Key Financials (Latest Report)**
- **Revenue Growth:** The company has shown steady revenue growth due to its integrated business model, which combines steel production, power generation, and mining. The demand for steel and other products has generally been stable, contributing to this growth.
- **Profitability:** Sarda Energy has shown solid profitability, driven by its strong operational efficiency and backward integration into mining. The company has also benefited from the higher demand for steel and ferro alloys in domestic and export markets.
- **Debt Levels:** The company has moderate debt levels, which are typical in the capital-intensive steel industry. However, it has shown an ability to manage its debt efficiently, with its operational cash flows supporting its debt servicing.
- **Return Ratios:** The return on equity (RoE) and return on capital employed (RoCE) ratios of Sarda Energy have generally been above industry averages, indicating efficient use of shareholder capital.
#### **Valuation Ratios**
- **P/E Ratio:** Sarda Energy's P/E ratio can fluctuate based on commodity price cycles, but it is typically in line with other steel companies of similar size and market positioning.
- **P/B Ratio:** Sarda Energy has a P/B ratio that reflects its strong asset base, driven by its mining and power generation assets. The company’s stock is likely to be valued higher due to its integrated nature and diversified revenue streams.
- **Debt-to-Equity Ratio:** As a capital-intensive sector, the company’s debt-to-equity ratio is typical of the steel industry. However, it’s crucial to watch this ratio in relation to its ability to generate consistent cash flows.
#### **Industry & Macro Trends**
- **Steel Sector Growth:** The Indian steel sector has shown steady growth in the past decade, driven by infrastructure development, urbanization, and government spending on projects. Sarda Energy, with its strong domestic presence, stands to benefit from these trends.
- **Ferro Alloy and Mining Demand:** Demand for ferro alloys and minerals (mainly manganese and iron ore) has been rising, driven by the steel and energy sectors. Sarda Energy’s backward integration into mining gives it a cost advantage and ensures supply stability.
- **Government Policy:** Initiatives like "Make in India" and infrastructure development programs by the government continue to drive demand for steel products. Additionally, policies like anti-dumping duties on imported steel could help domestic producers like Sarda Energy.
- **Commodity Price Fluctuations:** Steel and ferro alloy prices are subject to global commodity price fluctuations. While demand is growing, prices can be volatile, impacting margins.
---
### **Technical Analysis of Sarda Energy & Minerals Ltd.**
Let's look at potential technical levels and patterns for **Sarda Energy & Minerals Ltd.**, assuming the stock is being analyzed:
#### **Price Action:**
- **Current Price:** The stock price of Sarda Energy would reflect its financial performance, steel demand trends, and broader market sentiment. If the stock price is consolidating in a range, it may indicate indecision among investors.
#### **Key Levels:**
- **Support Levels:**
- **₹300-₹320:** This is an important support level where the stock might find buying interest. A breach below this level could suggest further downside risk.
- **₹280-₹290:** If the stock falls to this level, it would likely test another critical support. A bounce from here could signal a buying opportunity.
- **Resistance Levels:**
- **₹380-₹400:** A resistance level for Sarda Energy. If the stock breaks above this level with strong volume, it could suggest further upward momentum.
- **₹420-₹440:** This is another significant resistance zone where selling pressure may build. If the stock moves above this zone, it could target higher levels.
#### **Moving Averages:**
- **50-Day Moving Average (50-MA):** A close above the 50-day moving average would indicate short-term bullishness, while trading below it could suggest a bearish trend.
- **200-Day Moving Average (200-MA):** The 200-day moving average is a key indicator of the long-term trend. If the stock is trading above it, it suggests long-term strength.
#### **Momentum Indicators:**
- **RSI (Relative Strength Index):**
- If the RSI is above 70, the stock could be overbought, signaling a potential pullback.
- If the RSI is below 30, the stock could be oversold and may see a price reversal or consolidation.
- **MACD (Moving Average Convergence Divergence):**
- A bullish signal occurs when the MACD line crosses above the signal line. A bearish crossover (MACD line crossing below the signal line) would indicate a potential downtrend.
#### **Volume Analysis:**
- **Volume Trends:** Rising volume along with price increases is a bullish signal, indicating strong buying interest. Conversely, increasing volume during price declines can suggest that selling pressure is dominant.
- **Volume Spikes:** A large volume spike near key support or resistance levels can signify a potential breakout or breakdown.
---
### **Conclusion:**
- **Fundamental Strengths:**
- Sarda Energy & Minerals Ltd. has a strong position in the Indian steel, mining, and power sectors, benefiting from vertical integration, solid financial management, and a diversified revenue base.
- Its focus on high-margin products like ferro alloys and its ability to manage its debt levels provide a competitive edge in the industry.
- **Technical Outlook:**
- Support levels around ₹300-₹320 and resistance near ₹380-₹400 should be closely watched. A breakout above ₹400 could signal bullish momentum.
- The stock's 50-day and 200-day moving averages will give insight into short-term and long-term trends, while RSI and MACD will help gauge market sentiment and potential price movements.
#### **Risks to Consider:**
- **Commodity Price Volatility:** Sarda Energy’s profitability is tied to the price of steel and ferro alloys, which can be volatile.
- **Debt and Capital Intensive Nature:** The company’s capital structure and debt levels need to be monitored closely, especially if there’s a downturn in the steel market.
---
**Disclaimer:**
The information provided is for educational purposes only and should not be construed as financial or investment advice. I am not a SEBI-registered advisor, and this analysis is not a recommendation to buy, sell, or hold any securities. Accuracy and timeliness of the data cannot be guaranteed. Always conduct your own research or consult with a professional before making investment decisions. I do not take responsibility for any losses incurred.

Patanjali stock Long Let’s analyze **Patanjali Foods Limited** (previously known as **Ruchi Soya Industries**), which is one of the key companies under the Patanjali group and focuses on food products, including edible oils, soya foods, and other packaged products.
### **Fundamental Analysis of Patanjali Foods Limited**
#### **Overview of Patanjali Foods Ltd.**
- **Sector:** FMCG (Fast-Moving Consumer Goods)
- **Industry:** Edible Oils & Food Processing
- **Parent Group:** Patanjali Ayurved (owned by Baba Ramdev and Acharya Balkrishna)
- **Headquarters:** Haridwar, India
- **Market Cap:** Approximately ₹50,000 crore (as per the latest reports)
Patanjali Foods is one of India’s leading companies in the edible oil and food products sector. It produces a range of products such as edible oils (under the brand name "Patanjali"), soya, and other processed foods. It has a strong presence in the Indian market, particularly after it was acquired by Patanjali Ayurved and rebranded as Patanjali Foods.
#### **Key Financials (Latest Report)**
- **Revenue Growth:** The company has shown strong growth due to its expanding product portfolio and aggressive marketing strategies. In recent years, Patanjali Foods has benefitted from the rising demand for healthy cooking oils and packaged food products.
- **Profitability:** The company’s margins have been under pressure in some years due to raw material price fluctuations (e.g., the cost of edible oils). However, Patanjali Foods remains relatively profitable.
- **Debt Levels:** Post-acquisition, Patanjali Foods has focused on reducing its debt levels and improving financial health, but it still carries some debt from its past operations before the acquisition.
- **Brand Recognition:** The Patanjali brand has a significant impact on consumer purchasing behavior in India, and its market positioning has helped it maintain a competitive edge in the food sector.
#### **Valuation Ratios**
- **P/E Ratio:** Patanjali Foods has benefited from its acquisition and transformation, but its valuation can fluctuate based on commodity price trends and the competitive landscape in the edible oils sector.
- **P/B Ratio:** Given its strong brand, Patanjali Foods may command a premium valuation compared to other food sector companies.
- **Dividend Yield:** The company pays a dividend, reflecting a strong cash flow and a shareholder-friendly approach, though the yield might vary year-to-year depending on profitability.
#### **Industry & Macro Trends**
- **Edible Oil Market:** The demand for edible oils continues to rise, especially healthy oils such as sunflower, soybean, and mustard. Patanjali Foods benefits from this trend by offering a variety of edible oil products.
- **Health-Conscious Consumers:** As consumers become more health-conscious, Patanjali's focus on natural and Ayurvedic-based products positions it well in the market.
- **Competition:** Patanjali Foods faces competition from other major edible oil brands like Marico (Saffola), Adani Wilmar (Fortune), and Hindustan Unilever (Listerine).
---
### **Technical Analysis of Patanjali Foods Limited**
If you were analyzing **Patanjali Foods Ltd.** from a technical standpoint (assuming it were a publicly traded stock), the following would apply:
#### **Price Action:**
- **Current Price:** The stock price would fluctuate based on market sentiment, commodity price movements, and company announcements.
- **Chart Patterns:** Look for potential patterns such as bullish triangles, head and shoulders, or cup-and-handle patterns that could indicate breakout opportunities or price consolidations.
#### **Key Levels:**
- **Support Levels:**
- **₹1,000-₹1,050:** Historically, stocks in this price range tend to find support. If the stock moves below this level, it may trigger further declines.
- **₹900-₹950:** This zone would likely act as a second line of defense if prices drop further.
- **Resistance Levels:**
- **₹1,200-₹1,250:** A critical resistance level, as it represents a key psychological barrier. A breakout above this level could lead to further bullish movements.
- **₹1,350-₹1,400:** The next level of resistance where significant selling pressure might come in.
#### **Moving Averages:**
- **50-Day Moving Average (50-MA):** If the stock is above the 50-day MA, it suggests short-term bullish sentiment.
- **200-Day Moving Average (200-MA):** A stock trading above the 200-day MA shows long-term strength. If the stock breaks below this level, it would indicate weakening momentum.
#### **Momentum Indicators:**
- **RSI (Relative Strength Index):** The RSI helps determine whether a stock is overbought or oversold. An RSI above 70 would indicate overbought conditions, while an RSI below 30 would indicate oversold conditions.
- **MACD (Moving Average Convergence Divergence):** A positive MACD line crossing above the signal line would indicate bullish momentum, while a negative MACD could point toward bearish signals.
#### **Volume Analysis:**
- **Volume Trends:** Rising volume during an uptrend indicates strength. If the volume increases during price declines, it could indicate selling pressure.
- **Volume Spikes:** Large volume spikes at key support or resistance levels could indicate significant shifts in market sentiment.
---
### **Conclusion:**
- **Fundamental Strengths:**
- Patanjali Foods is a strong player in the Indian edible oils and food products sector, benefiting from the growing demand for natural, healthy products.
- The company has a solid brand presence, which helps it maintain a competitive edge in an increasingly crowded FMCG space.
- The company's focus on health-conscious products has helped it gain market share in the oil and packaged food sectors.
- **Technical Outlook:**
- Key support lies around ₹1,000-₹1,050, and resistance near ₹1,200-₹1,250. A breakout above these levels could signal further bullish movement.
- Moving averages, RSI, and MACD would be important to monitor to gauge the stock's short-term and long-term trend.
Patanjali Foods' strong brand equity, along with the overall positive sentiment in the FMCG sector, makes it an interesting stock to watch for potential investment, assuming it follows the growth trajectory of its parent company, Patanjali Ayurved.
---
**Disclaimer:**
The information provided is for educational purposes only and should not be construed as financial or investment advice. I am not a SEBI-registered advisor, and this analysis is not a recommendation to buy, sell, or hold any securities. Accuracy and timeliness of the data cannot be guaranteed. Always conduct your own research or consult with a professional before making investment decisions. I do not take responsibility for any losses incurred.

Best Mutual Funds and SIPs for 2025Best Mutual Funds and SIPs for 2025
Mutual funds and Systematic Investment Plans (SIPs) are popular investment options for both new and experienced investors. With 2025 on the horizon, selecting the right funds is crucial for maximizing returns and managing risk effectively.
Top Performing Mutual Funds for 2025
Large-Cap Funds: Suitable for stable growth with moderate risk.
Example: HDFC Top 100 Fund
Example: ICICI Prudential Bluechip Fund
Mid-Cap Funds: Higher growth potential but with increased volatility.
Example: Axis Midcap Fund
Example: Nippon India Growth Fund
Small-Cap Funds: High-risk, high-reward investments.
Example: SBI Small Cap Fund
Example: Kotak Small Cap Fund
Debt Funds: Low-risk option for stable returns.
Example: ICICI Prudential Corporate Bond Fund
Hybrid Funds: Balance of equity and debt.
Example: HDFC Balanced Advantage Fund
Why Choose SIPs?
Disciplined Investing: Encourages regular savings.
Rupee Cost Averaging: Reduces the impact of market volatility.
Compounding Benefits: Helps grow wealth over time.
Conclusion
Investing in the right mutual funds and SIPs in 2025 can provide stable growth and financial security. Always diversify your portfolio and consult financial experts before investing.
Disclaimer: SkyTradingZone provides educational content only and does not offer financial or investment advice. We are not SEBI registered.

what is rsi and why it is important for trading ?**SkyTradingZone: Your Ultimate Guide to Trading Education**
# Understanding RSI (Relative Strength Index) and Its Importance in Trading
## What is RSI?
Relative Strength Index (RSI) is a momentum oscillator that measures the speed and change of price movements. It helps traders identify overbought and oversold conditions in the market and provides insights into potential trend reversals.
### RSI Formula:
RSI = 100 -
Where RS (Relative Strength) = Average gain over a period / Average loss over the same period
The standard period used for RSI is 14 days, but traders can adjust it based on their strategy.
## How to Interpret RSI?
- **Above 70:** Indicates overbought conditions; potential for price correction or reversal.
- **Below 30:** Indicates oversold conditions; potential for price bounce or uptrend.
- **Between 30-70:** Indicates a neutral zone where price is neither overbought nor oversold.
## Importance of RSI in Trading
1. **Identifying Overbought and Oversold Conditions:** RSI helps traders avoid entering trades at extreme price levels.
2. **Trend Confirmation:** RSI can confirm whether an existing trend is strong or losing momentum.
3. **Divergence Trading:** If price makes a new high but RSI doesn’t, it signals a potential reversal (bearish divergence). If price makes a new low but RSI doesn’t, it signals a potential uptrend (bullish divergence).
4. **Support and Resistance Validation:** RSI can help validate whether a support or resistance level is likely to hold.
## How to Use RSI Effectively?
- Combine RSI with other indicators like Moving Averages and Bollinger Bands for better accuracy.
- Look for RSI divergences to predict potential trend reversals.
- Use RSI along with candlestick patterns for precise entry and exit points.
- Adjust RSI periods for different trading styles (e.g., shorter periods for day trading, longer for swing trading).
## Conclusion
RSI is a powerful tool in technical analysis that helps traders understand market momentum and make informed decisions. When combined with other indicators, RSI can improve trading accuracy and risk management.
---
*Disclaimer: SkyTradingZone provides educational content only and does not offer financial or investment advice. We are not SEBI registered.*

database trading part 1**SkyTradingZone** is your go-to source for educational content on trading, covering market insights, strategies, and in-depth analysis. Our goal is to empower traders with knowledge to navigate the markets effectively.
---
## **Database Trading – Part 1: Introduction to Data-Driven Trading**
In today's trading landscape, institutional traders and quantitative funds rely heavily on data-driven decision-making. Retail traders can also leverage database trading to gain an edge by systematically analyzing historical data, backtesting strategies, and identifying market inefficiencies.
### **What is Database Trading?**
Database trading involves collecting, storing, and analyzing large amounts of market data to make informed trading decisions. This data can be structured in a database and used for:
✅ Backtesting trading strategies
✅ Identifying high-probability trade setups
✅ Understanding historical market patterns
✅ Algorithmic and automated trading
---
### **Key Components of Database Trading**
1️⃣ **Market Data Collection**
- **Sources:** TradingView, Yahoo Finance, Binance API, Alpha Vantage, etc.
- **Types of Data:**
- Price (OHLC – Open, High, Low, Close)
- Volume
- Order book data (bid/ask levels)
- Sentiment data (news, social media)
2️⃣ **Database Management**
- Using SQL or NoSQL databases to store large amounts of trading data efficiently.
- Example databases: PostgreSQL, MySQL, MongoDB, SQLite
- Python’s Pandas and NumPy for data manipulation
3️⃣ **Data Analysis & Strategy Testing**
- **Descriptive Statistics:** Mean, median, standard deviation
- **Technical Indicators:** Moving Averages, RSI, MACD
- **Pattern Recognition:** Candlestick formations, support/resistance zones
- **Machine Learning Models:** Predicting future price movements
4️⃣ **Automating Trades Based on Data Insights**
- Connecting databases with trading bots to execute trades automatically.
- Using Python libraries like CCXT, Alpaca API, or Binance API for automation.
---
### **Why Database Trading is Important?**
🔹 **Reduces Emotional Trading** – Trades are based on data rather than impulse.
🔹 **Enhances Accuracy** – Backtesting strategies improves win rates.
🔹 **Scalability** – Can be applied to multiple asset classes (stocks, forex, crypto).
🔹 **Institutional Edge** – Data-driven trading aligns with hedge fund and institutional strategies.
---
### **Next in Part 2**
In the next section, we’ll dive deeper into **how to collect and store market data**, along with setting up a database for trading purposes. Stay tuned!
---
🔹 **Disclaimer**: This content is for educational purposes only. *SkyTradingZone* is not SEBI registered, and we do not provide financial or investment advice. Please conduct your own research before making any trading decisions.

institutional investment psychology and methods**SkyTradingZone** is your go-to source for educational content on trading, covering market insights, strategies, and in-depth analysis. Our goal is to empower traders with knowledge to navigate the markets effectively.
---
### **Institutional Investment Psychology and Method**
Institutional investors—such as hedge funds, mutual funds, banks, and pension funds—operate with a completely different mindset and strategy compared to retail traders. Their large capital and long-term outlook shape market movements in ways that many traders fail to recognize. Understanding institutional psychology and methods can help retail traders align with smart money rather than trade against it.
### **Institutional Investment Psychology**
1. **Liquidity Seeking Behavior**
- Institutions need liquidity to execute large orders without significantly moving the price.
- They often use *Accumulation* (before an uptrend) and *Distribution* (before a downtrend) phases to build or unload positions gradually.
2. **Market Manipulation & Smart Money Concepts**
- Stop hunts: Institutions push prices to trigger stop-loss levels of retail traders, creating liquidity for their own entries.
- Fake breakouts: Traps set to mislead traders into taking wrong positions before reversing the trend.
3. **Risk Management & Position Sizing**
- Institutions diversify across assets and manage risk with complex hedging strategies.
- Unlike retail traders who risk large percentages of capital on a single trade, institutions scale in and out of positions.
4. **Long-Term Perspective & Data-Driven Decisions**
- While retail traders often focus on short-term price action, institutions rely on macroeconomic data, fundamentals, and geopolitical events.
- Algorithmic trading and quantitative models play a huge role in decision-making.
---
### **Institutional Trading Methods**
1. **Order Flow & Market Structure Analysis**
- Institutions analyze the market’s liquidity by studying order books, volume profiles, and open interest.
- They execute orders in ways that minimize impact, using iceberg orders or dark pools.
2. **Smart Money Accumulation & Distribution**
- **Accumulation**: Institutions quietly buy into an asset at low prices, often after a downtrend, before pushing prices higher.
- **Distribution**: They offload positions at high prices by creating the illusion of continued strength.
3. **Wyckoff Method**
- Institutions use Wyckoff’s accumulation/distribution patterns to determine entry and exit points.
- Understanding **Wyckoff Phases** (accumulation, markup, distribution, markdown) can help traders align with smart money.
4. **Trading with Institutional Levels**
- Key levels such as **fair value gaps (FVGs), order blocks, and liquidity pools** are major areas where institutions enter or exit.
- Smart traders look for confluences between these levels and retail trading patterns.
5. **Algorithmic & High-Frequency Trading (HFT)**
- Institutions use algorithms to exploit inefficiencies in the market at millisecond speeds.
- HFT firms provide liquidity but can also create unpredictable spikes and rapid reversals.
---
### **How Retail Traders Can Benefit**
- **Follow Institutional Footprints**: Study volume, liquidity zones, and institutional order blocks.
- **Avoid Retail Traps**: Be cautious of breakouts and learn to identify liquidity grabs.
- **Use Smart Money Concepts**: Trade in the direction of institutions rather than against them.
- **Be Patient & Think Long-Term**: Institutions operate with patience—learn from their mindset.
---
🔹 **Disclaimer**: This content is for educational purposes only. *SkyTradingZone* is not SEBI registered, and we do not provide financial or investment advice. Please conduct your own research before making any trading decisions.

Rvnl ltdLet's conduct a **technical analysis** of **Rail Vikas Nigam Ltd. (RVNL)**, which is involved in the development of railway infrastructure projects in India.
---
### **Technical Analysis of Rail Vikas Nigam Ltd. (RVNL)**
#### **1. Support and Resistance Levels**
- **Support Levels:**
- Support is where the stock tends to find buying interest and reverse from a downtrend.
- **Example Support Levels:** If RVNL has previously bounced near ₹45, ₹48, or ₹50, these could be important support levels to monitor.
- A breach of these support levels could indicate a possible further downtrend.
- **Resistance Levels:**
- Resistance is where the stock faces selling pressure and struggles to move higher.
- **Example Resistance Levels:** Levels such as ₹55, ₹58, or ₹60 could be areas of resistance for the stock.
- A breakout above these resistance levels could signal bullish momentum and the potential for further upside.
#### **2. Moving Averages (MA)**
- **50-day Moving Average (MA):**
- The 50-day MA is an important short-term trend indicator. If RVNL is trading above this moving average, it indicates a bullish short-term trend.
- **Example:** If RVNL is trading at ₹53 and the 50-day MA is ₹51, it indicates a bullish short-term outlook.
- **200-day Moving Average (MA):**
- The 200-day MA provides insights into the long-term trend. A price above the 200-day MA suggests long-term bullishness.
- **Example:** If RVNL is at ₹53 and the 200-day MA is ₹48, it signifies that the long-term trend is bullish.
#### **3. RSI (Relative Strength Index)**
- **RSI Levels:**
- **Above 70:** The stock may be overbought, indicating potential for a pullback or consolidation.
- **Below 30:** The stock may be oversold, suggesting that it could be due for a rebound or upward reversal.
- **Current Example:**
- If the RSI is **above 70**, it suggests RVNL could be overbought, and a price pullback might occur.
- If the RSI is **below 30**, it could signal that RVNL is oversold and may reverse to the upside.
#### **4. MACD (Moving Average Convergence Divergence)**
- **Bullish Signal:** When the MACD line crosses above the signal line, it is a bullish signal, suggesting that upward momentum may continue.
- **Bearish Signal:** When the MACD line crosses below the signal line, it is a bearish signal, suggesting downward pressure or consolidation.
- **Current Example:**
- If the MACD line is above the signal line, it’s a bullish signal for RVNL, indicating the possibility of further upside.
- If the MACD line is below the signal line, it may indicate a bearish trend or a period of consolidation.
#### **5. Volume Analysis**
- **Increasing Volume:** Rising prices accompanied by increasing volume confirm that the trend is supported by strong buying interest.
- **Decreasing Volume:** If the price rises or falls with decreasing volume, it may indicate a weakening trend or lack of conviction.
- **Current Example:**
- If RVNL is rising with increasing volume, it confirms that the uptrend is strong.
- If RVNL is rising with declining volume, it could signal a potential reversal or that the momentum is fading.
#### **6. Candlestick Patterns**
- **Bullish Patterns:**
- Patterns such as **Bullish Engulfing**, **Morning Star**, or **Hammer** near support levels suggest a potential reversal to the upside.
- **Bearish Patterns:**
- Patterns like **Shooting Star**, **Bearish Engulfing**, or **Evening Star** near resistance levels suggest that the price might reverse to the downside.
- **Current Example:**
- A **Bullish Engulfing** pattern near ₹50 could signal a potential upward reversal.
- A **Shooting Star** near ₹55 could indicate potential resistance and a reversal downward.
#### **7. Fibonacci Retracement Levels**
- **Fibonacci Levels** are useful for identifying potential retracement levels during a correction. The key Fibonacci levels are **23.6%, 38.2%, 50%, and 61.8%**.
- **Current Example:**
- If RVNL has moved from ₹45 to ₹55, the key Fibonacci retracement levels to watch for support during a pullback would be:
- **23.6% retracement** around ₹53
- **38.2% retracement** around ₹51.5
- **50% retracement** around ₹50
- **61.8% retracement** around ₹48.5
These levels can serve as potential support if the stock faces a price correction.
---
**Disclaimer:**
- I am not a SEBI-registered professional or licensed financial advisor.
- This analysis is based on historical price data, technical indicators, and general market trends.
- Any decisions you make based on this information are entirely at your own risk. Please consult with a licensed financial advisor before making any investment decisions.
- Technical analysis cannot guarantee future results, and stock prices can be influenced by numerous factors, including news, economic data, and other market developments.

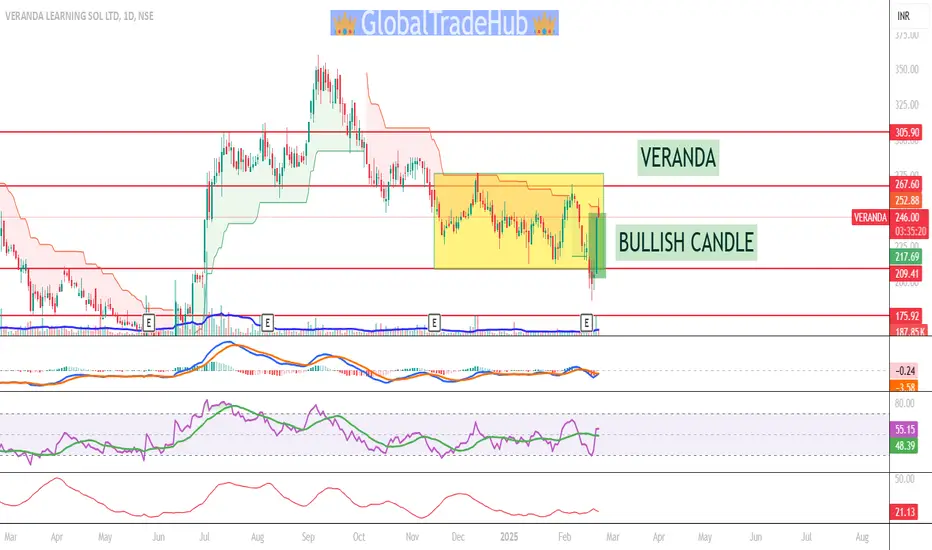
Veranda learning solutions Let's dive into the **technical analysis** of **Veranda Learning Solutions Ltd.** based on typical technical indicators. Since I don't have live market data, I'll guide you through a structured analysis framework. You can use real-time data from a stock charting tool to apply these indicators.
---
### **Technical Analysis of Veranda Learning Solutions Ltd. (VERANDA)**
#### **1. Support and Resistance Levels**
- **Support Levels:**
- These are price zones where the stock has historically found buying interest or has reversed direction.
- **Example Support Levels:** Look for recent lows. If Veranda Learning has recently bounced at ₹250 or ₹230, these could be key support levels. If the price breaks below these, it may signal further downside risk.
- If the stock is approaching these levels and starts to bounce back, these can act as buy signals.
- **Resistance Levels:**
- Resistance is where the stock has faced selling pressure in the past. If the stock has faced difficulty breaking through ₹280, ₹290, or ₹300, these levels could act as resistance.
- A breakout above these resistance levels could signal strong bullish momentum.
#### **2. Moving Averages (MA)**
- **50-day Moving Average (MA):**
- The 50-day moving average helps assess short-term price trends. If the stock is trading above this level, it generally indicates bullish momentum in the short term.
- **Example:** If the stock is at ₹270 and the 50-day MA is ₹265, this would signal short-term bullishness.
- **200-day Moving Average (MA):**
- The 200-day moving average is used for identifying the long-term trend. If the stock is trading above it, it suggests a long-term bullish trend. If below, the stock may be in a long-term downtrend.
- **Example:** If the stock is at ₹270 and the 200-day MA is at ₹260, it confirms a long-term bullish trend.
#### **3. RSI (Relative Strength Index)**
- **RSI Levels:**
- **Above 70:** Indicates the stock is potentially overbought, suggesting a pullback or consolidation could occur.
- **Below 30:** Indicates the stock is potentially oversold, suggesting it may be due for an upward move or reversal.
- **Current Example:**
- If the RSI is **above 70**, the stock could be in overbought territory, suggesting it might face a correction.
- If the RSI is **below 30**, it suggests oversold conditions, potentially indicating a buying opportunity.
#### **4. MACD (Moving Average Convergence Divergence)**
- **Bullish Signal:** When the MACD line crosses above the signal line, it suggests bullish momentum.
- **Bearish Signal:** When the MACD line crosses below the signal line, it suggests bearish momentum.
- **Current Example:**
- If the MACD is currently above the signal line, it signals potential upward momentum for the stock.
- If the MACD is below the signal line, it might indicate a downtrend or consolidation.
#### **5. Volume Analysis**
- **Increasing Volume:** When the stock rises with increasing volume, it suggests strong buying interest, confirming the trend.
- **Decreasing Volume:** If the stock rises or falls with decreasing volume, it may signal weakening momentum, either bullish or bearish.
- **Current Example:**
- If Veranda Learning is rising with increasing volume, it confirms the strength of the upward move.
- If the stock price rises but volume is decreasing, it could suggest that the rally is losing momentum and may not be sustainable.
#### **6. Candlestick Patterns**
- **Bullish Patterns:** Look for **Hammer**, **Bullish Engulfing**, or **Morning Star** patterns during a downtrend. These could signal a reversal to the upside.
- **Bearish Patterns:** Patterns like **Shooting Star**, **Evening Star**, or **Bearish Engulfing** near resistance could signal a reversal to the downside.
- **Current Example:**
- If a **Bullish Engulfing** pattern forms near a support level, it may signal a reversal to the upside.
- If a **Shooting Star** or **Evening Star** forms near a resistance level, it could indicate a potential reversal to the downside.
#### **7. Fibonacci Retracement Levels**
- Fibonacci retracement levels are often used to identify potential support or resistance areas during pullbacks or price corrections. Key levels include **23.6%, 38.2%, 50%,** and **61.8%**.
- **Current Example:**
- If the stock has moved from ₹230 to ₹300, check for retracement levels. The **38.2% retracement** might be around ₹280, and the **50% retracement** could be around ₹265.
- These levels could act as support during a pullback if the stock is in an uptrend.
---
**Disclaimer:**
- I am not a SEBI-registered professional or licensed financial advisor.
- All analysis, recommendations, and opinions provided are based solely on historical price data, patterns, and general market trends.
- Any action you take on the basis of this information is at your own risk. Please consult with a licensed financial advisor before making any investment decisions.
- Technical analysis cannot guarantee future results and may not be accurate in predicting market movements.
- Market conditions and stock prices can be influenced by many factors, including external events, news, and economic data, which are beyond the scope of this analysis.
what is momentum trading & how to become profitable ?**Momentum trading** is a strategy where traders seek to capitalize on the continuation of an existing price trend. The idea is to buy securities that are trending up and sell securities that are trending down, with the expectation that the trend will persist for some time. In other words, momentum traders try to ride the wave of price movements, profiting from short-term trends rather than long-term value.
### Key Concepts of Momentum Trading:
1. **Trend Following**: Momentum traders believe that assets that are moving in one direction (up or down) will continue to do so for a period. The core idea is to "buy high, sell higher" or "sell low, buy lower," depending on whether the trend is bullish (upward) or bearish (downward).
2. **Technical Indicators**: Momentum traders rely heavily on technical analysis, using indicators to confirm the strength of a trend. Common tools include:
- **Relative Strength Index (RSI)**: Measures whether an asset is overbought or oversold, helping identify potential reversal points or trend strength.
- **Moving Averages**: Moving averages like the 50-day or 200-day moving average help determine the overall direction of a trend.
- **MACD (Moving Average Convergence Divergence)**: Tracks the relationship between two moving averages to help identify potential buy or sell signals.
- **Volume**: Increased trading volume often indicates strong momentum, as it confirms that the price move is supported by market participation.
3. **Time Horizon**: Momentum trading can range from **day trading** to **swing trading** or even longer positions depending on the trader’s strategy and market conditions.
4. **Momentum Shift**: Momentum traders look for signs of a trend reversal or a shift in momentum, like a sudden spike in price or volume, as an opportunity to either enter or exit a trade.
---
### How to Become Profitable with Momentum Trading:
1. **Identify Strong Trends**:
- **Look for Assets with Strong Price Moves**: Profitable momentum trades often involve assets that have recently seen sharp upward or downward movements. This could be a result of earnings announcements, news, or market sentiment.
- **Use Trend Indicators**: Rely on moving averages and trend lines to confirm that an asset is in a strong uptrend or downtrend. The more clearly defined the trend, the better.
2. **Timing Your Entry and Exit**:
- **Enter at the Right Moment**: In momentum trading, timing is crucial. The goal is to enter a trade as close to the start of the trend as possible. Look for technical signals like a breakout above resistance or a bounce off a support level.
- **Exit Before the Trend Reverses**: Profitable momentum traders know when to take profits. One way to do this is by setting predefined exit points (e.g., resistance levels or a target price) or using trailing stops to lock in profits as the price moves in your favor.
- **Avoid Chasing**: Don’t chase a move once it’s already well underway. It’s better to wait for a brief pullback or consolidation before entering, rather than jumping in too late.
3. **Use Stop Losses**:
- **Protect Against Reversals**: Momentum trading can be risky because trends can reverse unexpectedly. Always use stop-loss orders to protect your capital and limit potential losses. For example, you might place a stop just below a recent low (for a long position) or above a recent high (for a short position).
- **Adjust Stops Dynamically**: As the trend continues in your favor, you can adjust your stop-loss to break even or lock in profits. This helps you stay in the trade while protecting your gains.
4. **Monitor Market Sentiment**:
- **News and Events**: Momentum is often driven by news, earnings reports, economic events, or announcements. Be aware of major upcoming events, and try to position yourself before the news breaks or after it has been absorbed by the market.
- **Follow Volume**: Volume is crucial in momentum trading. If a price move is accompanied by high volume, it signals strength in the trend. Low volume can indicate a weak or short-lived move.
5. **Trade with the Trend, Not Against It**:
- **Buy in Uptrends, Sell in Downtrends**: Momentum traders make profits by trading with the direction of the trend. If the market is in an uptrend, focus on buying (long positions). If it's in a downtrend, consider selling (short positions).
- **Don’t Fight Reversals**: Even if a trend seems like it will reverse, it’s better to wait for confirmation before betting against it. Prematurely shorting an uptrend or going long in a downtrend can lead to significant losses.
6. **Control Your Emotions**:
- **Stay Disciplined**: Momentum trading can be fast-paced, and it’s easy to get caught up in emotions like fear or greed. Stick to your strategy and don’t make decisions based on impulse.
- **Cut Losses Early**: If a trade isn’t working out as expected, cut your losses quickly rather than hoping the trend will reverse. The quicker you get out, the less impact a losing trade will have on your overall profitability.
7. **Backtest and Refine Your Strategy**:
- **Test Your Approach**: Before committing real money, backtest your momentum trading strategy on historical data to see how it would have performed. This helps you refine entry and exit points, risk management rules, and trade timing.
- **Adapt to Changing Market Conditions**: Momentum can work differently in different market environments (e.g., trending vs. range-bound markets). Be prepared to adjust your strategy based on current market conditions.
---
### Example of a Momentum Trading Strategy:
- **Buy Signal**:
- The price of stock XYZ breaks through a key resistance level on high volume.
- The RSI is above 50 but not overbought (below 70), confirming a strong upward momentum.
- You enter a long position when the price breaks out.
- **Sell Signal**:
- The stock hits a key price target or resistance level.
- RSI shows overbought conditions, or the price starts showing signs of reversal (e.g., a small bearish candlestick pattern).
- You exit the position and take profits, or you set a trailing stop to lock in gains if the price continues to rise.
---
### Risks of Momentum Trading:
- **Reversals**: Trends can reverse suddenly, causing momentum traders to lose money quickly. It’s important to react fast and cut losses.
- **Chasing the Trend**: Entering a trade after a trend has already been established can result in buying at high prices or selling at low prices.
- **Market Noise**: Momentum traders can get whipsawed in choppy, sideways markets, as trends are not clear and the price moves unpredictably.
---
### How to Be Profitable in Momentum Trading:
1. **Start Small**: Begin with a small position size until you gain experience with the strategy and develop your skills.
2. **Master Risk Management**: Always use stop-loss orders and know your risk-to-reward ratio before entering any trade.
3. **Stay Disciplined and Follow a Plan**: Avoid emotional decision-making and stick to your strategy.
4. **Track Your Performance**: Keep a trading journal to analyze your trades and learn from both your successes and mistakes.

What is option trading and how to use it ?Option trading involves buying and selling options contracts on financial instruments, such as stocks, commodities, or indices. An option gives the buyer the right, but not the obligation, to buy or sell an underlying asset at a specific price (called the **strike price**) within a specified period (called the **expiration date**).
There are two main types of options:
1. **Call options**: Gives the holder the right to **buy** the underlying asset at the strike price.
2. **Put options**: Gives the holder the right to **sell** the underlying asset at the strike price.
### Key Terms:
- **Premium**: The price paid for the option itself.
- **Strike Price**: The price at which the option holder can buy (for calls) or sell (for puts) the underlying asset.
- **Expiration Date**: The date the option expires. After this date, the option becomes worthless if not exercised.
- **In the Money (ITM)**: When exercising the option would lead to a profit (e.g., a call option's strike price is below the current market price of the asset).
- **Out of the Money (OTM)**: When exercising the option would not lead to a profit.
- **At the Money (ATM)**: When the strike price is equal to the current market price of the asset.
### How to Use Option Trading:
1. **Hedging**: Options can be used to protect against price movements in an asset you already own. For example, buying put options can protect your stock holdings from a potential drop in price.
2. **Speculation**: Traders can buy options to profit from expected movements in the price of an underlying asset. For example, buying call options when you expect the stock price to rise, or buying put options when you expect it to fall.
3. **Income Generation (Writing Options)**: You can also write (sell) options to generate income through premiums. The risk here is that, if the option is exercised, you will have to fulfill the terms of the contract (buying or selling the underlying asset at the strike price).
### Example:
- **Buying a Call Option**: If you think a stock will rise in price, you could buy a call option. If the stock price rises above your strike price, you can either exercise the option to buy at the lower price or sell the option for a profit.
- **Buying a Put Option**: If you think a stock will fall in price, you could buy a put option. If the stock price falls below your strike price, you can either exercise the option to sell at the higher price or sell the option for a profit.
### Risks:
- **Limited Loss**: For option buyers, the maximum loss is limited to the premium paid for the option.
- **Unlimited Loss (for Sellers)**: If you're selling options (writing options), your potential losses are theoretically unlimited, especially when selling uncovered (naked) options.
### Strategy Tips:
1. **Start Simple**: Beginners should focus on buying options rather than writing them.
2. **Understand Volatility**: Options are highly sensitive to volatility, so understanding how market fluctuations affect options prices is crucial.
3. **Practice with a Demo Account**: Many brokers offer paper trading or demo accounts that let you practice options trading without real money at risk.
4. **Diversify**: Don't put all your capital into options; consider it a tool within a broader investment strategy.

What is candlestick patterns ?**Candlestick patterns** are formations created by one or more candlesticks on a price chart, used by traders to predict future price movements in financial markets. Each candlestick represents the price action for a specific time period (e.g., 1 minute, 1 hour, daily), and the pattern they form can provide insights into market sentiment and potential price direction.
### Basic Components of a Candlestick:
A single candlestick consists of the following parts:
- **Body**: The thick part of the candlestick that represents the difference between the opening and closing prices.
- **Bullish Body**: If the closing price is higher than the opening price (typically represented by a white or green body).
- **Bearish Body**: If the closing price is lower than the opening price (typically represented by a black or red body).
- **Wicks (Shadows)**: The thin lines above and below the body that represent the highest and lowest prices reached during the time period.
- **Upper Wick (Shadow)**: The line above the body showing the highest price.
- **Lower Wick (Shadow)**: The line below the body showing the lowest price.
### Types of Candlestick Patterns:
Candlestick patterns can be categorized into **single candlestick patterns** (formed by one candlestick) and **multiple candlestick patterns** (formed by two or more candlesticks). These patterns are used to identify potential reversals or continuations in market trends.
#### **Single Candlestick Patterns**:
1. **Doji**:
- A Doji candlestick occurs when the opening and closing prices are almost the same, resulting in a very small body with long wicks on both sides.
- **Interpretation**: It indicates indecision in the market. A Doji after a strong trend can signal a potential reversal or slowdown in price movement.
- **Example**: If a Doji appears after a strong uptrend, it might indicate that the buying pressure is weakening, suggesting a possible reversal to a downtrend.
2. **Hammer**:
- A **Hammer** has a small body near the top with a long lower wick and little or no upper wick.
- **Interpretation**: It occurs after a downtrend and can signal a potential reversal to the upside, as the price moved lower during the session but closed near the opening price.
3. **Inverted Hammer**:
- An **Inverted Hammer** has a small body at the bottom and a long upper wick.
- **Interpretation**: It can appear after a downtrend and signals potential bullish reversal, as it shows that buyers tried to push the price higher but closed near the opening price.
4. **Shooting Star**:
- A **Shooting Star** has a small body near the bottom, a long upper wick, and little or no lower wick.
- **Interpretation**: It appears after an uptrend and indicates a potential bearish reversal. It shows that buyers pushed the price up during the session, but sellers took control by the close.
#### **Multiple Candlestick Patterns**:
1. **Engulfing Pattern**:
- **Bullish Engulfing**: A small red (bearish) candlestick followed by a large green (bullish) candlestick that completely engulfs the previous one.
- **Interpretation**: It suggests a potential reversal to the upside from a downtrend.
- **Bearish Engulfing**: A small green (bullish) candlestick followed by a large red (bearish) candlestick that completely engulfs the previous one.
- **Interpretation**: It suggests a potential reversal to the downside from an uptrend.
2. **Morning Star**:
- The **Morning Star** is a three-candlestick pattern. It consists of:
1. A long bearish candlestick.
2. A small candlestick (which can be bullish or bearish) that gaps down.
3. A long bullish candlestick that closes above the midpoint of the first candlestick.
- **Interpretation**: It is a strong bullish reversal pattern that appears after a downtrend.
3. **Evening Star**:
- The **Evening Star** is the opposite of the Morning Star and is a three-candlestick pattern consisting of:
1. A long bullish candlestick.
2. A small candlestick (which can be bullish or bearish) that gaps up.
3. A long bearish candlestick that closes below the midpoint of the first candlestick.
- **Interpretation**: It indicates a potential bearish reversal, occurring after an uptrend.
4. **Harami**:
- **Bullish Harami**: A small green candlestick contained within the body of a preceding large red candlestick.
- **Interpretation**: It suggests a potential reversal to the upside after a downtrend.
- **Bearish Harami**: A small red candlestick contained within the body of a preceding large green candlestick.
- **Interpretation**: It suggests a potential reversal to the downside after an uptrend.
5. **Piercing Pattern**:
- The **Piercing Pattern** is a two-candlestick pattern where the first is a long red candlestick, and the second is a long green candlestick that opens below the low of the previous red candle but closes above its midpoint.
- **Interpretation**: It indicates a potential bullish reversal after a downtrend.
6. **Dark Cloud Cover**:
- The **Dark Cloud Cover** is the opposite of the Piercing Pattern. It consists of a long green candlestick followed by a long red candlestick that opens above the high of the green candle but closes below its midpoint.
- **Interpretation**: It signals a potential bearish reversal after an uptrend.
#### **Key Takeaways and Practical Use**:
1. **Trend Reversal**: Many candlestick patterns indicate potential **trend reversals**. For example, **Hammer**, **Shooting Star**, **Engulfing Patterns**, **Morning/Evening Stars**, and **Harami** patterns are all signs of a possible shift in market sentiment and trend direction.
2. **Trend Continuation**: Some patterns indicate that the existing trend is likely to continue, such as **Bullish Engulfing** in an uptrend or a **Bearish Engulfing** in a downtrend.
3. **Context is Key**: Candlestick patterns work best when interpreted in the context of the broader market trend. For instance, a **Hammer** pattern after a prolonged downtrend might be more significant than one appearing in a sideways or uptrend market.
4. **Confirmation**: It’s often advisable to wait for confirmation of a candlestick pattern before taking action. This could mean waiting for the price to close beyond a certain level or using additional technical indicators (like **RSI**, **MACD**, or **Moving Averages**) to confirm the signal.
5. **Risk Management**: Like all trading strategies, candlestick pattern analysis should be used with **risk management techniques** (such as **stop-loss** orders) to minimize potential losses in case the pattern fails.
### Conclusion:
Candlestick patterns are a vital part of technical analysis, offering valuable insights into market sentiment and potential future price movements. By understanding the significance of individual candlesticks and multi-candle patterns, traders can make more informed decisions. However, candlestick patterns should be used in combination with other tools and indicators to improve accuracy and avoid false signals.

what is option chain pcr ?**Option Chain PCR (Put-Call Ratio)** is a popular metric used by traders and investors to gauge market sentiment and make decisions regarding the strength of a market move. It’s derived from the **option chain**, which is a listing of all the available **call** and **put** options for a specific asset (e.g., stocks, indices) and their various strike prices and expiration dates.
### Key Concepts of Option Chain PCR:
1. **Put-Call Ratio (PCR)**:
- The **Put-Call Ratio** is the ratio of the total number of **put options** (bearish bets) to the total number of **call options** (bullish bets) traded in the market for a specific underlying asset, during a particular time period (like a day or week).
- The formula for PCR is:
\
Where:
- **Total Puts Open Interest**: The total open interest (the number of outstanding contracts) for put options.
- **Total Calls Open Interest**: The total open interest for call options.
2. **Interpretation of PCR**:
- **PCR > 1**: If the PCR is greater than 1, it indicates that there are more put options being traded compared to call options. This suggests a **bearish sentiment** in the market, as traders are anticipating a potential decline in the underlying asset's price.
- **PCR < 1**: If the PCR is less than 1, it indicates that there are more call options being traded compared to put options. This suggests a **bullish sentiment**, as traders expect the price of the underlying asset to rise.
- **PCR = 1**: A PCR of 1 indicates a neutral sentiment, meaning the number of calls and puts is balanced, showing no strong directional bias from the options market.
3. **What PCR Can Tell You**:
- **Bullish Sentiment**: A low PCR (below 1) often indicates that traders are more inclined toward buying call options, which reflects a positive outlook on the asset. The market participants are expecting an upward movement in the price.
- **Bearish Sentiment**: A high PCR (above 1) usually signals that more traders are buying put options, indicating a bearish outlook. It suggests that the market expects a decline in the price of the asset.
- **Contrarian Indicator**: The PCR can also be a **contrarian indicator**. For example, when the PCR is extremely high (indicating heavy bearish sentiment), it could signal that the market is overly pessimistic and a potential reversal to the upside could occur. Similarly, an extremely low PCR might suggest that the market is overly optimistic, and a price correction or reversal could be imminent.
4. **PCR in Context**:
- The PCR can be more useful when analyzed in conjunction with other factors. For example:
- **High PCR during a market selloff**: It may indicate that the market is reaching extreme pessimism, and a reversal could be on the horizon.
- **Low PCR during a market rally**: It might suggest overconfidence, and a pullback or correction could be possible.
5. **PCR on Different Timeframes**:
- **Daily PCR**: Measures the sentiment based on daily option activity, often reflecting short-term sentiment.
- **Weekly/Monthly PCR**: Provides a broader perspective on market sentiment over a longer horizon. For long-term investors, looking at the weekly or monthly PCR can provide insights into general market sentiment and expectations.
### How to Use Option Chain PCR in Trading:
1. **Market Sentiment Analysis**:
- PCR is a tool for assessing overall **market sentiment** and helps traders understand whether the market is currently dominated by bulls (call buyers) or bears (put buyers). This helps in forming a general view of market direction.
2. **Spotting Market Extremes**:
- A very **high PCR** (e.g., above 1.5 or 2) could indicate excessive pessimism and might signal an **oversold condition**, suggesting that the market is due for a reversal to the upside.
- A very **low PCR** (e.g., below 0.5 or 0.4) could indicate excessive optimism and could point to an **overbought condition**, suggesting the market might be due for a pullback or reversal.
3. **Trend Confirmation**:
- If the PCR is rising steadily in a bull market, it can indicate that the market is becoming increasingly bearish, and a reversal could be imminent.
- Conversely, a rising PCR during a bear market could indicate growing bullish sentiment, signaling the possibility of a reversal or market bottom.
4. **Combination with Other Indicators**:
- The PCR should ideally be combined with other technical indicators like **Moving Averages**, **RSI**, and **MACD** to confirm trends and avoid false signals.
- **Open interest data** (how many contracts are open) in addition to PCR can also provide additional confirmation about the strength of a trend.
### Example of Using PCR:
1. **Bullish Market**:
- You notice that the PCR has been consistently **below 1** during a market rally, indicating that traders are buying more calls than puts, reflecting strong bullish sentiment.
- The PCR moves even lower, indicating extreme optimism, but no significant signs of reversal in price are seen. In this case, the PCR supports the continuation of the bullish trend.
2. **Bearish Market**:
- During a market correction or downtrend, the PCR is consistently **above 1**, suggesting that more traders are buying puts, and the market sentiment is largely bearish.
- If the PCR becomes **extremely high**, this could indicate **overbought conditions** in terms of bearish sentiment, suggesting that the market may be oversold and could reverse.
### Conclusion:
The **Option Chain PCR (Put-Call Ratio)** is a valuable tool for measuring market sentiment, providing insights into whether the market is overly bullish or bearish. A high PCR indicates bearish sentiment, while a low PCR suggests bullish sentiment. The PCR can help traders assess the likelihood of a market reversal, but it should be used in conjunction with other technical analysis tools and indicators to get a more comprehensive view of the market. It's also important to note that extreme values in PCR (both high and low) could signal a potential change in trend or price direction, but this should be verified with other confirmation signals.

what is price action ?**Price action** refers to the movement of an asset’s price over time, depicted through charts. It is the study of historical price data to make trading decisions, without relying on technical indicators or other external tools. In other words, price action traders focus purely on the price itself—its patterns, trends, and movements—believing that all necessary information is contained within the price action.
### Key Concepts in Price Action:
1. **Candlestick Patterns**:
- **Candlestick charts** are commonly used in price action analysis. These charts show the open, high, low, and close prices for a given time period.
- Certain candlestick patterns (like Doji, Engulfing, Hammer, or Shooting Star) are used to identify potential market reversals or continuations.
2. **Support and Resistance**:
- **Support** is the price level at which an asset tends to find buying interest, causing the price to bounce upward.
- **Resistance** is the price level at which an asset tends to encounter selling pressure, causing the price to move lower.
- Price action traders often watch these levels to predict potential reversals or breakouts.
3. **Trends**:
- Price action trading is largely based on understanding market trends (uptrends, downtrends, or sideways movement).
- Traders use **higher highs and higher lows** in an uptrend, and **lower highs and lower lows** in a downtrend to identify and trade with the trend.
- The idea is to "trade with the trend" rather than against it, as trends tend to persist over time.
4. **Price Patterns**:
- Traders look for recurring price patterns such as **triangles**, **flags**, **head and shoulders**, **double tops**, and **double bottoms**. These patterns help in forecasting future price movements.
- For instance, a **double top** pattern (a resistance level followed by a pullback, then another attempt to break the resistance) can signal a potential bearish reversal.
5. **Market Structure**:
- **Higher highs** and **higher lows** indicate an uptrend.
- **Lower highs** and **lower lows** indicate a downtrend.
- A trader’s goal is to identify the structure of the market and trade based on whether it’s in an uptrend, downtrend, or consolidation phase.
6. **Breakouts and Pullbacks**:
- **Breakouts** occur when the price moves beyond a defined support or resistance level, signaling the start of a new trend.
- **Pullbacks** (or retracements) are temporary reversals within the existing trend, and traders often look to enter positions during pullbacks to trade in the direction of the trend.
### How to Use Price Action in Trading:
1. **Identify the Trend**:
- The first step in price action trading is identifying whether the market is trending (up, down, or sideways).
- In an uptrend, you’d typically look for buying opportunities when the price pulls back to a level of support or a previous low.
- In a downtrend, you’d look for selling opportunities at resistance or previous highs.
2. **Look for Key Levels**:
- Identify major **support** and **resistance** levels where price has historically reversed. These levels act as psychological barriers for traders, and price action often tends to react to them.
- **Breakouts** above resistance or below support can indicate the start of a new trend.
3. **Trade Patterns**:
- Watch for **candlestick patterns** (like pin bars, engulfing candles, or dojis) at key levels. These can act as signals for potential trend reversals or continuations.
- For example, a **bullish engulfing candle** at a support level could suggest the start of an uptrend, while a **bearish engulfing** at a resistance level could signal a downtrend.
4. **Wait for Confirmation**:
- Price action traders often wait for price to confirm a setup before entering a trade. For instance, if the price breaks above resistance, they may wait for a pullback to test the new support before entering a long trade.
5. **Risk Management**:
- Price action traders use **stop-loss** orders placed at logical levels based on the price structure (for example, below a recent low in an uptrend).
- **Position sizing** is also crucial. Since price action can often be subjective, it’s important to use proper risk management to avoid large losses.
### Benefits of Price Action Trading:
- **No Indicators Needed**: Price action trading is based purely on price data, making it simple and easy to follow, without relying on technical indicators.
- **Flexibility**: Price action can be used across different time frames, from minute charts to daily or weekly charts.
- **Versatility**: It works across all asset classes (stocks, forex, commodities, crypto, etc.), and it is ideal for both short-term and long-term traders.
- **Clear Signals**: Price action trading gives direct, clear signals based on price movements, which many traders find easier to interpret than complex indicators.
### Drawbacks of Price Action Trading:
- **Subjectivity**: Interpreting price action can sometimes be subjective, as it depends on the trader’s understanding of the price movements and patterns.
- **Requires Experience**: Price action trading involves a lot of nuance and requires experience to recognize and act on subtle price signals effectively.
- **Lack of Confirmation**: Without indicators, traders may sometimes miss the confirmation signals, leading to false or untimely trades.
### Example of Price Action in a Trade:
- A trader sees that a stock has been in a **bullish trend** for a few weeks (price making higher highs and higher lows).
- The stock pulls back to a level of **previous support** (a point where price has reversed before).
- At that support level, the trader notices a **bullish engulfing candlestick pattern** forming.
- The trader enters a **buy** position, placing a stop loss just below the support level, aiming to capture the next upward movement.
### Conclusion:
Price action trading is a straightforward yet powerful method for analyzing and trading markets based on price movements alone. By focusing on patterns, trends, and key price levels, traders can make decisions without relying on complex indicators. However, it does require a keen eye and experience to interpret price movements correctly, and it’s essential to combine it with sound risk management practices.

what is adx and how to use it ?**ADX (Average Directional Index)** is a technical indicator used to measure the strength of a trend, regardless of whether the trend is bullish or bearish. It’s part of the **Directional Movement System**, developed by J. Welles Wilder. ADX helps traders identify whether a market is trending or in a range-bound (sideways) phase, and how strong that trend is.
### 1. **Components of ADX**
The ADX indicator consists of three components:
- **ADX Line**: The main line that measures the strength of the trend.
- **+DI (Positive Directional Indicator)**: Shows the strength of upward price movement.
- **-DI (Negative Directional Indicator)**: Shows the strength of downward price movement.
These three components work together to give traders an overall sense of the market's direction and strength.
### 2. **How ADX Works**
- **ADX Line**:
- The ADX line itself ranges from 0 to 100, with the following interpretations:
- **0–25**: Weak or no trend. The market is range-bound or moving sideways.
- **25–50**: Moderate trend. The market is starting to develop a trend but it’s not overly strong yet.
- **50–75**: Strong trend. The market is trending well and the trend is likely to continue.
- **75–100**: Very strong trend. The market is experiencing a highly directional trend, and it’s often harder to trade against it.
- **+DI and -DI**:
- **+DI** represents the strength of upward price movements, while **-DI** measures the strength of downward price movements.
- When **+DI** crosses above **-DI**, it signals potential upward momentum (bullish trend).
- When **-DI** crosses above **+DI**, it signals potential downward momentum (bearish trend).
### 3. **How to Use ADX for Trading**
- **Trend Strength Identification**:
- **ADX below 25**: Market is weak and moving sideways. There’s no clear trend, so this is usually a time for range trading.
- **ADX between 25 and 50**: A trend is forming, and it’s a good time to trade in the direction of the trend. The higher the ADX, the stronger the trend.
- **ADX above 50**: The trend is very strong, and it’s usually better to follow the direction of the trend, as reversals are less likely.
- **Crossovers of +DI and -DI**:
- When **+DI** crosses above **-DI**, it’s a potential signal for a bullish trend.
- When **-DI** crosses above **+DI**, it’s a potential signal for a bearish trend.
- **Trend Reversals and Continuations**:
- If the ADX is rising above 25 and **+DI** is above **-DI**, it indicates a strengthening bullish trend.
- If the ADX is rising above 25 and **-DI** is above **+DI**, it signals a strengthening bearish trend.
- A falling ADX, even with a crossover between +DI and -DI, may indicate a potential trend reversal or that the trend is losing strength.
### 4. **Using ADX in Combination with Other Indicators**
- **ADX and Moving Averages**: Moving averages can help confirm the direction of the trend. For example, if ADX is above 25 and the price is above a long-term moving average, this confirms a strong uptrend.
- **ADX and RSI (Relative Strength Index)**: While ADX measures trend strength, RSI measures overbought or oversold conditions. Combining these two can give better insights into when a trend might be nearing its end (for example, if the ADX shows a strong trend but RSI indicates overbought/oversold levels, a reversal could be imminent).
- **ADX and MACD (Moving Average Convergence Divergence)**: The MACD can show momentum in the trend, while ADX shows its strength. Using them together can help confirm whether a strong trend is likely to continue.
### 5. **Example of How to Trade Using ADX**
- **Buy Signal**:
- ADX rises above 25 (indicating the start of a trend).
- +DI crosses above -DI (indicating a bullish trend).
- Consider entering a **long** (buy) position.
- **Sell Signal**:
- ADX rises above 25 (indicating the start of a trend).
- -DI crosses above +DI (indicating a bearish trend).
- Consider entering a **short** (sell) position.
- **Exit Signal**:
- If ADX starts falling below 25, it may suggest the trend is weakening or the market is entering a sideways phase. This might be a good time to exit the trade or tighten stop losses.
### 6. **Limitations of ADX**
- **Lagging Indicator**: ADX is a lagging indicator, meaning it confirms trends after they have started. Therefore, it may not give early signals.
- **No Directional Signal**: ADX doesn’t tell you whether the trend is up or down. It only measures the strength of the trend, so you need to use it alongside other indicators like +DI and -DI to determine the trend direction.
- **False Signals in Sideways Markets**: In choppy or sideways markets, ADX may fluctuate around low levels and give false signals, so it’s important to combine ADX with other tools to ensure you’re trading in the right conditions.
### 7. **Conclusion**
ADX is a useful tool for determining the strength of a trend, helping traders decide whether to enter a trade or not based on trend strength. For effective use, it’s best combined with other indicators, such as the moving averages, RSI, or MACD, to ensure you're trading in the right direction and under the right market conditions.

Sobha Ltd### **Comprehensive Analysis of Sobha Ltd.**
#### **1. Fundamental Analysis:**
**Overview:**
Sobha Ltd. is a prominent player in the Indian real estate sector, known for its high-quality residential, commercial, and contractual projects. The company is primarily engaged in the development of residential and commercial spaces, including luxury and premium residential projects. Sobha Ltd. is headquartered in Bengaluru, Karnataka, and has a presence across key cities in India. It is also known for its commitment to delivering superior-quality real estate developments.
**Key Financials (as of latest available data):**
- **Market Capitalization**: ₹11,800 crore (as of Feb 2025)
- **Revenue Growth**: Sobha has seen fluctuating revenue growth in recent years, with the pandemic causing short-term disruptions in its operations. However, post-pandemic, there has been a recovery in the real estate market, particularly in the luxury and premium residential segments, which has benefited the company.
- **Profitability**: The company has historically maintained strong profit margins due to its focus on premium and luxury projects, which typically offer higher margins. However, the business is capital-intensive and can experience margin compression during periods of economic slowdown or increased input costs.
- **Debt Levels**: Sobha’s debt levels have been higher compared to some of its peers in the real estate sector, which poses a risk in periods of rising interest rates or economic uncertainty. Nonetheless, the company has been working on improving its debt position by monetizing non-core assets and focusing on reducing its debt load.
**Recent Developments:**
- **Real Estate Recovery**: The Indian real estate sector, particularly in the luxury and high-end residential segments, has seen a strong recovery post-COVID, and Sobha Ltd. has benefited from this trend with strong sales in its premium residential developments.
- **Expansion Plans**: Sobha has been expanding its footprint beyond traditional markets like Bengaluru and Pune. The company has recently ventured into newer cities like Chennai, Gurugram, and Kochi, where it is focusing on high-end residential and commercial projects.
- **Cost Management Initiatives**: The company has been implementing several cost-cutting measures, such as reducing construction costs, optimizing land acquisition strategies, and focusing on in-house construction activities to control costs.
- **Sustainability Focus**: Sobha has also been emphasizing sustainable construction practices, ensuring that its developments adhere to green building standards, which has become a growing trend in the industry.
**Key Strengths:**
- **Reputation for Quality**: Sobha is known for its commitment to delivering high-quality real estate projects, which has earned it a strong brand presence in the market.
- **Diversified Product Portfolio**: Sobha’s product portfolio includes residential, commercial, and contractual projects, offering diversification and reducing dependency on any single segment.
- **Strong Sales in Luxury Segment**: Sobha's focus on the luxury and premium real estate segment provides a strong margin profile, and the demand for such properties has been resilient in recent years.
- **Experienced Management**: The company is led by an experienced management team with a strong track record in real estate development, which ensures effective execution of projects.
**Risks:**
- **High Debt Levels**: Sobha has relatively high levels of debt, which could be a concern in the event of rising interest rates or any cash flow disruptions.
- **Real Estate Cycles**: The real estate market is cyclical, and any downturn in the sector due to economic conditions, interest rate hikes, or a slowdown in demand could impact Sobha’s financial performance.
- **Regulatory Risks**: Sobha operates in a highly regulated environment, and changes in government policies, land acquisition laws, or construction regulations could pose risks to its operations.
- **Fluctuating Raw Material Costs**: As with any real estate company, Sobha is subject to fluctuations in the prices of raw materials like steel and cement, which could affect its project costs and margins.
---
#### **2. Technical Analysis:**
**Current Price Action (as of February 2025):**
- **Stock Price**: ₹797 (as of Feb 2025)
- **52-week High/Low**: ₹944 (High) – ₹620 (Low)
- **Recent Trend**: Sobha Ltd. has shown a strong upward trend since reaching its 52-week low of ₹620, rallying to ₹797. The stock has been consolidating in a range, and it has recently tested the support zone around ₹760-780, with resistance around ₹820-840.
**Moving Averages:**
- **50-Day Moving Average (50-DMA)**: ₹790
- **200-Day Moving Average (200-DMA)**: ₹725
- The stock is currently trading above both its 50-DMA and 200-DMA, indicating that the medium-to-long-term trend is positive. If the stock sustains above the 50-DMA, it could signal continued upward momentum.
**Relative Strength Index (RSI):**
- RSI is at **58**, indicating that the stock is in neutral territory. It’s not overbought or oversold, but if the RSI approaches 70, the stock could enter overbought territory, suggesting caution.
**MACD (Moving Average Convergence Divergence):**
- The MACD line is above the signal line, suggesting a bullish momentum. A strong uptrend could continue if the MACD remains above the signal line.
**Volume Analysis:**
- Volume has been consistent, with occasional spikes during rallies, suggesting that there is support for the stock’s current price action. However, the stock needs a sustained increase in volume to confirm breakout moves above resistance levels.
---
#### **3. Support and Resistance Levels:**
**Support Levels:**
- **₹760-780**: The immediate support zone for Sobha Ltd. lies between ₹760 and ₹780, which has acted as a floor for the stock in recent weeks. A breakdown below this level could lead to further downside towards ₹725.
- **₹725**: The secondary support level is near ₹725, which corresponds to the 200-DMA.
**Resistance Levels:**
- **₹820-840**: The immediate resistance for the stock is between ₹820 and ₹840, with several price tests around this zone. A breakout above this level would indicate further bullish momentum.
- **₹900**: The next significant resistance is near ₹900, which aligns with previous highs and acts as a psychological barrier for the stock.
**Key Levels to Watch for Short-Term Movement:**
- **Immediate Resistance**: ₹820-840 (recent high)
- **Immediate Support**: ₹760-780 (recent low)
---
#### **4. Risk and Reward Outlook:**
**Risk Factors:**
- **Debt Burden**: High levels of debt in a capital-intensive industry like real estate could be risky, especially in an environment of rising interest rates or an economic downturn.
- **Regulatory Risks**: The real estate sector is subject to various regulatory changes. Any new regulations or delays in approvals could negatively impact project timelines and financial performance.
- **Economic Slowdown**: An economic slowdown or a reduction in consumer spending could impact demand for residential properties, especially in the premium and luxury segments.
**Reward Potential:**
- **Recovery in Real Estate**: The recovery in the real estate market, especially in the premium and luxury segments, provides Sobha Ltd. with strong growth prospects. With rising incomes and a growing urban population, demand for high-quality residential projects is expected to continue.
- **Brand Strength**: Sobha’s reputation for quality construction and timely delivery provides it with a competitive advantage in the real estate market. The company’s diversified project portfolio and strong market presence make it well-positioned for long-term growth.
- **Improved Financial Position**: Sobha’s focus on reducing its debt levels and monetizing non-core assets can lead to an improvement in its financial health, making it less vulnerable to macroeconomic or industry-specific risks.
---
#### **5. Investment Recommendation:**
- **Long-Term Investors**: Sobha Ltd. is a solid long-term investment in the real estate sector, particularly for those looking to capitalize on the growth of India’s urbanization and demand for premium real estate. The company’s strong brand, quality focus, and expansion into new markets position it well for future growth. Investors may consider entering around **₹760-780** for better risk-reward positioning.
- **Short-Term Traders**: Traders could look for a breakout above **₹820-840** to enter long positions. If the stock fails to break resistance and starts trending lower, a move towards **₹725** could be a potential downside.
---
### **Disclaimer:**
The information and analysis provided here are for educational and informational purposes only. We are not registered with SEBI (Securities and Exchange Board of India) or any other regulatory body, and this should not be construed as investment advice. Stock market investments are subject to market risks, and past performance is not indicative of future results. Before making any investment decisions, it is important to conduct thorough research, seek advice from a certified financial advisor, and understand your risk tolerance. The views expressed are based on publicly available data and personal analysis and may not necessarily reflect the views of other professionals or organizations.

Indian energy exchange ltd### **Comprehensive Analysis of Indian Energy Exchange Ltd (NSE: IEX)**
#### **1. Fundamental Analysis:**
**Overview:**
Indian Energy Exchange Ltd (IEX) is India’s largest electricity exchange, offering a platform for the trading of electricity in India. The exchange operates a day-ahead market, intra-day market, and term-ahead market, allowing for the buying and selling of electricity in both short and medium-term periods. IEX plays a crucial role in India’s energy markets by facilitating efficient electricity price discovery and offering renewable energy certificates and energy-saving certificates for sustainability initiatives.
**Key Financials (as of latest available data):**
- **Market Capitalization**: ₹16,900 crore (as of Feb 2025)
- **Revenue Growth**: IEX has consistently shown growth in revenue, driven by increased trading volumes, a larger share of the energy market, and growing demand for renewable energy certificates.
- **Profitability**: The company maintains strong margins and profitability, with a business model that benefits from a dominant position in the electricity trading space.
- **Debt Levels**: IEX has a debt-free balance sheet, which gives it financial stability. The company generates strong free cash flow, allowing it to reinvest in growth and pay dividends to its shareholders.
**Recent Developments:**
- **Government Policies**: The government’s push for electricity market reforms, renewable energy growth, and clean energy initiatives supports IEX's long-term growth prospects. Policies like renewable energy certificates (RECs) are expected to benefit IEX’s business model.
- **Increased Trading Volumes**: The electricity demand in India is rising, and as the market becomes more efficient, IEX is expected to capture a higher share of total traded energy.
- **Diversification into Ancillary Markets**: IEX is working on expanding into new areas like power derivatives and offering products related to energy transition (e.g., carbon credits and RECs).
**Key Strengths:**
- **Dominance in the Market**: IEX is the leader in the electricity trading market, with a dominant share in daily electricity trading volumes.
- **Regulatory Support**: The regulatory framework in India is supportive of exchanges like IEX, with the government encouraging transparency and efficiency in the energy markets.
- **No Debt**: A debt-free balance sheet allows IEX to invest in innovation and other growth initiatives without significant financial stress.
- **Sustainability Focus**: As the push toward renewable energy grows, IEX is poised to benefit from trading renewable energy certificates, which are becoming more integral to India’s energy transition goals.
**Risks:**
- **Market Competition**: Although IEX is the market leader, it faces competition from other electricity exchanges and new players in the renewable energy certificate and carbon credit markets.
- **Regulatory Changes**: Changes in government policies or regulations could impact IEX's operations. The energy sector is heavily regulated, and any unfavorable changes could impact trading volumes or margins.
- **Dependency on Electricity Demand**: IEX’s business is directly tied to the overall demand for electricity in India, and any economic slowdown or disruptions to electricity consumption could hurt the exchange’s revenue.
- **Technological Risks**: As IEX’s operations are technology-driven, any system failures or cyberattacks could affect its operations and investor confidence.
---
#### **2. Technical Analysis:**
**Current Price Action (as of February 2025):**
- **Stock Price**: ₹167 (as of Feb 2025)
- **52-week High/Low**: ₹233 (High) – ₹152 (Low)
- **Recent Trend**: The stock has been in a downtrend since its 52-week high in mid-2024, recently testing support levels near ₹160-170. This range has acted as a strong support zone, and the stock is now consolidating within this range.
**Moving Averages:**
- **50-Day Moving Average (50-DMA)**: ₹173
- **200-Day Moving Average (200-DMA)**: ₹195
- IEX is currently trading below both its 50-DMA and 200-DMA, indicating a bearish trend in the short-to-medium term. The stock would need to cross above the 200-DMA to indicate a trend reversal to the upside.
**Relative Strength Index (RSI):**
- RSI is at **39**, suggesting that the stock is in the oversold territory, which may indicate that the stock is due for a potential bounce. However, an RSI below 30 would suggest a more oversold condition, so the stock could still face further downside before a reversal.
**MACD (Moving Average Convergence Divergence):**
- The MACD line is currently below the signal line, confirming bearish momentum. However, a crossover of the MACD above the signal line could signal an impending bullish reversal.
**Volume Analysis:**
- Volume has been relatively low in recent weeks, indicating a lack of strong directional momentum. A significant increase in volume would be needed to confirm any breakout above resistance levels or a potential breakdown below support.
---
#### **3. Support and Resistance Levels:**
**Support Levels:**
- **₹160-170**: The stock has a strong support zone around ₹160-170. This range has acted as support during recent corrections, and a break below this could trigger further downside toward ₹150.
- **₹145**: A secondary support level lies around ₹145, which is close to the lower end of the stock’s recent price range.
**Resistance Levels:**
- **₹180-190**: The immediate resistance lies around ₹180-190. A breakout above this level could suggest a trend reversal and allow the stock to move toward its 50-DMA.
- **₹200-210**: A more significant resistance zone exists between ₹200-210, which corresponds to the 200-DMA and previous price levels.
**Key Levels to Watch for Short-Term Movement:**
- **Immediate Resistance**: ₹180 (50-DMA)
- **Immediate Support**: ₹160 (recent low)
---
#### **4. Risk and Reward Outlook:**
**Risk Factors:**
- **Regulatory Risks**: Changes in government policies and regulations in the energy market could impact IEX’s growth. Any negative regulatory changes could lead to a reduction in traded volumes.
- **Competition**: Growing competition in the electricity trading market and the entry of new players into the renewable energy market could affect IEX’s market share.
- **Economic Downturns**: In periods of economic slowdown, electricity demand could fall, affecting IEX’s revenue, as trading volumes could decline.
**Reward Potential:**
- **Growth in Trading Volumes**: IEX has strong long-term growth potential as India’s electricity consumption continues to rise. Additionally, the move toward cleaner energy (e.g., renewables and carbon credits) offers new avenues for growth.
- **Market Leadership**: IEX’s leadership in the electricity trading space positions it to benefit from growing demand for energy trading platforms in India.
- **Government Support**: Continued government support for energy reforms, smart grid technologies, and renewable energy growth provides a favorable outlook for IEX.
---
#### **5. Investment Recommendation:**
- **Long-Term Investors**: IEX presents an attractive opportunity for long-term investors, especially as India’s energy market undergoes modernization and the demand for renewable energy grows. The stock’s dominance in the electricity exchange space and its exposure to green energy trading offer solid growth potential. Investors may consider accumulating the stock closer to support levels around ₹160-170, particularly if it shows signs of recovery.
- **Short-Term Traders**: For short-term traders, watching for a breakout above **₹180-190** could present a good entry point. Alternatively, a breakdown below **₹160** could trigger further downside, and traders might consider exiting or shorting the stock in such a scenario.
---
### **Disclaimer:**
The information and analysis provided here are for educational and informational purposes only. We are not registered with SEBI (Securities and Exchange Board of India) or any other regulatory body, and this should not be construed as investment advice. Stock market investments are subject to market risks, and past performance is not indicative of future results. Before making any investment decisions, it is important to conduct thorough research, seek advice from a certified financial advisor, and understand your risk tolerance. The views expressed are based on publicly available data and personal analysis and may not necessarily reflect the views of other professionals or organizations.

What is fibonacci retracements and how to gain profit from it ?### **What is Fibonacci Retracement?**
**Fibonacci Retracement** is a popular technical analysis tool that helps traders identify potential levels of support and resistance in a trending market. It is based on the Fibonacci sequence, a series of numbers where each number is the sum of the two preceding ones (e.g., 0, 1, 1, 2, 3, 5, 8, 13, etc.). The key ratios derived from this sequence — **23.6%, 38.2%, 50%, 61.8%, and 78.6%** — are used as potential levels at which an asset's price may retrace before continuing its trend.
In technical analysis, **Fibonacci retracements** are plotted by drawing a line between the **high** and **low** points of a recent price movement (either upward or downward). The horizontal lines are drawn at the key Fibonacci levels between those points. These levels act as potential zones where prices could reverse or find support/resistance.
---
### **Key Fibonacci Retracement Levels:**
1. **23.6%** – The shallowest level of retracement, typically indicating a weak pullback.
2. **38.2%** – A moderate retracement that is often considered a strong level of support or resistance.
3. **50%** – Although not a Fibonacci number, this level is significant in technical analysis. A 50% retracement is a commonly observed level for potential reversal.
4. **61.8%** – The most important Fibonacci level, often referred to as the "golden ratio." This level is frequently seen as a strong support or resistance area.
5. **78.6%** – A deeper retracement level, signaling a significant correction or pullback.
---
### **How to Use Fibonacci Retracements to Gain Profit?**
Fibonacci retracements help traders find entry points, set stop-loss levels, and define profit targets based on historical price movements. Here’s how you can apply Fibonacci retracements to gain profit:
#### **1. Identify the Trend:**
Before using Fibonacci retracement, it’s crucial to **identify the prevailing market trend** (uptrend or downtrend). Fibonacci retracements work best in trending markets, whether bullish or bearish.
- **In an Uptrend:** Identify the most recent **low** and **high** points. Fibonacci retracements are drawn from the low to the high, as the price is expected to retrace back down before continuing higher.
- **In a Downtrend:** Identify the most recent **high** and **low** points. Fibonacci retracements are drawn from the high to the low, as the price is expected to retrace upward before continuing lower.
#### **2. Draw Fibonacci Retracement Levels:**
- To apply Fibonacci retracement:
- In an **uptrend**, draw the Fibonacci retracement tool from the **lowest point** (start of the trend) to the **highest point** (end of the trend).
- In a **downtrend**, draw the Fibonacci retracement tool from the **highest point** (start of the trend) to the **lowest point** (end of the trend).
This will automatically plot horizontal lines at the key Fibonacci levels (23.6%, 38.2%, 50%, 61.8%, and 78.6%) on the chart.
#### **3. Watch for Price Reactions at Fibonacci Levels:**
Once you’ve plotted the Fibonacci retracement levels, watch how the price reacts as it approaches these levels:
- **Support in an Uptrend**: When the price pulls back to a Fibonacci retracement level, it may find **support** at one of these levels before bouncing back in the direction of the prevailing trend.
- **Resistance in a Downtrend**: In a downtrend, as the price retraces upward, it may encounter **resistance** at one of these levels before continuing lower.
#### **4. Enter the Trade:**
Once the price approaches a key Fibonacci level, look for signs of a **reversal**. This could be in the form of candlestick patterns (e.g., bullish engulfing or bearish engulfing), **divergence** with indicators (e.g., RSI or MACD), or other technical signals indicating the price is likely to reverse or continue in the direction of the trend.
- **In an Uptrend**: Look for the price to find support at a Fibonacci level (like 38.2%, 50%, or 61.8%) and begin to move higher. You could enter a **buy trade** when the price shows signs of reversal (e.g., bullish candlestick patterns).
- **In a Downtrend**: Look for the price to face resistance at a Fibonacci level and begin to move lower. You could enter a **sell trade** when signs of reversal (e.g., bearish candlestick patterns) appear.
#### **5. Set Stop Losses and Take Profits:**
Once you’ve entered a trade, it’s crucial to set **stop-loss orders** to protect your capital and **take-profit levels** to lock in gains.
- **Stop-Loss:** Place your stop-loss slightly below (for a buy) or above (for a sell) the Fibonacci level, depending on where the price retraced. If the price breaks through the Fibonacci level significantly, it could indicate that the trend is reversing, and you should exit the trade.
- **Take-Profit**: Use the next Fibonacci level as a potential **take-profit target**. For example, if you enter a buy trade after a pullback to the 50% level, you could set your target at the 23.6% level or the previous high.
#### **6. Combine with Other Indicators:**
Fibonacci retracement works best when combined with other technical analysis tools. Using multiple confirmation signals can increase the reliability of the trade setup:
- **RSI (Relative Strength Index)**: Use RSI to check for overbought or oversold conditions. For example, if the price pulls back to the 61.8% level, and RSI shows **oversold conditions**, this could confirm that the price may reverse upward.
- **MACD (Moving Average Convergence Divergence)**: Use MACD to confirm trend momentum. If the price approaches a Fibonacci level and you see a bullish or bearish MACD crossover, this can add confirmation to your trade.
- **Candlestick Patterns**: Watch for reversal candlestick patterns (e.g., bullish engulfing, hammer, shooting star) at key Fibonacci levels to strengthen your trade entry.
---
### **Examples of Fibonacci Retracement in Action**
1. **Bullish Trend Example**:
- The price of a stock moves from $100 to $150 (a 50% gain).
- You draw Fibonacci retracement from $100 (low) to $150 (high).
- The key retracement levels will be 23.6% at $141.80, 38.2% at $138.90, 50% at $125, and 61.8% at $123.20.
- The price pulls back to the 50% level at $125 and starts to bounce back up, showing bullish candlestick patterns like a **hammer**.
- You enter a **buy** position at $126, place your stop-loss at $123, and target the previous high of $150 for profit.
2. **Bearish Trend Example**:
- The price of a stock moves from $200 to $150 (a 25% decline).
- You draw Fibonacci retracement from $200 (high) to $150 (low).
- The key retracement levels will be 23.6% at $157.80, 38.2% at $161.80, 50% at $175, and 61.8% at $178.40.
- The price retraces to the 38.2% level at $161.80 and begins to show bearish signals (e.g., **bearish engulfing candlestick**).
- You enter a **sell** position at $160, place your stop-loss at $164, and set a take-profit target at $150 (previous low).
---
### **How to Maximize Profits Using Fibonacci Retracements**
1. **Trade with the Trend**: Fibonacci retracements work best in trending markets. Always identify the trend first and trade in the direction of that trend.
2. **Look for Confirmation**: Do not rely solely on Fibonacci levels. Always look for additional confirmation signals like candlestick patterns, volume, and oscillators (RSI, MACD) before entering a trade.
3. **Combine with Other Fibonacci Tools**: In addition to retracements, use **Fibonacci extensions** to project future price levels where the trend might continue after the retracement.
4. **Use Multiple Timeframes**: Check Fibonacci retracement levels on higher timeframes (e.g., daily or weekly) to identify stronger, more reliable support/resistance levels.
5. **Monitor Volume**: A price movement toward a Fibonacci level with high volume often indicates a more reliable support or resistance level.
### **Conclusion:**
Fibonacci retracement is a powerful tool that can help traders identify potential reversal levels in trending markets. By combining Fibonacci retracement levels with other technical analysis tools and proper risk management, you can increase the probability of successful trades and potentially profit from market corrections or continuations.

how smart money moves and takes trades in markets ?**Smart money** refers to the capital invested by institutional investors, hedge funds, banks, and other entities with extensive market knowledge, expertise, and resources. These participants are considered to have a significant edge over retail traders due to their access to large amounts of data, proprietary research, and advanced tools. Smart money moves are often driven by fundamental analysis, macroeconomic trends, and technical indicators, and they can have a profound influence on the direction of markets.
### **How Smart Money Moves in Markets**
Smart money typically follows a methodical approach to trading, incorporating both long-term and short-term strategies, with a strong emphasis on risk management and market analysis. Here are some key ways smart money operates:
---
### **1. **Market Sentiment and Macro Trends:**
Smart money closely monitors **macroeconomic conditions** (interest rates, inflation, employment data, GDP, etc.) and adjusts their positions accordingly. They focus on understanding **economic cycles** and key market indicators that may affect asset prices.
- **Example**: If the Federal Reserve signals an interest rate cut, smart money may anticipate higher stock prices and move into growth sectors or long positions in stocks. Conversely, if inflation rises and interest rates increase, they might hedge by investing in inflation-protected securities, commodities like gold, or defensive sectors (e.g., utilities, healthcare).
### **2. **Position Sizing and Risk Management:**
Smart money traders are highly disciplined when it comes to position sizing and **risk management**. They use sophisticated models to determine the appropriate size of each trade based on factors like volatility, risk/reward ratios, and drawdown potential.
- **Example**: If they have a high-confidence trade, they might risk a larger portion of their capital. However, they will always place stop-loss orders to protect their investment. Conversely, for lower-confidence trades, they may reduce position size significantly.
### **3. **Institutional Flow and Volume Analysis:**
One of the most important indicators of smart money movement is **institutional flow** — large buy and sell orders from institutions that drive price action. Institutional investors often have a significant impact on prices due to the sheer size of their trades.
- **Smart money** tracks **volume** closely to detect **unusual buying or selling** activity. If they see significant volume spikes in a stock, especially if the price moves rapidly in one direction, this can indicate that institutional players are entering or exiting a position.
- **Example**: If a stock has been moving sideways for weeks but suddenly sees a surge in volume and price, this might signal a smart money move. Traders will often watch for **accumulation** (slow buying) or **distribution** (slow selling) patterns to follow the large players.
### **4. **Market Manipulation and Liquidity**
Smart money often influences market prices by using **liquidity** in a way that retail traders cannot easily replicate. They may create false signals or take advantage of low liquidity periods to accumulate or offload positions without causing significant price disruptions.
- **Example**: During a market open or close (when liquidity can be lower), institutional traders might place large orders, creating a **false move** that triggers stop-losses for retail traders, allowing them to enter at favorable prices after the initial panic.
### **5. **Volume-Based Indicators:**
Many of the tools smart money uses are based on **volume** indicators and **market depth**. They often look for discrepancies between price movements and volume, as well as divergences between price action and technical indicators.
- **Smart money** is highly adept at using technical analysis indicators such as **On-Balance Volume (OBV)**, **Accumulation/Distribution**, and **Money Flow Index (MFI)** to track institutional buying and selling activity.
---
### **6. **Dark Pools and Off-Exchange Trading:**
One of the secrets behind how smart money moves is the use of **dark pools**—private exchanges where institutional investors can buy and sell large quantities of stock without revealing their trades to the public market. This allows them to execute large orders without causing a significant impact on the stock price.
- **Example**: If an institution wants to buy a large amount of stock without influencing the market, they may use a dark pool. Retail traders will not see this buy order until it is reported after the fact.
---
### **7. **Contrarian Moves:**
Smart money is often **contrarian** in its approach. Institutional investors tend to make long-term bets and may take positions when the general market sentiment is overwhelmingly bearish or bullish, betting on a reversal of trends.
- **Example**: During a market crash or a period of heightened uncertainty, retail traders might panic and sell their positions. Smart money, on the other hand, may view the drop as an opportunity to buy undervalued assets. This approach is often referred to as **buying the dip**.
- Conversely, when the market is overly bullish and everyone is euphoric, smart money might sell into strength, anticipating a correction.
### **8. **Algorithmic and High-Frequency Trading (HFT):**
Smart money also uses **algorithmic trading** and **high-frequency trading (HFT)** strategies, executing thousands of trades in fractions of a second. These algorithms are designed to exploit **market inefficiencies** by analyzing real-time data, spotting patterns, and executing orders before humans can react.
- **Example**: An algorithm might detect a pattern where a stock's price fluctuates within a narrow range for a short period and trade on the volatility, profiting from tiny price movements.
---
### **9. **Insider Information and Research:**
While **insider trading** (illegal in most markets) involves using non-public information to make trades, smart money often has access to superior **research**, which includes market-moving information well ahead of the general public. They use sophisticated methods to interpret and act on this research.
- **Example**: If an institutional investor gets early access to earnings reports or geopolitical events, they might place trades based on this information before it becomes public knowledge.
---
### **10. **Following Key Technical Levels:**
Smart money uses **technical analysis** extensively to make trading decisions. They pay close attention to **support and resistance levels**, **trendlines**, **Fibonacci retracements**, and **moving averages**.
- **Example**: If a stock is approaching a key support level, and institutional investors are looking to accumulate positions, they may step in with large buy orders, pushing the price higher from that support.
---
### **Key Characteristics of Smart Money Trades:**
1. **Discretionary and Systematic**: While smart money may use discretionary techniques (e.g., fundamental analysis or reading market sentiment), it also relies heavily on **systematic strategies** (e.g., algorithmic trading or quantitative models).
2. **Long-Term Focus**: While they might also engage in short-term trading, institutional investors often have a **longer-term investment horizon**, making them less susceptible to short-term price fluctuations.
3. **Market Influencers**: Their trades can significantly move the market, especially in highly liquid stocks or markets.
4. **Data-Driven**: Smart money uses **big data**, advanced analytics, and research to make informed decisions and minimize risk.
---
### **How Can Retail Traders Follow Smart Money?**
Retail traders can attempt to follow smart money by:
- **Monitoring Large Orders**: Using tools that track **large orders**, **volume**, and **open interest** to identify potential moves by institutional investors.
- **Following Fund Flows**: Analyzing **fund flow data** can provide insight into where institutions are putting their money (e.g., sector rotation, ETFs, or mutual funds).
- **Looking for Divergences**: Observing **divergences** between price action and volume indicators (e.g., **On-Balance Volume (OBV)**) can signal institutional activity.
- **Tracking Dark Pool Activity**: Some services and platforms allow traders to see trends in dark pool trading, giving insights into institutional buying or selling pressure.
- **News and Events**: Following **earnings reports**, **geopolitical news**, and **central bank decisions** can give you insight into the decisions that smart money might be making.
---
### **Summary:**
Smart money operates with a combination of **sophisticated tools, data, and strategies** that retail traders often don’t have access to. They tend to have a **long-term outlook**, focusing on **risk management** and using **institutional flows, macroeconomic analysis**, and **technical indicators** to make decisions. By following their moves, retail traders can attempt to align their strategies with institutional investors, but it requires diligence, analysis, and an understanding of market dynamics.
Would you like more insights into how to track smart money or tools to follow their moves?

what is RSI and how to use it ?The **Relative Strength Index (RSI)** is a popular momentum oscillator used in technical analysis to measure the speed and change of price movements. It helps traders determine if an asset is overbought, oversold, or in a neutral condition, aiding in spotting potential reversal points or confirming trends.
### Key Features of RSI:
- **Range**: The RSI is displayed on a scale of 0 to 100.
- **Overbought**: RSI above 70 indicates that an asset may be overbought (potential reversal or correction down).
- **Oversold**: RSI below 30 indicates that an asset may be oversold (potential reversal or bounce up).
- **Neutral**: RSI between 30 and 70 suggests that the asset is in a neutral zone, with no clear overbought or oversold conditions.
### Formula for RSI:
The formula for calculating the RSI is a bit complex, but in simple terms, it compares the magnitude of recent gains to recent losses:
\
Where:
- \(RS\) is the average of "n" periods' up closes divided by the average of "n" periods' down closes.
For example, in a 14-period RSI:
- RSI is calculated over the last 14 periods (can be 14 days, 14 hours, etc.).
- The formula first calculates the average gain and loss over this period, then uses this ratio to produce the RSI value.
### How to Use RSI in Trading:
1. **Overbought/Oversold Conditions**:
- **Overbought (RSI > 70)**: When RSI exceeds 70, the asset may be overbought, indicating a potential reversal or pullback. Traders may look to sell or short the asset.
- **Oversold (RSI < 30)**: When RSI falls below 30, the asset may be oversold, signaling a possible reversal to the upside. Traders may look to buy or go long.
2. **RSI Divergence**:
- **Bullish Divergence**: If the price is making new lows, but RSI is making higher lows, this indicates that selling momentum is weakening and a reversal to the upside could occur.
- **Bearish Divergence**: If the price is making new highs, but RSI is making lower highs, it suggests that buying momentum is weakening and a reversal to the downside might follow.
3. **RSI Crossovers**:
- **RSI Crossing Above 30**: When the RSI crosses from below 30 to above 30, it can be interpreted as a signal of a potential reversal or start of an uptrend.
- **RSI Crossing Below 70**: When the RSI crosses from above 70 to below 70, it can signal that the overbought conditions are ending, potentially indicating a downturn.
4. **Centerline Crossover**:
- **RSI > 50**: When RSI is above 50, the trend is generally bullish.
- **RSI < 50**: When RSI is below 50, the trend is generally bearish.
5. **RSI as Trend Confirmation**:
- **Above 50**: If the RSI remains above 50, it confirms that the prevailing trend is bullish.
- **Below 50**: If the RSI remains below 50, it confirms that the prevailing trend is bearish.
### Example of RSI Usage:
- **Bullish Setup**: If a stock is oversold with RSI at 25, and it starts to rise above 30, it could signal a potential buying opportunity as the asset moves out of the oversold condition.
- **Bearish Setup**: If a stock has RSI above 75 (overbought) and starts to fall below 70, it could be a sign to sell or short, anticipating a correction.
### RSI Strategy Examples:
1. **RSI Strategy with Trend**:
- **Bullish Trend**: Only take long trades when the RSI is above 50 and rising. Wait for an RSI pullback to 40 or higher and then enter a long position.
- **Bearish Trend**: Only take short trades when the RSI is below 50 and falling. Look for RSI to rise above 60 (potential overbought condition) before entering short.
2. **RSI + Support/Resistance**:
- Combine RSI with key support or resistance levels. If RSI is in an oversold condition and the price is approaching a strong support level, it might present a good long entry opportunity. Similarly, if RSI is overbought near resistance, it might signal a short opportunity.
3. **RSI + Moving Average Crossovers**:
- Use the RSI in combination with moving averages (e.g., 50-period or 200-period moving average) to confirm trends. For example, a bullish trend could be confirmed when the price is above the moving average and RSI is above 50.
### Pros of Using RSI:
- RSI is simple and effective for spotting potential reversals.
- It is an excellent tool for confirming trends and signals.
- Works well with both trending and ranging markets.
### Cons of Using RSI:
- **False Signals**: In strong trending markets, RSI may remain in overbought or oversold conditions for extended periods, making it less effective as a standalone indicator.
- **Lagging Indicator**: Like many technical indicators, RSI is reactive, not predictive.
- **No Volume Data**: RSI does not factor in volume, so it should ideally be combined with other volume-based indicators to get a clearer picture.

how to ride the big moves in the stock market ?Riding big moves in the stock market is every trader and investor's goal. The key is to identify potential large moves early, stay patient, and manage risk effectively. It requires a combination of strategy, patience, and discipline to maximize profits while minimizing losses. Here’s a breakdown of how to go about it:
### 1. **Identify Strong Trends Early**
To ride big moves, you need to spot strong trends early before they reach their peak.
- **Trend Identification**: Look for assets with strong upward or downward momentum. You can use technical indicators like:
- **Moving Averages** (e.g., 50-day, 200-day) to identify the prevailing trend.
- **Trendlines**: Draw trendlines to confirm that the price is moving in a clear direction (higher highs and higher lows for an uptrend, lower highs and lower lows for a downtrend).
- **Moving Average Convergence Divergence (MACD)**: This indicator can help confirm a strong trend when the MACD line crosses above (bullish) or below (bearish) the signal line.
- **Breakouts**: Watch for breakouts from key support or resistance levels, especially after periods of consolidation. Breakouts signal that the stock might move significantly in one direction. You can use **volume** to confirm that a breakout is legitimate (higher volume on the breakout suggests strong buying/selling interest).
- **Volume Analysis**: Volume is critical in understanding whether a big move is likely. A surge in volume often precedes significant price movements. If the stock starts to move with increasing volume, it’s more likely to sustain the move.
### 2. **Use Trend Following Strategies**
Once you've identified a trend, the key to riding the big move is to stay in the trade as long as the trend remains intact.
- **Trailing Stop-Losses**: Set a trailing stop-loss that moves with the price to lock in profits while still allowing for more upside potential. This method helps you stay in the trade without worrying about sudden reversals while protecting profits as the price rises.
- **Indicators for Trend Continuation**:
- **Relative Strength Index (RSI)**: When RSI is below 70 (for long trades) or above 30 (for short trades), it indicates that the stock is not overbought or oversold, making it suitable for continuation.
- **Moving Average Crossovers**: For example, a 50-day moving average crossing above a 200-day moving average (Golden Cross) can signal the start of a longer-term trend.
- **Position Sizing**: As the trend develops and you’re confident in it, you can scale into your position gradually, using a larger position size to capitalize on bigger moves while managing your risk.
### 3. **Use Momentum Indicators**
Momentum indicators can help you stay in the trade longer and confirm the strength of a move.
- **Momentum Oscillators** like the **Stochastic Oscillator** or **RSI** can indicate when an asset is overbought or oversold. However, be careful—these indicators work best in trending markets, as overbought conditions in strong uptrends can still lead to higher prices.
- **Average True Range (ATR)**: ATR helps to assess the volatility of a stock. In big moves, ATR can be used to set wider stop-losses, allowing you to stay in the trade without getting stopped out too early due to normal market fluctuations.
### 4. **Use Fundamental Analysis for Long-Term Moves**
Fundamentals can drive long-term trends, and keeping an eye on them will help you spot big moves well in advance.
- **Strong Earnings Growth**: Companies with consistent earnings growth tend to see their stock prices rise over time. Look for stocks with rising earnings per share (EPS), improving profit margins, and strong guidance.
- **Breakout Catalysts**: Some stocks have catalysts, such as new product launches, mergers, or acquisitions, that can drive long-term movements. These events can result in a prolonged upward or downward trend.
- **Market Sentiment**: Broad market sentiment, economic cycles, and industry trends often fuel large moves. For instance, if a particular sector is gaining attention (e.g., renewable energy), it could drive a sector-wide rally.
### 5. **Be Patient and Avoid Chasing the Market**
Patience is key to riding the big moves.
- **Avoid FOMO**: Fear of missing out (FOMO) can lead you to chase after a stock that has already moved significantly, potentially causing you to buy at the peak. Instead, focus on finding opportunities when the price corrects or consolidates before the next big move.
- **Let the Trend Run**: Once you're in a trade, avoid the temptation to take profits too early. Let the stock reach its potential based on your analysis. If you believe in the trend, give it time to play out.
- **Stay Disciplined**: Stick to your trading plan, and do not deviate based on emotions. Don’t let fear or greed cause you to exit too early or hold too long without reassessing the trend.
### 6. **Leverage Risk Management**
To ride big moves, you need to effectively manage your risk so you can stay in the game.
- **Stop-Losses**: Set stop-loss orders to limit your downside. They help you stay in the trade during normal fluctuations but exit if the price reverses drastically. You can adjust your stop-loss levels as the trend continues in your favor.
- **Risk/Reward Ratio**: Ensure you have an optimal risk/reward ratio. For example, aim for a risk-to-reward ratio of 1:3 or better, meaning you risk $1 to make $3 or more. This ensures that even if some trades don’t work out, the profitable ones will compensate for losses.
- **Position Sizing**: Make sure your position size is in line with your overall risk tolerance and portfolio size. You want to capture big moves but avoid taking on too much risk on any single trade.
### 7. **Ride Big Moves with Options (Advanced)**
For those who want to amplify their potential profit from big moves, options trading can be a powerful tool. However, this requires experience and understanding of risk.
- **Call Options**: In a strong uptrend, buying call options allows you to profit from the upward movement of a stock without actually owning the stock.
- **Put Options**: If you are anticipating a downtrend, put options allow you to benefit from the decline in a stock’s price.
- **Option Spreads**: You can use option spreads to limit risk while still participating in big moves.
### 8. **Market Conditions and Timeframes Matter**
Big moves can happen across different timeframes, whether you're trading on an intraday basis or investing long-term.
- **Short-Term Moves (Day Trading)**: If you're day trading, you need to be extremely fast and nimble. Use tools like momentum indicators, volume analysis, and price action to catch big moves within the trading day.
- **Long-Term Moves (Swing or Position Trading)**: If you're in for the long haul, focus on daily or weekly charts and use fundamental analysis, trend-following techniques, and patience. Big moves in stocks can sometimes take months or years to materialize, so longer-term analysis is critical.
### 9. **Monitor and Adjust**
Once you’ve identified a big move, it’s important to continue monitoring the stock and the broader market.
- **Stay Updated**: Pay attention to earnings reports, news, and market changes. Big moves can sometimes be triggered by external factors like government policies, economic reports, or global events.
- **Reassess When Necessary**: If the trend shows signs of weakening (e.g., decreasing volume, reversal patterns), it might be time to adjust your position, lock in profits, or exit the trade.
### Conclusion:
Riding big moves in the stock market requires a combination of **patience, discipline, and strategy**. By identifying strong trends early, using trend-following strategies, managing risk, and staying focused on your goals, you can position yourself to capture large market moves. Always remember that big moves don't happen every day, so being patient, waiting for the right setups, and managing your trades effectively are keys to long-term success.
