XAUUSD – Trend-Following StrategyXAUUSD – Trend-Following Plan: Prefer Buying the Dip (H1)
Gold is still holding a bullish short-term structure with higher highs and higher lows. The recent push up shows buyers are in control, so my main focus is NOT chasing price, but waiting for a clean pullback into key support to join the trend with controlled risk.
🎯 MAIN SCENARIO – BUY THE DIP (Priority)
Buy Zone: 4687 – 4690
Stop Loss: Below 4655
Take Profits:
TP1: 4735 – 4745
TP2: 4780
TP3: 4804 – 4808
Why this zone?
4687–4690 is the key area highlighted on the chart as a major level. After price pushed above it, this zone can act as new support (previous resistance becomes support). If price retests and holds with clear rejection (wicks, bullish engulfing, strong bounce), this is the higher-probability buy location in line with the trend.
🔁 SECONDARY SCENARIO – DEEP BUY AT LIQUIDITY / IMBALANCE
Buy Zone: 4620 – 4600 (Liquidity Imbalance area)
Stop Loss: Below 4575
Take Profits:
TP1: 4687
TP2: 4735
TP3: 4780+
Why this zone?
The chart shows a clear liquidity imbalance below price that has not been fully filled. If the market performs a deeper sweep (stop-hunt / flush), this zone becomes a strong candidate for a trend continuation buy with better R:R.
📊 TECHNICAL VIEW (What the chart is telling us)
Price is still trading within a bullish structure and respecting the rising trendline.
The latest impulse up suggests active demand, not just a weak drift.
The most logical approach is to let price come to you: buy support, not breakout candles.
The upside magnet remains the 4804–4808 area, which is also the next major reaction zone.
🌍 MACRO CONTEXT (Keep it simple)
Gold remains supported in the broader environment where risk sentiment can shift quickly.
Unless USD strength returns aggressively, pullbacks are more likely to be bought than to start a full bearish reversal.
That’s why the plan stays trend-following: wait for dips and execute with discipline.
🧠 EXECUTION RULES (Discipline > Opinions)
No FOMO buys at extended highs.
Only take the trade inside the planned zones and only with confirmation.
Risk per trade stays controlled (1–2% max). If the idea is wrong, cut it fast and reassess—no “hope trading.”
📌 SUMMARY
Bias: Bullish (H1)
Strategy: Buy the dip at 4687–4690, or deeper at 4620–4600
Targets: 4735–4745 → 4780 → 4804–4808
If you want, I can also rewrite this in a shorter TradingView-post style (more punchy, fewer words) while keeping the same levels and rules.
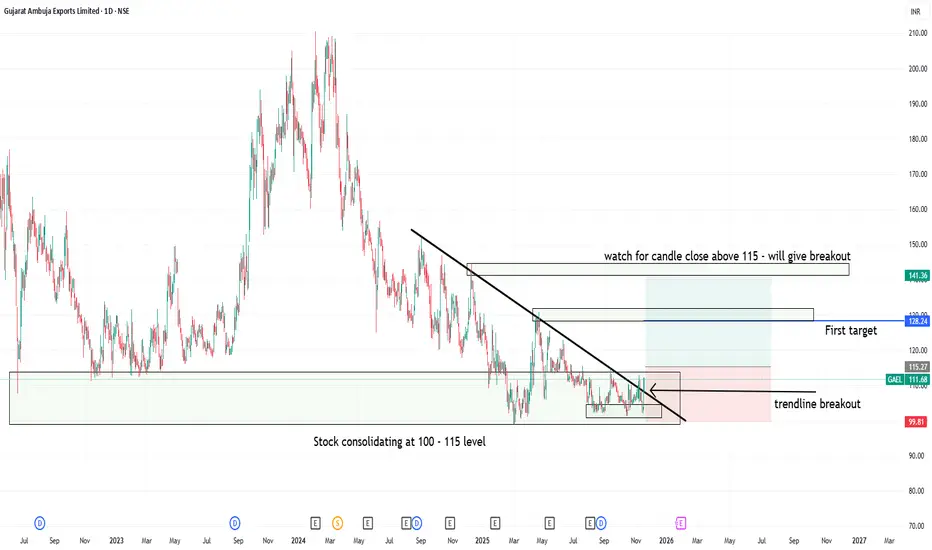
Tecnicalanalysis

Trendline breakout at support level in GAEL1. Gujrat ambuja export lt- showing consolidation at 100 to 115 levels
2. Candle close above 115 can trigger consolidation breakout at strong support zone
3. Trendline breakout has already happend but above 115 close will be safe and logical
4. Good Risk:Reward one can watch for upside movement with strict sl level
Technical Analysis Vs Institutional Trading Option Trading Part1Technical Analysis (TA):
Uses charts & indicators to time entries/exits.
Best for directional option trades (calls/puts), short-term moves.
Institutional Trading:
Focuses on liquidity, options flow, open interest, gamma.
Best for selling premium and trading ranges with lower risk.
Bottom line:
👉 TA = when to trade
👉 Institutional = where & why price moves
👉 Best edge = use both together
Professional Reality (Important)
📌 Institutions don’t predict direction — they manage risk
📌 Retail traders try to be right — institutions try to get paid
📌 Options are a probability business, not a prediction game

XAUUSD – Intraday retracementXAUUSD – Intraday Pullback & Continuation Setup | Lana ✨
Gold is entering a technical correction phase after testing the ATH zone, while the medium-term bullish structure remains intact. Today’s move looks more like a controlled pullback to rebalance liquidity, not a trend reversal.
📉 Current Price Behaviour
Price has reacted from the ATH supply zone, forming a short-term lower high.
The market is currently testing the rising trendline, which is a key dynamic support in this bullish cycle.
As long as price holds above structural support, the broader bias stays bullish.
This correction is technically healthy after a strong impulsive leg.
🔑 Key Technical Zones to Watch
Sell test / rejection zone: ATH area
Short-term sellers are active here, causing the current pullback.
Buy zone 1: 4495 – 4498
A former value level and trendline confluence zone, suitable for reaction buys.
Buy zone 2: 4442 – 4446
Stronger support and deeper liquidity area if the pullback extends.
These zones are where buyers are expected to step back in.
📈 Trading Scenarios
Primary scenario:
Wait for price to complete the pullback into 4495–4498, then look for bullish confirmation to rejoin the trend.
Alternative scenario:
If sell pressure increases, the 4442–4446 zone becomes the key level to watch for stronger buy reactions.
A clean hold above the trendline keeps the upside structure valid, with ATH retest as the next objective.
🌍 Fundamental Context
According to CME FedWatch, the market is pricing in a 95% probability that the Fed keeps interest rates unchanged in January.
The probability of a January rate cut remains very low at 5%.
Expectations for March also lean toward no change, with rate cuts still uncertain.
This reinforces a stable macro backdrop for gold, where pullbacks are more likely to be driven by profit-taking and positioning, rather than a shift in monetary policy.
🧠 Notes
This is a pullback within an uptrend, not a bearish reversal.
Focus on buying value, not chasing highs.
Let price confirm at key zones before entering.
✨ Stay patient, respect the structure, and let the market come to your levels.

XAUUSD – Uptrend remains intactXAUUSD – The uptrend is still intact; we just need that decisive break.
Gold is maintaining a strong bullish momentum within the rising channel, consistently printing higher lows. However, price is now approaching a psychological resistance cluster, so the next move could easily include a sharp shakeout to sweep liquidity before the market commits to direction.
Macro context
In periods where markets are sensitive to news flow and interest-rate expectations, gold often finds support from safe-haven demand. But when price is trading at elevated levels, the optimal approach remains the same: don’t chase candles — only act when price reaches key technical zones.
Technical view (H1)
The primary trend remains bullish, with price respecting the rising trendline.
The current area sits in a “premium” zone (prone to profit-taking / sharp pullbacks).
Two key clusters stand out on the chart:
Near psychological resistance: 4630–4640
Next psychological resistance: 4765 (expanded upside target)
Key levels
Near resistance: 4630–4640
Major resistance: 4760–4765
Support / pivot level: 4540 (previous resistance, now potential support)
Deeper support: 4400 (base zone, only relevant if a strong reversal develops)
Trading scenarios
Scenario 1: Trend BUY (priority)
Condition: Price holds above 4630–4640 and continues forming bullish structure.
Entry: Buy the pullback at 4605–4615
SL: 4595
TP1: 4685–4700
TP2: 4760–4765
This is the cleanest setup: a mild retracement, then continuation with the trend.
Scenario 2: Safer BUY on support retest
If price spikes down to sweep liquidity:
Entry: Buy 4540–4545
SL: 4528
TP: 4630 → 4685 → 4765
4540 is a key line in the sand — as long as it holds, the uptrend stays strong.
Scenario 3: Reaction SELL (short-term only)
Only consider sells if there’s clear rejection at resistance:
Sell: 4760–4765
SL: 4778
TP: 4685 → 4635 → 4540
Or, if price fails to hold 4630–4640 and closes weak:
Sell: 4625–4635
SL: 4650
TP: 4545
Conclusion
The dominant trend remains bullish, but price is pressing into psychological resistance — so execution must be “right level, right reaction.” The priority remains buying with the trend, and only selling if there’s a clean rejection at 4765 or a confirmed failure to hold 4630–4640.
👉 If this plan helps, follow LiamTradingFX for daily XAUUSD updates as early as possible.

XAUUSD – H2 Technical OutlookXAUUSD – H2 Technical Outlook | Lana ✨
Gold continues to trade within a strong bullish structure, and price action is confirming that the market is still respecting the ascending trend channel on the H2 timeframe.
📈 Market Structure & Trend Context
The overall trend remains bullish, with higher highs and higher lows clearly intact.
Price has successfully flipped the 4445–4450 zone from resistance into support, confirming strong buyer commitment.
The impulsive leg toward the current highs suggests we are still in a continuation phase, not a distribution phase.
🔍 Key Technical Zones & Liquidity
Buy resistance flip: 4445–4450
This zone has already shown clean reactions and acts as a structural base for further upside.
POC Buy zone: 4595–4600
This is a high-volume node where price is likely to rebalance liquidity before the next expansion.
Sellside liquidity sits just below current price, making a shallow pullback into value very possible before continuation.
🎯 Bullish Scenarios
Primary plan: Look for BUY setups on pullbacks into 4595–4600 (POC) with bullish confirmation.
Continuation target: If price accepts above current highs, the next upside objective sits around 4747, where higher-timeframe liquidity is resting.
A clean hold above the trendline keeps the bullish thesis valid.
🧠 Notes
Avoid chasing price at highs; wait for pullbacks into value and liquidity zones.
Trade in alignment with trend + structure, not short-term noise.
Patience is key while the market builds liquidity before the next expansion.
✨ Stay disciplined, trade the structure, and let price come to your zone.

XAUUSD (H1) – Powell Subpoena ImpactXAUUSD (H1) – Powell Subpoena Shock: Gold enters a high-volatility week, trade liquidity zones
News that the US Department of Justice has issued a criminal subpoena involving Fed Chair Jerome Powell is an extremely rare type of headline. When the market’s confidence in the Fed and US policy stability gets questioned, gold and silver can surge fast — but the price action often comes with violent two-way swings: a sharp push to grab liquidity, a hard pullback, then the real direction shows.
That’s why this week I’m not chasing candles. The best approach is to trade reactions at key liquidity / support-resistance zones and let the market come to your levels.
Macro context: why gold is moving differently right now
Pressure on the Fed (and its independence) can reprice expectations for rates, which directly hits USD and US yields.
If the market starts pricing aggressive cuts, gold tends to stay supported. But if yields whip around, gold can whipsaw too — fast.
So instead of predicting the headline outcome, the priority is simple: wait for price to hit clean technical zones.
Technical view (H1): uptrend structure holds, but price is trading in “premium”
The structure still sits inside an ascending channel. After a strong impulsive leg up, price is consolidating near the top — a common setup before another expansion, but also a zone where liquidity grabs are frequent.
Key zones to focus on
Sell zone (premium): 4655 – 4660
Buy zone (value): 4413 – 4417
Mid-range resistance (chop zone): around the 45xx area
Trading scenarios (Liam style: trade the level)
1) Primary plan: BUY the pullback into value
If price retraces into the major value support:
Buy: 4413 – 4417
SL: 4403
TP1: 4500 – 4520
TP2: 4655 – 4660
This is the “clean structure” setup: a reset into value, then continuation with the channel.
2) Short-term scalp: SELL the premium reaction
If price pushes into the major supply/liquidity zone:
Sell (scalp): 4655 – 4660 (only with clear rejection on H1/M15)
SL: 4670
TP: 4580 → 4520
This is a reaction sell — a common “profit-taking” area after headline-driven pumps.
3) Continuation setup: BUY after a confirmed hold above mid resistance
If price breaks and holds above the mid resistance (45xx area):
Look for a pullback after breakout to buy
Targets remain towards 4655–4660, then higher along the channel.
Conclusion
This is a headline-risk week, so the key is no FOMO and no entries in the middle of the range. The two zones that matter most:
Buy value: 4413 – 4417
Sell premium (short-term): 4655 – 4660
Which side are you leaning towards — waiting for the dip into 4415 to buy, or hunting a rejection near 4660 to sell?
👉 If this plan helps, follow LiamTradingFX to get the next XAUUSD updates early.

Unveiling Hidden Symmetrical Triangle and Saving from FakeoutsThis weekly chart post highlights key price action elements in a sideways pattern, focusing on zones, trendlines, and a subtle symmetrical triangle for educational observation. Green demand zones and red supply zones frame the overall range, while the white counter trend line traces internal fluctuations. The dotted red line uncovers a hidden symmetrical triangle, where converging lines often lead to breakout rejections observed as fakeouts
Key Chart Features
-Demand & Supply Zones: Green areas mark demand support, red zones indicate supply resistance, revealing price reactions within the sideways structure.
-Counter Trend Line: White line connects minor highs and lows, illustrating counter-trend swings that define the internal rhythm amid broader consolidation.
-Hidden Symmetrical Triangle: Dotted red outline exposes the converging pattern, a consolidation coil with balanced higher lows and lower highs, frequently trapping breakout attempts.
Disclaimer: Not a SEBI-registered advisor. This is purely educational on price dynamics, supply-demand, trendlines, and hidden patterns—no investment advice or forecasts. Past patterns do not guarantee future results; conduct your own analysis.
Chumtrades XAUUSD Any pullback is an opportunity to buy higher.This morning’s move was a corrective sell-off, best understood as profit-taking from BUY-side, not a trend reversal.
The overall structure remains within a rising trend channel, with no sign of a structural break → BUY bias stays intact, looking to buy pullbacks in line with the trend.
🟢 Key Support Zones
447x: near-term support (4476 – 4472 – 4470)
4450 – 4455
4430 – 4435
🔴 Key Resistance Zones
4548 – 4550
4560 – 4565
4599 – 4600 (upper resistance)
📌 Additional Note
453x is a mid-zone to watch closely for price reaction.
📊 Intraday Expectation
Price is expected to range sideways on the H2 timeframe
Range high: 4549
Range low: 4473
→ Possible BUY near the lower boundary and SELL near the upper boundary if the range holds.
⚠️ Risk Management
No major news at the moment; price is mainly driven by technical flows.
Holiday period → thin liquidity, higher risk of stop hunts.
Keep stops reasonable and avoid overtrading.
Wishing everyone a productive trading day.

XAUUSD (H1) – Liquidity-Based Trading XAUUSD (H1) – Liquidity-Based Trading
Price has broken the channel, but buying momentum is weakening – waiting for a pullback to the trendline for entries
Today’s Strategy Summary
Gold has broken out of its price channel, but the key point is that buying pressure is fading after the strong acceleration. With the market approaching the holiday period and liquidity thinning, the focus is on trading at the right liquidity zones rather than chasing price or FOMO.
Plan:
Look for Buy opportunities on pullbacks into the trendline / old channel
Look for Sell reactions at the Fibonacci liquidity zone 4474–4478
1) Key Levels Today (from the chart)
✅ BUY zones (liquidity pullback)
Buy Zone 1: 4379 – 4382
SL: 4373
Buy Zone 2: 4361 – 4358
SL: 4353
These are clean liquidity areas to wait for price to retrace into – true liquidity-based trading: let price come back to reaction zones, do not chase highs.
✅ SELL zone (Fibonacci liquidity)
Sell zone: 4474 – 4478
SL: 4482
This is a premium + liquidity area. If price reaches this zone and fails to hold, the probability of profit-taking or a short-term reversal is high.
2) Main Scenario: Wait for a Pullback to the Channel/Trendline to Buy
After a breakout, the market often retests the old trendline or channel to confirm genuine buying strength.
As buying momentum is weakening, the likelihood of choppy moves and liquidity sweeps is high. Patience is key – wait for 4379–4382, or a deeper pullback into 4361–4358.
Expected targets (scalp / short swing):
Capture 8–15 USD moves depending on volatility, taking partial profits as price reacts according to plan.
3) Alternative Scenario: Sell Reaction at 4474–4478
If price continues to push higher into the Fibonacci zone, priority is to Sell on reaction rather than chasing Buy entries.
Only sell if there are signs of loss of momentum (long wicks, rejection, failure to close strongly above the zone).
4) News & Market Context: Thin Liquidity = Easy Sweeps
With the market nearing the holiday period, liquidity is weak, increasing the chances of spikes and stop-hunts.
Political and economic developments related to policy and tax matters are influencing corporate positioning, but at this stage, price is more likely to react to short-term capital flows rather than a sustainable trend.
Conclusion:
Today’s focus is “right zone – strict discipline”, avoiding mid-range entries and emotional trades.
5) Risk Management
Risk per trade: maximum 1–2%
Avoid trading when spreads widen or candles spike abnormally
Which scenario do you lean towards today?
A pullback to 4379 / 4361 for Buy, or a push to 4474–4478 for a Sell reaction?

XAUUSD – Lana prioritises Buy on pullbacksXAUUSD – Lana prioritises Buy on pullbacks 💛
Uptrend confirmed: Lana prioritises Buy on pullbacks 💛
Quick Summary
Trend: Strong bullish, no clear signs of correction
Status: New ATH has been established
Timeframe: H1
Strategy: Focus on Buy setups, waiting for pullbacks into liquidity zones
Market Outlook
Gold is maintaining a very strong bullish momentum and continues to print new highs. When drawing the price channel, price is currently testing the upper boundary, suggesting a potential minor reaction or a short-term pullback before the uptrend resumes.
The next Fibonacci target is around 4414, which may act as a short-term technical reaction zone. However, the primary trend remains bullish.
Technical Perspective
After a strong breakout, the market often revisits liquidity or value areas before continuing higher. Lana does not chase price at elevated levels; instead, she prefers waiting for technical pullbacks to enter trades in line with the dominant trend.
Preferred Buy Trading Plan
Buy Scenario 1 – Near-term liquidity zone
Buy: 4371 – 4374
SL: 4165
This zone contains strong liquidity and is suitable for looking for bullish continuation if price pulls back slightly.
Buy Scenario 2 – Deeper pullback zone
Buy zone: 4342 – 4339
SL: 4330
If the market corrects more deeply under year-end liquidity conditions, this is Lana’s preferred zone to look for a safer entry.
Fundamental View
Spot gold has surpassed the 4,400 USD/oz level for the first time, recording a gain of nearly 68% for the year.
The bullish momentum is not limited to gold but has also spread to silver and platinum, supported by:
Expectations of further Fed rate cuts
Strong inflows into ETF funds
Net buying by central banks
Escalating geopolitical tensions
The year 2025 is closing with a very impressive picture for the precious metals sector.
Lana’s Notes 🌿
Strong uptrend → prioritise Buy on pullbacks, avoid FOMO
Always set clear stop-loss levels and reduce position size during high volatility
If price does not return to the planned zones, Lana is comfortable staying on the sidelines

XAUUSD – Lana Prefers BUY on Pullbacks to Fibonacci XAUUSD – Lana Prefers BUY on Pullbacks to Fibonacci 💛
Quick Summary
Short-term trend: Ongoing bullish continuation
Timeframe: H1
Market context: Thin liquidity ahead of the holiday period; price has not yet broken resistance decisively
Strategy: Prioritise BUY setups, waiting for a pullback to the 50% Fibonacci level
Market Context
Gold continues to hold its bullish momentum and is trading close to the all-time high area around 4350 USD/ounce. Although price has not yet fully broken the upper resistance, the overall bullish structure remains intact.
Gold’s upside is supported by weaker US labour data, expectations that the Fed may cut rates sooner, and rising geopolitical tensions, particularly concerns related to Venezuela ahead of President Trump’s upcoming speech.
With liquidity likely to remain thin due to the holiday period, price action may slow down. However, the primary bias still favours the upside.
H1 Technical Outlook
On the H1 chart, the bullish structure is well preserved. Price is consolidating just below a strong resistance zone, suggesting the market needs more time to absorb selling pressure.
The 50% Fibonacci retracement aligns with a support area that showed a strong reaction yesterday, making it a favourable zone to wait for a pullback and continue trading in line with the trend.
Intraday Trading Scenario
Main Scenario – Trend-following BUY
Entry: 4309 – 4312
SL: 4300
TP: 4330 → 4352 → 4390
Lana prefers to wait for a healthy pullback into this zone before entering, rather than chasing price near resistance.
Trading Notes
Thin liquidity → avoid large position sizes; focus on risk management
If price does not pull back into the planned zone, Lana is comfortable staying flat
Watch price reaction at resistance before expecting a breakout to new highs
Lana’s Note 🌿
Every setup is just one of many possible market scenarios. Lana always defines a clear stop loss and only trades when price reaches the pre-planned zone.

XAUUSD (H1) – Gold Trading Plan | 12/18 Waiting for CPI to ...XAUUSD (H1) – Gold Trading Plan | 12/18
Waiting for CPI to “set the direction” | Buy on a break above 4355, Sell if the trendline breaks
Strategy Summary (10-second read)
Ahead of the US CPI data, gold is likely to stay range-bound and only make a decisive move once there is clear structural confirmation. Price is still holding within an ascending channel, but volume is declining noticeably → priority is confirmed break trades, no FOMO.
Buy only if price breaks and holds above the strong resistance at 4355
Short-term Sell if the rising trendline breaks
Mid-term Sell if the key low at 4306 is broken
Key Levels (Important chart levels)
Major resistance: 4355 (the “gateway” for bullish confirmation)
Sell scalping zone: 4354–4355 (short-term reaction area)
Sell liquidity zone: 4392 (overhead sell-side liquidity)
Structural level / key low: 4306 (a break opens mid-term sell potential)
FVG / deep liquidity draw: 4248 (target if strong distribution occurs)
Scenario 1: Bullish Move
(Activated only if 4355 is broken)
Confirmation: Price breaks and holds above 4355 (preferably with a clear H1 candle close).
Buy entry: 4348
SL: 4340
TP1: 4355–4360
TP2: 4392 (sell-side liquidity zone)
Logic:
With declining volume, fake breakouts are common. Therefore, buys are only valid once price decisively clears the directional resistance at 4355.
Scenario 2: Short-term Bearish Move
(Preferred if the rising trendline breaks)
Confirmation: A clear break of the lower trendline of the ascending channel → sell the breakdown.
After the break, prioritise selling on a retest of the trendline / nearby resistance
Avoid chasing price at the lows
First target typically lies near the below-liquidity area around 4306
Logic:
The trendline acts as the “backbone” of the uptrend. Losing it during CPI conditions + weakening volume increases the probability of a fast sell-off to sweep liquidity.
Scenario 3: Mid-term Bearish Move
(If 4306 is broken)
Confirmation: A clear and decisive break below 4306.
At that point, mid-term sell positions can be prioritised based on structure
Expected targets:
Extension towards deeper support zones, with the 4248 FVG being a notable liquidity draw.
News Context (Why confirmation matters today)
The market is waiting for US CPI, a key inflation release that can shift expectations around the Fed’s rate-cut path. This directly impacts the USD and the next directional move in XAUUSD.
➡️ Today’s focus: wait for range breaks + strict risk control.
Risk Management
Maximum risk per trade: 1–2%
If stopped out: pause and wait for fresh confirmation (no revenge trading)
This analysis is shared for perspective and trading planning purposes only

XAUUSD – H1 TechXAUUSD – H1 Technical Analysisnical AnalysisXAUUSD – H1 Technical Analysis
Lana trades based on liquidity, with priority on price reaction 💛
Quick Summary
Market context: Midweek, gold liquidity is relatively weak as holiday sentiment starts to build
Timeframe: H1
Strategy: Buy at well-defined liquidity zones, sell psychological reactions at resistance
Expectation: No major USD news today, so strong volatility is unlikely
Market Context
The market is entering a “resting phase” as many traders begin to step back ahead of the holiday period, leading to a noticeable drop in liquidity. Today, there are no key US economic releases, so gold is likely to trade within a narrow range, with movements driven mainly by technical factors.
From a macro perspective, recent comments emphasising a clear separation between the White House and the Federal Reserve show that markets remain sensitive to inflation control. However, the short-term impact is limited, which fits a light, quick trading approach rather than holding positions for large moves.
H1 Technical View
On the H1 chart, price is moving around an equilibrium zone after previous fluctuations. Lower liquidity zones continue to provide solid support, while the upper side consists of psychological resistance levels that may trigger short-term reactions.
With weak liquidity conditions, Lana is not looking for strong breakouts. The focus remains on price reaction at clear and well-defined zones.
Intraday Trading Scenarios
Main Scenario – Buy with liquidity
Buy: 4302 – 4306
SL: 4298
This area shows a clear concentration of liquidity. If price revisits this zone and structure holds, a technical rebound is highly possible.
Secondary Scenario – Sell scalping at resistance
Sell: 4351 – 4355
SL: 4360
This sell setup is purely for scalping, taking advantage of psychological reactions near resistance. It is not preferred to hold sell positions for long under current market conditions.
Trading Notes
Weak liquidity → reduce position size, prioritise quick profits
Avoid expecting large moves in the absence of major USD news
Observe price reaction at key zones; avoid entering trades in the middle of the range
Lana’s Note 🌿
Each scenario represents just one of many possible outcomes in the market. Lana always prioritises account protection, uses clear stop losses, and is ready to stay out if price does not return to the planned zones.

XAUUSD (H1) – Gold Analysis for TodayXAUUSD (H1) – Gold Analysis for Today
Price has touched the resistance trendline, but the plan still prioritises BUY (VAL 4303–4306)
Strategy Overview
Gold is currently reacting at the resistance trendline, but there is not enough confirmation yet to call a bearish reversal. For now, the main plan remains to look for buys from the liquidity zone (Volume Profile – VAL). A strong trend shift will only be confirmed if price clearly breaks and closes above the trendline.
1) Technical View
Price is being pressed by the upper resistance trendline, so short-term volatility and wicks are likely.
However, the lower area is supported by Volume Profile (VAL), which favours a reaction-based buy strategy rather than FOMO entries in the middle of the move.
On the upside, there is strong liquidity around 4370, a zone where profit-taking or distribution can easily appear.
2) Trading Plan for Today (Clear Entry – SL)
Scenario A (Preferred): BUY using Volume Profile (VAL)
✅ Buy: 4303 – 4306 (VAL)
SL: 4295
Near TP: 4320 – 4330
Extended TP: Towards the 4370 liquidity zone if the trendline is broken successfully
Logic: VAL represents a “low value area” on the Volume Profile, which often attracts buying interest. As long as price holds this zone, the bias remains buy on pullbacks.
Scenario B: SELL at the upper strong liquidity zone
✅ Sell: Around 4370
SL: 4380
TP: 4330 → 4306 (return to the value area)
Logic: The 4370 level is a strong liquidity zone. If price reaches this area and fails to hold, it provides a textbook reaction-based sell setup.
3) Trend Confirmation Conditions
Strong bullish confirmation: When price breaks and closes an H1 candle clearly above the trendline. At that point, buy setups become safer, with targets towards higher liquidity zones.
If price continues to be rejected multiple times at the trendline, the priority is to wait for price to return to VAL 4303–4306 before buying. Avoid chasing price.
4) Fundamental Context
CIBC: Weaker US employment data may push the Fed to cut interest rates earlier next year, which is typically supportive for gold in the medium term.
Silver prices breaking higher due to tight supply and rising demand suggest that precious metals flows remain strong, meaning gold can experience sharp liquidity-driven moves.
💬 Which scenario are you leaning towards today?
Buying at VAL 4303–4306, or waiting for price to reach 4370 to sell the reaction?

XAUUSD – Overall Market View (12/16) XAUUSD – Overall Market View (12/16)
Strategy Summary
Gold is holding its ground, but the main direction is still unclear because today comes with a series of high-impact news. My approach today is “wait for confirmation before entering”, with two clearly defined scenarios:
Bullish confirmation: Break and hold above 4320
Bearish confirmation: Break and hold below 4271
1) Key Price Levels on the Chart
4320: Bullish confirmation level + resistance / upper FVG zone
4370 – 4373: Strong liquidity zone → preferred area to look for SELL reactions
4271: Bearish confirmation level (support break)
Lower zone (based on structure / trendline): Deeper support area where price may react and bounce, as marked by the arrow on the chart
2) Today’s Trading Scenarios (Trade the Level Style)
Scenario A – Bullish (Only valid if price breaks above 4320)
If an H1 candle closes clearly above 4320, gold is likely to move up and test the upper liquidity zone.
Preferred approach: wait for a pullback and BUY short-term, following the move (as shown by the arrow).
Avoid FOMO buys in the middle of the move.
Reasonable target: 4370 – 4373 (Strong Liquidity).
Note: The 4370 – 4373 zone is highly likely to see selling pressure, as large liquidity is resting there.
Scenario B – Bearish (Confirmed if price breaks below 4271)
If price breaks below 4271 and fails on the retest, the bearish scenario becomes dominant (classic sell retest setup).
✅ Sell: 4271
❌ SL: 4280
🎯 Expectation: Price may extend lower toward deeper structural support zones.
3) Main SELL Setup at the Major Liquidity Zone
✅ Sell Entry: 4370
❌ SL: 4380
Logic: This is a Strong Liquidity zone where profit-taking and distribution are likely to appear.
➡️ Only SELL on confirmation and reaction — no chasing trades.
4) Today’s News (High Volatility Expected)
Today’s US data can cause sharp moves and stop hunts on both sides:
Average Hourly Earnings m/m
Core Retail Sales m/m
Non-Farm Employment Change
Retail Sales m/m
Unemployment Rate
Flash Manufacturing PMI
Flash Services PMI
My rule: Reduce position size before news. After the news, wait for the market to show direction, then trade around 4320 / 4271.
5) Risk Management
Do not enter trades in the middle of a noisy range.
Only trade at key levels with confirmation.
💬 Question for everyone:
Which scenario are you leaning towards today — break above 4320 or break below 4271?

XAUUSD – Lana Prefers SELL, BUY Only for Short-Term ScalpingXAUUSD – Lana Prefers SELL, BUY Only for Short-Term Scalping 💛
Quick Summary
Short-term trend: Downward pressure dominates
Timeframe: H1
Strategy: Focus on SELL; BUY only for quick scalping at liquidity zones
Note: Today features multiple US data releases and events, so volatility may be higher than usual
Market Context
The market enters the session with a dense news flow: US Presidential speech, unemployment rate, seasonally adjusted Non-Farm Payrolls, and Retail Sales.
In such conditions, gold often experiences strong swings and liquidity sweeps before moving in the main direction. Therefore, Lana prioritizes selling at higher zones and only takes short-term BUY positions when price reaches clear support zones.
Technical Outlook
After the previous upward move, the H1 structure shows weakening price action, indicating the possibility of a continued downward move.
Upper zones where short-term resistance converges are suitable for following the intraday SELL trend. Below, liquidity zones may trigger temporary rebounds, but Lana considers these only for scalping and does not hold positions for long.
Intraday Trading Scenarios
Main Scenario – Trend-Following SELL
Sell: 4308 – 4312
SL: 4320
This is Lana’s preferred zone today. If price retraces into this area and shows rejection, the downtrend is likely to continue.
Buy Scenario 1 – Short-Term Scalping at Nearby Support
Buy: 4253
SL: 4240
This BUY is only for short swings, with quick profit-taking when price reacts.
Buy Scenario 2 – Scalping at Deep Liquidity Zone
Buy: 4213
SL: 4200
This is a stronger liquidity zone. If price drops quickly here during news, a technical rebound is possible, but Lana maintains the view not to hold BUY positions for long.
Session Notes
Asian & European sessions: Price may fluctuate and create technical retracements
US session: Strong news-driven volatility can sweep both sides before a clear direction emerges
Each scenario represents a probability, not certainty.
On high-news days, Lana always reduces position size, sets clear SLs, and is willing to skip trades if price does not reach the expected zones.

XAUUSD – Lana waits for reaction at resistance, focuses on ...XAUUSD – Lana waits for reaction at resistance, focuses on zone-based trading
Quick Summary
Context: Early in the week with many high-impact news events. Gold opened strong and is now approaching a major resistance area.
Timeframe: H1
Strategy: No chasing price. Prefer waiting to buy at liquidity void (VL) zones and selling short-term pullbacks at higher resistance.
Expectation: Asian–European sessions may move sideways; stronger volatility is more likely during the US session.
Market Context
The year-end period is usually packed with economic data. This week, Nonfarm Payrolls, CPI, and Retail Sales are released close together, along with interest rate decisions from the UK, Europe, and Japan.
For gold, this environment often leads to sharp moves during the US session, while earlier sessions tend to consolidate or make shallow pullbacks as the market waits for news.
Technical View
After a strong rally at the start of the week, price is now trading around a key resistance zone. On H1, the price action at the Asian open has left a liquidity void (VL), which is Lana’s preferred area to wait for buy opportunities in line with the main trend.
On the upside, a descending trendline combined with Fibonacci extension levels is forming a strong resistance zone, suitable for a short-term corrective sell.
Trading Scenarios for Early Week
Main Scenario – Buy at the liquidity void (VL)
Buy: 4298 – 4302
SL: 4294
This is Lana’s preferred zone. If price returns to fill the liquidity void and the structure holds, there is a high probability of a bullish reaction in continuation of the broader trend.
Alternative Scenario – Short-term sell at higher resistance
Sell: 4367 – 4370
SL: 4376
This is considered a short-term corrective move when price reaches strong resistance. The sell is counter-trend, so strict risk management is required and positions should not be held for too long.

Seeing vs Believing: Multi-Pattern Structure vs Single-Line BOOn the left, the weekly chart is mapped as a full A+ type setup, where multiple structural elements work together instead of relying on a single, convenient line.
-A red counter trendline marks a series of lower-high rejection points, visually defining the “least liquidity” supply line that price has repeatedly respected.
-A dotted parallel channel outlines a broader multi-pattern context.
-A dashed hidden line adds another layer of structure, hinting at less obvious inflection zones that are not visible at first glance but often align with prior reactions.
-Finally, an orange line represents a higher time frame resistance level, bringing in a top-down perspective so that the current weekly price action is seen in relation to a dominant, bigger-picture barrier.
On the right, by contrast, the chart is reduced to a single white line drawn in a way that “forces” the candles to appear as if they are breaking out.
This is a great example of chart psychology in action: instead of objectively mapping all relevant patterns, many traders draw what they want to see—one clean breakout line—ignoring hidden structures, multi-timeframe confluence, and complex pattern overlap.
The intention of this post is purely observational and educational, not forecasting.
It aims to show how a professional, multi-pattern approach (CT lines, channels, hidden lines, and higher timeframe levels) can radically change the way a chart is interpreted compared to the simplistic, single-line breakout mindset that dominates retail thinking.
Disclaimer: This post is for educational and illustrative purposes only and does not constitute investment, trading, or financial advice. Always do your own research and consult a registered financial professional before making any trading decisions.

XAUUSD Wave 5 Completed, Entering an ABC Correction CycleXAUUSD – Wave 5 Completed, Entering an ABC Correction Cycle
Weekly Plan Summary
Gold has completed Wave 5 with a very strong impulsive move and is now entering an ABC corrective phase to complete the Elliott Wave structure.
For the coming week, the primary strategy is to look for SELL opportunities at the Fibonacci resistance zone 4316–4320, followed by BUY reactions at the major liquidity area around 4215.
1) Elliott Wave – Why the Market Is Likely Entering an ABC Phase
The recent rally shows clear end-of-Wave-5 characteristics: strong momentum, long candle bodies, followed by a sharp downside reaction (profit-taking and liquidity withdrawal).
Once Wave 5 is completed, the market typically transitions into an ABC correction to rebalance supply and demand and complete a full Elliott Wave cycle.
ABC Structure Based on the Provided Chart
A-leg: Price drops into the 4259–4262 zone (the first reaction area of the correction).
B-leg: Price retraces back towards 4316–4320 (the Fibonacci SELL zone on the chart).
C-leg: Price continues lower towards 4215 (POC + major liquidity cluster formed late last week) — this is the primary target of the correction.
2) Key Price Levels
Sell Zone (B-leg): 4316 – 4320 (Fibonacci resistance)
Near Support (A-leg reaction): 4259 – 4262
Mid Support: 4238 – 4241
Main Target / Liquidity Area: 4215 (POC + major liquidity cluster)
Scenario Invalidation Level: 4191
If price breaks below this level, the structure will need to be reassessed.
3) Trading Scenarios for the Coming Week
Scenario 1 (Preferred): SELL at the End of the B-leg
Sell: 4316 – 4320
SL: 4326 (a clear break above the sell zone)
TP1: 4262
TP2: 4240
TP3: 4215
Logic:
The B-leg is usually just a corrective pullback within the broader ABC structure. Selling at the Fibonacci resistance provides a better risk-to-reward ratio than chasing shorts in the middle of the range.
Scenario 2: BUY Reaction at the End of the C-leg
Buy: Around 4215 (preferably with a clear reaction)
SL: 4191
TP1: 4240
TP2: 4262
TP3: 4290 – 4310 (if structure reverses and the uptrend resumes)
Logic:
4215 is both the POC and a major liquidity zone, often acting as a “magnet” to complete the C-leg before the market forms a new cycle.
Alternative Scenario: If Price Breaks and Holds Above 4320
If price breaks above 4320 and closes clearly on H1 above this level, the ABC correction may be delayed, and gold could extend higher towards the next resistance zone.
In this case:
Do not stubbornly hold SELL positions.
Shift mindset to waiting for pullbacks to BUY in line with the trend.
4) Fundamental Context – Volatility May Increase, Supporting a Correction Phase
Philadelphia Fed Governor Anna Paulson stated that interest rate cuts have “removed some of the insurance” against risks in the labour market.
She also emphasised that the labour market is under pressure but has not yet broken. This keeps the Fed in a cautious stance, a backdrop in which gold often experiences sharp liquidity sweeps before aligning with its technical structure.

XAUUSD Trend holds wait to re buy on pullbackXAUUSD (H1) — Trend intact, waiting for pullback to re-buy at the right zones
Strategy Summary
Price continues to move in line with the bullish plan. Two buy entries were already captured, with price advancing around ~5 points. At this stage, the priority is not to chase price, but to wait for pullbacks into reaction zones to re-enter in the direction of the trend.
1) Trading Plan (H1)
✅ Buy Zone 1: 4262 – 4258
SL: 4250
Meaning: A shallow pullback zone. If price holds the bullish structure and reacts higher here, trend-following buys are preferred.
✅ Buy Zone 2: 4240 – 4235
SL: 4238
Meaning: A deeper pullback (better discount). If price sweeps this area and shows strong confirmation, this becomes a higher-quality buy zone.
Projected Targets (based on chart):
Near resistance: 4285
Extended target: 4304 – 4307
2) Fundamental / News to Watch
The Fed releases US household financial conditions data (Capital Flow Report Q3/2025).
Voting FOMC members & Philadelphia Fed President Paulson speak on the 2026 economic outlook.
The US threatens expanded seizures of Venezuelan oil tankers → geopolitical and energy supply risks may increase volatility, with gold prone to sharp spikes.
3) Technical & Behavioural View
Market structure remains bullish. After a strong impulse, a pullback is healthy before continuation.
Plan remains clear: buy only at predefined zones, no FOMO.
If price breaks below zones and closes H1 candles under SL levels, staying flat and waiting for a new structure is preferred.

XAUUSD H4 Lana Weekly AnalysisXAUUSD (H4) – Lana’s Weekly Outlook: Waiting for pullbacks to Fib 0.618 & 0.50 within major liquidity zones 💛
Higher-Timeframe Trend (D1)
Gold is revisiting the previous all-time high (ATH), but volume strength has not yet been convincing enough to confirm a strong breakout.
Primary Tracking Timeframe
Timeframe: H4
Method: Fibonacci + trendline + liquidity zones + support/resistance
Plan: Lana avoids chasing price and prefers to BUY at discounted areas around Fib 0.618 and 0.50.
Market Context for the Coming Week
US Treasury yields, especially on the long end, remain elevated, increasing short-term volatility in gold.
Fed commentary continues to signal a cautious stance, while political uncertainty in the US may make gold flows more unpredictable.
As a result, Lana prioritises trading clearly defined price zones rather than trying to predict every short-term swing.
H4 Technical View (Medium Term)
Gold’s current trading range is relatively wide. After a strong impulsive move, the market often needs a “cooling-off” phase to rebalance liquidity.
On H4, the two most important zones align between Fibonacci retracement levels and major liquidity areas, making them ideal zones to wait for pullbacks before continuing with the trend.
Key Price Zones Lana Is Watching
1) Buy Zone 1 – Fib 0.618 (Preferred)
Entry: 4216 – 4220
SL: 4210
This is a high-quality Fibonacci discount zone and an area where strong price reactions are likely if larger flows step in to support the trend.
2) Buy Zone 2 – Fib 0.50 + Strong Support (Deeper Buy)
Entry: 4171 – 4175
SL: 4165
This scenario plays out if price sweeps deeper liquidity before rebounding. Lana considers this a safer entry in terms of location, but it requires patience.
Trading Scenarios for the New Week
Primary Scenario – Trend-Following BUY on Pullbacks
Lana prefers to wait for price to retrace into 4216–4220, or deeper into 4171–4175, before entering trades.
If price reacts positively, upside targets will focus on rebounds towards higher resistance zones and the nearest recent highs.
Secondary Scenario – If Price Remains Elevated
If price stays in premium territory with strong volatility, Lana does not recommend late entries.
Instead, the focus is on observing price reactions and waiting for pullbacks into the predefined zones for cleaner, lower-risk execution.
Lana’s Notes 🌿
Every setup represents a probability, not a certainty.
Stop loss is always predefined, and position sizing should be moderate to withstand gold’s wide volatility.

XAUUSD – 11/12: After major news, only trade at liquidity zones XAUUSD – 11/12: After major news, only trade at liquidity zones
Yesterday’s strong news release means today the market has no clear direction.
In this situation, I don’t try to predict direction — I only focus on two key liquidity zones:
Sell timing zone around 4.219
Buy OB zone around 4.197–4.194
The Asian session showed selling pressure, but the larger trend hasn't changed.
So the plan is: short-term sells – buy at strong support, not all-in one direction.
🎯 Scenario 1 – Timing SELL at 4.219 (for experienced traders only)
Sell zone: around 4.219
Important: This is a timing entry, NOT a pending limit order.
Allowed deviation: ~2 pips.
If ideal timing is 4.219 but you see price already hit 4.221 → skip, don’t chase.
TP reference: at least 15 pips, e.g. 4.204–4.203 or lower depending on entry.
Idea:
4.219 is an upper liquidity zone where FOMO buy orders tend to cluster.
If price sweeps above and weakens, I take a short-term sell following Asian session selling momentum.
Targets are intraday only — no long holding.
⭐️ Scenario 2 – BUY at OB 4.197–4.194
Buy zone: 4.197 – 4.194
Setup invalid if: price breaks below 4.191 and holds there
TP: At least 15+ pips, e.g. 4.209–4.212 depending on entry.
Why this zone?
4.197–4.194 is a clean bullish order block where strong buying previously pushed price up.
If price retraces here and shows good reaction (wick rejection, rising buy volume), I treat it as a chance to rebuild long positions with good R:R.
1️⃣ Market fundamentals & sentiment
After a strong rally, gold bulls are becoming more cautious.
Main reason: uncertainty over the speed of Fed rate cuts next year.
Everyone expects cuts — but no one knows how fast, how many, or when exactly.
As a result, gold is no longer trending straight upward; it is now trading in a wider, jumpy range around the highs.
So instead of trying to catch a long trend today, I focus on liquidity zones and price reactions.
2️⃣ Plan & discipline
Do NOT enter trades around 4.20x.
Only act at:
Timing Sell 4.219 (±2 pips — if missed, skip)
Buy OB 4.197–4.194 (invalid below 4.191)
Risk per trade: 1–2% max, no holding when invalidated.
If price breaks both zones and trends strongly (due to new data), I stay out and wait for clearer structure.
👉 Above 4.219 → only look for SELL timing
👉 Between 4.197–4.194 → look for BUY
👉 Below 4.191 → cancel buy setup and wait
