XAUUSD – The 4,221 Zone Will Decide the Next Direction Ahead...✨ XAUUSD – The 4,221 Zone Will Decide the Next Direction Ahead of the Fed Meeting
From my perspective, gold on 10/12 is in a “waiting for direction” phase.
Price is trapped between the 4,221–4,239 resistance band and the strong 4,166 support area.
On the 45-minute timeframe, the structure is forming a sideways top after the recent upward move.
With the Fed set to announce its interest rate decision soon, I avoid predicting blindly and prefer to let these key zones guide my trading decisions.
🎯 Key Technical Levels
Major Resistance
4,221 – 4,225: Fibo 0.236–0.382 cluster + heavy volume zone
4,239: Extended resistance high — if broken, price may target the 4.25x region
Strong Support
4,166: The “Strong Support” zone on the chart, currently defining the bottom of the range
Below 4.166, the 4.12x region aligns with the Fibo 1.618 extension — a zone where liquidity could be swept if the market sells off sharply
📌 Scenario 1 – Bullish Continuation (Preferred if price holds above 4,200)
Conditions:
Price stays firmly above 4,200
Clear breakout of 4,221–4,225
A 45m candle closes above this zone
If these occur, it signals buyers are regaining control.
Suggested approach:
Buy on a break & retest of 4,221–4,225
SL: below 4,210
TP: 4,245 → 4,258 → 4,270
As long as gold remains above 4,200, I keep a bullish bias and consider dips into the 4.20x region as opportunities to buy.
📌 Scenario 2 – Short-Term Sell From Upper Range Resistance
If price fails to break 4,221–4,239 and forms:
Wick rejections
Small-body candles
→ I treat this as exhaustion at resistance.
Trade idea:
Sell: 4,221–4,225 (up to 4,239 if there is a spike)
SL: above 4,239
TP: 4,190 → 4,176 → 4,166
If selling pressure is strong: extended target 4,130
This setup is suited for scalping or short swings, and goes against the medium-term bullish bias — so position sizing must be controlled carefully.
1️⃣ Fundamental Context: Everything Depends on the Fed
USD/CHF is trading steadily around 0.8060, reflecting the market’s wait-and-see stance ahead of the Fed decision.
Traders don’t want to commit heavily before such major news, so gold tends to move within a range.
Once the Fed releases its rate decision and guidance, gold’s volatility can expand dramatically — possibly sweeping both resistance and support.
Because of that, I do not recommend placing large-position trades right before the announcement.
Instead, focus on observing price reactions at 4,221 and 4,166 to determine whether the next leg will be upward or downward.
2️⃣ My Trading Plan
Above 4,221 with stable price action: Prefer buying the breakout, targeting the 4.25x zone.
Failure to break 4,221, weak candles: Consider shorting toward 4.19x – 4.166.
If price drops directly below 4.166: I stay out temporarily and wait for the market to form a new balanced region before planning the next trade.
Risk per trade: 1–2% maximum, no widening stop-loss during high-impact news.
If you find this analysis useful, follow the TradingView channel and comment whether you expect a breakout above 4,221 or a reversal from resistance — we’ll update again after the Fed announcement.
Tecnicalanalysis

Holding Breath for FOMC News - Will History Repeat?XAUUSD Trading Idea Today 10/12/25 (FOMC - Big News)
Will history repeat:
Before the news: Sideway | News release: prioritize SELL
Today's range: 417X–423X
Expectation: FOMC release leads to selling (Powell is usually hawkish → price drops like in September & October)
1) Intraday Trading (catching the Sideway range)
Upper range:
4218–4220
4230–4233
Lower range:
4170–4173
4180–4182
→ Morning & afternoon prioritize catching the range – trade within the range for safety before the news.
2) During the news (for those who trade the news)
Not suitable for those who are risk-averse, so you can skip if you can't handle it. Limit if you want to learn and profit using a very small account.
1) 4218–4220 (Risk-only) (if it doesn't break all day)
• High reaction area
• Safe → skip
• Risk → Probe sell, small SL
2) 4230–4233 (Main Sell)
• Strong resistance within the range
3) 4240–4244–424X (Best Sell)
• Liquidity zone
• If spike during/before news → High RR sell
3) Target down
TP1: 418X
TP2: 416X-5x
TP3: 409X (main target – swing + FVG + fibo)
4) BUY?
Attention area:
4150-52
4128-32
4102-96
5) Note on the news
This scenario holds if Powell maintains a hawkish tone.
If Powell is more "dovish" → it may go against expectations.
Risk-averse traders → do not trade the news.
News traders → use a small account to test market reactions.
Quick Summary
Before the news → Sideway, catch the range 417X–423X
News release → prioritize SELL
SELL zone: 4218, 4230–4233, 4240–4244
Main target: 409X
The price will move with each statement from the Fed Chairman and keep an eye on Trump too.
Wishing everyone a victorious day.

XAUUSD – LANA WATCHES SUPPORT 4190–4199 AHEAD OF THE FED RATE..✨ XAUUSD – LANA WATCHES SUPPORT 4190–4199 AHEAD OF THE FED RATE CUT DECISION
Fundamental Outlook
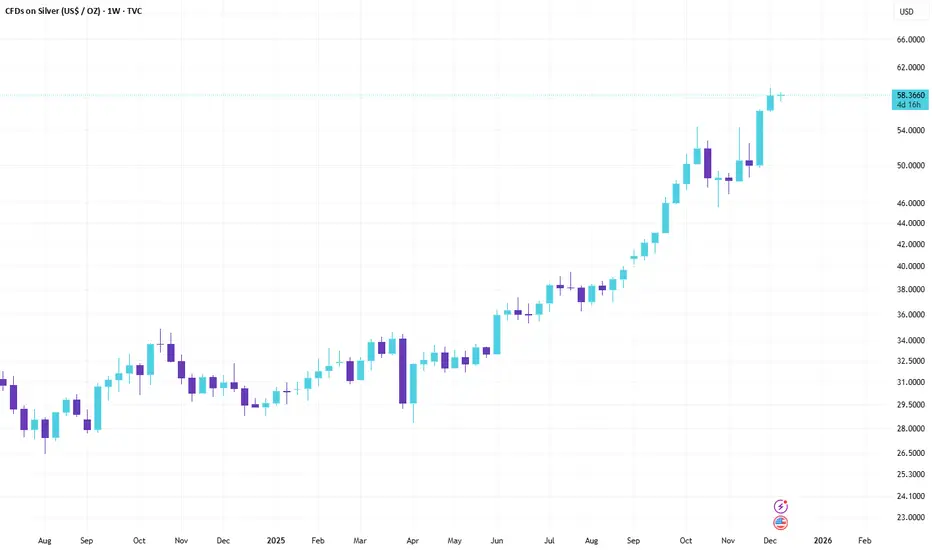
Over the past year, Silver has surged nearly 82%, while Gold has gained about 58%, showing that capital continues to favour the precious metals sector.
The market is currently pricing in ~97% probability of a 25 bps rate cut by the Fed tomorrow. This expectation supports gold in the medium term, as lower yields reduce the opportunity cost of holding non-yielding assets like gold.
However, before the actual announcement, price usually swings sharply around short-term support and resistance zones. That’s why Lana prefers to trade based on M30 technical levels during this period.
Technical Analysis (M30 – Support/Resistance Levels)
For gold to drop deeper, the recent low around 4199 must be broken convincingly.
At the moment, price is reacting near the 4190 support zone, a critical level. As long as this area holds, gold still has the potential to bounce within the current range.
Above price, the next resistance zone is 4235–4238, aligning with previous FVG and supply areas — suitable for a Sell setup if price retraces upward.
Below, the 4164–4167 area is the next strong support, also marked by Lana as a Buy scalping zone if the market flushes down rapidly.
Summary:
As long as support remains intact, Lana continues to favour Buy setups around these zones.
Sell scenarios only become valid when price retraces to the higher resistance areas.
Key Price Levels to Watch
Important Supports:
4199 – 4190 (near-term low & short-term support)
4164 – 4167 (next Buy zone)
Resistance / Sell Zone:
4235 – 4238
Trading Scenarios
⭐️ Scenario 1 – Sell at Resistance
Sell: 4235 – 4238
SL: 4243
TP: 4222 – 4205 – 4190
⭐️ Scenario 2 – Buy at Support
Buy: 4164 – 4167
SL: 4159 TP: 4182 – 4202 – 4225
👉 Follow Lana on TradingView to receive the earliest gold updates.

This Stupid Simple Strategy will help you become a better traderI make educational content videos for swing trading
Charts used are 3 months or older .

XAUUSD – H1 in a corrective move: planning to Sell the pullback XAUUSD – H1 in a corrective move: planning to Sell the pullback & Buy at Fibo + VAL support
Gold is currently moving within a downward structure on the H1 timeframe. The present rise is only a corrective leg inside last week’s bearish trend.
The key price area to watch is 4164 – if price cannot break and hold above this level, the H1 downtrend remains intact.
Below that, the market appears to be targeting the Fibonacci 50% zone + VAL around 4125–4132, where a cluster of buy-side liquidity sits.
🔻 Scenario 1 – SELL the pullback within the bearish structure
Sell: 4208 – 4212
Stop Loss: 4216
Take Profit: 4190 – 4176 – 4150 – 4130
Reasoning:
The 4208–4212 zone is a clean pullback-sell region because:
It aligns with the nearest H1 resistance.
It sits just above the “strong support” that was recently broken and now acts as fresh resistance.
If price retraces here, I prefer selling with the H1 downtrend, targeting 4190 → 4176 → deeper targets 4150–4130 near the Fibo base.
⭐ Scenario 2 – BUY at the Fibo + VAL Buy Zone (4125–4132)
Buy: 4125 – 4132
Stop Loss: below 4132 (depending on risk preference)
Take Profit: 4155 – 4190 – 4225
Reasoning:
This is a high-confluence buy zone:
It matches the Fibonacci 50% retracement of the previous rally.
It aligns with the VAL (Value Area Low) where previous heavy volume was traded.
If price sweeps this zone during a sell-off and gives a strong bullish reaction, I treat it as a place to accumulate buy positions for the rebound toward 4155–4190 and potentially 4225.
1️⃣ Macro Background – Fed Rate-Cut Expectations
Market probabilities for a 25 bps Fed rate cut continue to rise:
FedWatch: ~89.4%
Polymarket: ~95%
This shows the market is heavily pricing in monetary easing — supportive for gold in the medium term.
However, short-term retracements may still occur due to profit-taking and position reshuffling.
Bottom line:
Macro favours gold overall, but H1 is still correcting.
Instead of catching falling knives, I prefer selling pullbacks at resistance and buying only at clearly defined Fibo + VAL support.
2️⃣ Action Plan & Risk Management
Sell only at: 4208–4212 → SL 4216 → TP 4190 / 4176 / 4150 / 4130
Buy only at: 4125–4132 → SL below 4132 → TP 4155 / 4190 / 4225
Avoid trading inside the middle zone 4160–4190, where price tends to chop during corrective waves.
Risk per setup: 1–2% max, and never widen SL, even around Fed news.

XAUUSD – LANA PRIORITIZES SELLING WITH THE ELLIOTT WAVE C LEG...XAUUSD – LANA PRIORITIZES SELLING WITH THE ELLIOTT WAVE C LEG AT THE START OF THE WEEK
Fundamental Analysis
During periods of Quantitative Easing (QE), the Federal Reserve injects liquidity into the financial system by purchasing bonds. This expands the “liquidity reservoir” and generally supports asset prices, including gold.
Conversely, under Quantitative Tightening (QT), the Fed gradually reduces its balance sheet, pulling cash out of the system and tightening financial conditions.
Currently, with QT having ended, the Fed is essentially signaling that:
The current liquidity level is the minimum they consider safe.
They want to avoid a repeat of the liquidity shock seen in 2019.
This reduces medium-term tightening pressure on gold. However, in the short term, gold is still undergoing a technical correction, which is why Lana prefers to trade based on Elliott Wave structure rather than reacting to news.
Technical Analysis – Elliott Wave on M30
On the M30 timeframe, gold is in a corrective C wave, which may be the final leg of the current structure.
The prior 5-wave bullish move showed signs of a truncated fifth wave, failing to create a strong new high – an indication that buying momentum has weakened.
Early this week, price swept Buy-side liquidity but could not hold upward momentum, reflecting weak bullish sentiment.
Below current price, the 4128–4135 zone is a key area — both a support region and the potential completion zone of wave C if the decline extends.
With this structure in mind, Lana’s plan for the week is to prioritize Sell setups, following the C-wave, instead of attempting early bottom-picking.
Key Price Zones
Sell-on-pullback zone:
4215 – 4218 (Primary entry zone)
Downside liquidity & target zones:
4192 – 4175 – 4164: Intermediate liquidity points on the way down
4135 – 4130: Expected completion area for wave C (aligning with the 4128–4135 support zone)
Trading Scenarios
⭐ Primary Scenario – Sell following the Elliott Wave C leg
Sell Entry: 4215 – 4218
Maximum SL: 4220
TP: Minimum +20 pips from entry
Extended target: 4135 – 4130 if the market completes the full corrective structure
This week, Lana will not prioritize early Buy entries, and will only consider buying again if price approaches the 4128–4135 zone with clearer reversal signals.
👉 Follow Lana on TradingView to receive the earliest updates on the larger gold wave structure.

/]*/USD – Volume Profile: Selling at VAH, Buying at POC Within..XAUUSD – Volume Profile: Selling at VAH, Buying at POC Within a Wide Range
Gold is currently trading inside a broad H1 range, showing hesitation after last week’s decline. The present movement is essentially a pullback phase within the H1 downtrend, so I prefer to trade based on Volume Profile liquidity zones instead of trying to predict a new trend.
Price is now approaching the VAH (Value Area High), while below we have the POC cluster + ascending channel support — the two key zones guiding today’s trading decisions.
🎯 Scenario 1 – SELL at VAH / Supply Zone
Sell: 4.221 – 4.223
SL: 4.228
TP: 4.212 – 4.200 – 4.178 – 4.150
Logic:
The H1 VAH sits around the 4.22x region, aligning with resistance near the upper boundary of the minor ascending channel.
This area previously triggered strong selling pressure, pushing price back inside the value region. If price retests this zone and forms weak candles (long upper wicks, small bodies), I prioritise short-term Sell trades in line with the current corrective swing.
TP levels:
4.212: bottom of the balance zone
4.200: lower boundary of the range
4.178 – 4.150: deeper liquidity lows
Although this setup aligns with the H1 correction, it still counters the larger uptrend, so I keep a moderate position size and a strict SL at 4.228.
⭐ Scenario 2 – BUY at POC / Channel Support
Buy: 4.193 – 4.195
SL: 4.187
TP: 4.210 – 4.235 – 4.260
Logic:
The 4.193–4.195 zone is the POC (Point of Control) — the highest-volume area — aligning with the ascending channel support and short-term demand.
If price drops from VAH and reaches the POC while showing clear signs of buying pressure, this becomes my preferred intraday reversal area.
Targets are the mid-channel zone at 4.210, then the previous upper boundary at 4.235–4.260.
This setup leverages the tendency of large players to defend the POC, especially when no major negative news is strong enough to break the structure.
1️⃣ Quick Macro Outlook
Global capital flow is rotating into other risk-on assets such as Chinese equities, benefiting from AI themes, economic recovery expectations, and attractive valuations. MSCI China has outperformed the S&P 500 this year.
In commodities, Goldman Sachs still forecasts NYMEX natural gas at USD 4.50/MMBtu by summer 2026, showing that major investors remain optimistic about the broader commodity group.
In summary, a risk-on environment does not eliminate gold’s role, but it increases volatility as capital rotates — making Volume Profile and liquidity zones even more effective than directional bias.
2️⃣ Technical View & Execution Plan
On H1, price moves inside a mild ascending channel, but the overall structure remains a corrective phase of the prior decline.
VAH 4.22x: Favourable for Sell setups as short-term sellers dominate here.
POC 4.19x + support: Expected buy zone where bulls may defend the channel.
Execution rules:
Only trade at predefined zones — no FOMO in the middle of the range.
Risk per scenario capped at 1–2% of account; SL must not be widened.
Invalidation:
If price breaks above 4.228 → exit Sell idea, wait for new structure.
If price drops below 4.187 → exit Buy idea, avoid catching a falling knife.
If price breaks strongly through both VAH and POC and stabilises outside, I will abandon both setups and update my view accordingly.
If you find this analysis helpful, follow the TradingView account and comment whether you prefer Sell at VAH or Buy at POC today — I always read the feedback before preparing the next post.

Real-Time XAG/USD Chart Analysis: Bullish Momentum Builds TowardFOREXCOM:XAGUSD
Real-Time XAG/USD Chart Analysis: Bullish Momentum Builds Toward $60
As of December 8, 2025 (Intraday: Early Trading)
Current Price: 58.31 USD (Down ~0.08% from previous close of 58.36; trading range: 57.59–58.74)
Asset: XAG/USD (Silver Spot vs. US Dollar)
Key Context: Silver's consolidating just shy of its all-time high of 59.42 hit earlier this week, with fresh ETF inflows and tightening physical inventories underscoring the uptrend. Amid Fed rate-cut bets and robust industrial demand (solar, AI), the technical setup leans Strong Buy—a pullback could be a gift for longs eyeing new records.
Quick Macro Snapshot
Tailwinds: Weaker USD from softer PCE inflation and labor data, plus record SLV ETF inflows (highest in 10 years). Supply crunch on Shanghai exchanges at multi-year lows, with green tech demand projected to drive deficits. Silver's 2025 YTD gains now at ~83%, outpacing gold's rally.
Headwinds: Overstretched speculative positioning could spark profit-taking; hawkish Fed signals next week might cap upside if yields rebound.
Technical Breakdown
Pulling from daily and 4H charts, the bias is firmly bullish despite minor intraday dips:
Trend & Moving Averages (Strong Buy):
Daily: Price well above rising 200-day EMA (~55.00) and 50-day EMA (~50.00), with all major MAs aligned bullish. 200-hour EMA at 56.30 provides dynamic support.
4H: Golden cross intact on EMAs; buyers defending the ascending channel.
Implication: Uptrend channel from October lows holding; retest of $59+ imminent on volume pickup.
Momentum Indicators (Neutral with Bullish Tilt):
RSI (14): 50.82 (Neutral)—cooled from overbought but no divergence yet, leaving room for extension.
MACD (12,26): Recently slipped negative below zero line (bearish histogram), signaling short-term downside momentum, but line still above signal overall.
Stochastics (9,6): ~65 (Buy territory); not overbought.
CCI (14): Neutral (~0); Williams %R: -45 (Mild buy).
ADX (14): 28 (Moderate trend strength, bullish direction).
Implication: Momentum pausing after the ATH push, but neutral RSI avoids sell signals—watch for bullish crossover.
Volume & Volatility:
ATR (14): ~0.85 (Elevated vs. recent avg., indicating volatility spike post-breakout).
Bull/Bear Power: Bulls dominant (+0.45), with options flow heavy on calls.
Pivot Points & Key Levels (Classic):LevelPriceTypeR359.50ResistanceR259.20ResistanceR159.00ResistancePivot58.15NeutralS157.50SupportS256.50SupportS356.20Support
Support Cluster: 56.20–56.50 (200h EMA + key zone; break below eyes 55.25 weekly support).
Resistance: 59.00–59.35 (recent ATH; clear for $60+ push).
Fibonacci: 61.8% extension from Oct lows targets 60.50.
Weekly Outlook
Broader uptrend: Strong Buy on MAs; Triangle pattern resolving higher, with potential test of 55.25 support before rally to 60.65–68.05. YTD doubling makes $65 realistic if Fed cuts materialize.
Risk: Drop below 56.20 could accelerate to 54–55 (prior resistance-turned-support), but low probability amid deficit forecasts.
Bias: Buy the dip—industrial tailwinds and ETF momentum point to $60 by quarter-end.
Trade Takeaway: Long above 58.15 pivot (stop below 56.50). Target R1 at 59.00 for 1:2 risk/reward. Squad, silver's stealing gold's thunder—$60 next, or Fed-induced pause? What's your play? #XAG #SilverAnalysis #SignalSquad
XAUUSD – Ahead of NFP: Buy with Wolfe Wave, Watch for Sell ...XAUUSD – Ahead of NFP: Buy with Wolfe Wave, Watch for Sell Setup at the Extension Zone
Gold continues its upward momentum as the USD weakens sharply, breaking the descending trendline and forming a Wolfe Wave pattern on the H1 chart.
Price is currently rotating around the POC – VAH cluster of the previous distribution zone, making it very likely to react before the NFP release.
At this stage, I prioritise buying with the main trend, but I also prepare a short-term sell setup if the market becomes “overstretched” before the news.
🎯 Scenario 1 – Priority BUY at POC/VAH
Buy: 4,209 – 4,212
SL: 4,205
TP: 4,233 – 4,260 – 4,299
Reason:
Price is retesting the POC – VAH cluster right after breaking above the descending trendline.
The Wolfe Wave structure points toward higher targets, aligning with the continuation of the bullish trend.
The 4,209–4,212 zone offers good liquidity, allowing a tight stop loss while maintaining an attractive R:R.
🔁 Scenario 2 – SELL Reaction at the Upper Extension Zone
Sell (only if a clear reversal signal appears): 4,323 – 4,325
SL: 4,333
TP reference: 4,299 – 4,260 – 4,233
Reason:
The 4,323–4,325 zone is an upper extension area, overlapping with the Wolfe Wave resistance and a previous supply zone.
If price is “pushed” into this region before NFP, and H1 candles show long upper wicks or weakening volume, I will consider it a counter-trend sell opportunity back toward the POC/support areas.
This is a counter-trend trade, so position size should be smaller and execution must be clean and quick.
1️⃣ Fundamental View Before NFP
The USD is attempting to recover from its late-October lows but is restricted by expectations of the Fed turning dovish soon.
Recent data shows a cooling U.S. economy and a slowing labour market—raising the probability of a 25bps rate cut at the upcoming FOMC meeting.
Additional developments:
The Government Accountability Office has launched an investigation involving a “Fed critic.”
Kevin Hassett stated that he believes the Fed may cut rates soon.
These factors strengthen the narrative that the interest rate peak is behind us.
Although Challenger job cuts dropped sharply compared to the previous month, the overall economic picture still suggests slowing growth, which supports gold in the medium term.
Summary:
Fundamentals remain supportive for gold.
NFP will only determine how deep or how fast the next correction will be—not a trend reversal unless the numbers are extremely out of expectations.
2️⃣ Technical Outlook from the Chart
On H1, gold has broken the descending trendline and moved back above the POC area of the previous downmove.
A Wolfe Wave pattern has formed, projecting targets higher than current price.
Price is currently hovering around POC – VAH:
If it holds above 4,209–4,212, the next targets are likely 4.26x–4.29x.
If price gets strongly rejected near 4.32x before or after NFP, this becomes a valid zone to look for sell reactions.
3️⃣ Trading Plan & Risk Management
Priority: BUY at 4,209–4,212, SL 4,205, TP 4,233–4,260–4,299
Sell setup at 4,323–4,325 is activated only when reversal signals appear
If NFP causes excessive volatility, prioritise waiting for price to stabilise around the POC before re-entering new setups.

XAUUSD – LANA LOOKS FOR BUY SCALPING AT 4180–4185 BEFORE PCE ...XAUUSD – LANA LOOKS FOR BUY SCALPING AT 4180–4185 BEFORE PCE DATA
1. Fundamental Analysis
Toward the end of this week, the market is almost “holding its breath” ahead of the PCE report – the Fed’s preferred inflation gauge, considered the final key puzzle piece before the year-end meeting.
Recent surveys show weakening consumer confidence and rising recession risks.
However, Black Friday and holiday shopping numbers indicate demand is still fairly strong.
For that reason, PCE will play the decisive role:
If inflation continues to cool, the market will strengthen its ~87% expectation of a 25bps rate cut by the Fed, supporting equities and, in the medium term, providing a positive foundation for gold.
Before the data release, gold typically trades sideways with compressed volatility as money stays on the sidelines waiting for clearer signals.
Today, Lana treats the session purely as a scalping day, without opening any long-term positions.
2. Technical Analysis
H1 timeframe: Gold is moving inside an ascending price channel, with each low higher than the previous one.
The lower trendline of the channel passes through the 4180–4185 zone.
Above, resistance sits at 4219, and further up at the POC cluster 4241–4244.
But with the current sideways behaviour, price has not shown any intention of a strong breakout.
During Thursday and Friday morning, the range became noisy, with candles clustering around the mid-channel area – a sign of accumulation while waiting for a breakout.
For this reason, Lana avoids buying or selling in the middle of the range.
She focuses only on clear liquidity zones near the rising trendline for scalping.
3. Key Price Levels
Buy scalping zone: 4185 – 4180 (trendline support + liquidity zone)
Secondary support: 4165 – 4156
Near resistance: 4219
Major resistance / POC: 4241 – 4244
4. Trading Scenario
⭐ Primary (and only) scenario – Weekend Buy Scalping
Buy: 4185 – 4180
Stop Loss: 4178
Take Profit: At least +15–20 pips from entry
(Traders may choose to secure partial profits at nearby resistance levels.)
Today, Lana will not open any long-term positions — she focuses solely on this scalping setup.
Next week, once the PCE data and the Fed’s decision provide clearer market direction, she will share more detailed updates. 💛
👉 Follow Lana on TradingView to receive the earliest gold analysis updates.

XAUUSD – H1 in a Downward Channel | Prefer Selling at Channel...XAUUSD – H1 in a Downward Channel | Prefer Selling at Channel Top & Buying at Trendline + Fibonacci
Market Structure (H1)
Gold is currently sliding inside a well-defined downward channel after forming a top around the 4.22x–4.23x region.
With this structure in place, I avoid taking trades in the middle of the channel.
Instead, I focus only on the two extreme zones:
Sell at the upper channel resistance
Buy at the lower trendline + Fibonacci confluence
🎯 Trading Plan for Today
1️⃣ Sell Scenario – Short Position at Resistance 4,203
Sell: 4,203
Stop Loss:
4,225 (aggressive)
4,249 (safer for swing positions)
Take Profit: 4,183 → 4,161 → 4,143
Why 4,203 Is a Strong Sell Zone
It is the upper resistance of the H1 descending channel.
Price previously faced strong selling pressure here (supply zone).
If gold pulls back to retest 4,203, I prioritise short positions following the channel structure.
The first target is the recent low near 4,183, and extended targets lie at 4,161–4,143, aligned with mid-channel demand.
2️⃣ Buy Scenario – Long Position at Channel Bottom (Trendline + Fibonacci)
Buy: 4,142
Stop Loss:
4,119 (aggressive)
4,098 (safer option)
Take Profit: 4,170 → 4,198 → 4,205
Why 4,142 Is a High-Quality Buy Zone
Confluence of the major ascending trendline,
Fibonacci support,
And a previous demand area.
If gold falls into this zone and prints strong bullish reactions (pin bars, long wicks, rising volume), I consider it a valid counter-trend buy setup, aiming for the mid-channel and the 4.20x resistance.
📌 1️⃣ Fundamental Context
The USD is attempting a short-term rebound from its lowest levels since late October, creating temporary pressure on gold.
However, this recovery is limited because the market expects the Fed to shift toward a more dovish stance:
Recent macro data shows the US economy is cooling, with slowing growth.
Labour market conditions appear softer in November.
As a result, the probability of a 25bps rate cut at next week’s FOMC meeting has increased.
This keeps the medium-term outlook for gold positive, even though the current phase on H1 is still a technical correction.
Summary:
Short-term downside within the H1 channel,
But medium-term bias for gold remains supported by rate-cut expectations.
📌 2️⃣ Technical Outlook & Market Psychology
The H1 descending channel indicates a distribution/correction phase following a strong upward move.
Each touch of the channel top triggers selling — showing sellers remain active at higher prices.
The lower boundary + long-term trendline near 4.14x acts as an attractive area for medium-term buyers waiting for discounted entries.
Current sentiment:
Short-term traders: prefer selling at resistance and buying at support within the channel.
Medium-term traders: patiently wait for deeper zones near 4.14x, avoiding FOMO entries around 4.20x.
📌 3️⃣ Execution Plan
I avoid trading in the middle of the channel.
Only act at the two extremes:
Sell setup: 4,203
Buy setup: 4,142
Risk per trade is limited to 1–2% of the account.
Choose SL depending on timeframe (aggressive vs. conservative).
If price breaks the channel decisively
Above 4,249 (H1 close) or
Below 4,098,
→ I cancel all current setups and reassess the structure.

XAUUSD – LANA | Sell 4190–4194 and Buy 4100–4102 | 04/12 ...XAUUSD – LANA | Sell 4190–4194 and Buy 4100–4102 | 04/12
1. Fundamental Analysis
The current market sentiment is dominated by concerns about a global economic slowdown.
In a recession cycle, bond yields in the US and Europe tend to fall faster than in Japan, as these regions still have more room for rate cuts.
This results in:
A narrowing yield spread, causing USD/JPY carry trades to unwind.
Increased risk-off sentiment, pushing money back into JPY and safe-haven assets like gold.
If risk aversion strengthens further, USD/JPY may experience sharp declines rather than a slow drop.
Such volatility in the currency market often triggers strong swings in gold as well, providing better liquidity zones to trade — instead of chasing price at unfavourable levels.
2. Technical Analysis
On the H1 chart, gold is currently being squeezed between two major trendlines:
Upper descending trendline: drawn from the 4,245–4,260 highs, indicating sellers are active whenever price touches this line.
Lower ascending trendline: extending from the previous month’s low, acting as support for the medium-term uptrend.
Key zones on the chart:
Timing zone 4190–4194:
Near the descending trendline + previous volume cluster.
This is Lana’s preferred short-term Sell zone.
Buy zone at POC – VAL (Volume Profile):
A price area where strong trading activity occurred previously — potential buying interest if price corrects deeper.
Buy Liquidity Zone 4100–4102:
Located just above the major ascending trendline.
An attractive liquidity zone for trend-continuation buys if the market flushes downward.
Summary:
Price may first retrace to 4190–4194 and weaken from there.
If price drops to 4100–4102 and holds the ascending trendline, this becomes a solid area to consider buying again.
3. Key Price Levels to Watch
Resistance / Sell zone: 4190 – 4194
Invalidation for Sell (wide SL zone): 4219 – 4231 Support / Buy zone: 4100 – 4102
SL options for Buy setup: 4081 – 4063 – 4045 (depending on individual risk appetite)
4. Trade Scenarios
⭐ Short-Term Sell Setup
Sell entry: 4190 – 4194 SL: 4219 – 4231 TP: 4181 – 4155
⭐ Deep Buy Setup (Trend-Following)
Buy entry: 4100 – 4102 SL: 4081 – 4063 – 4045

XAUUSD – H1 Sideways, Priority is Trading at Liquidity Zones...XAUUSD – H1 Sideways, Priority is Trading at Liquidity Zones
Gold is moving sideways on the H1 timeframe, with price fluctuating around the equilibrium zone and not choosing a clear direction yet.
In this condition, I avoid chasing trades in the middle of the range — instead, I only trade at the liquidity edges, where volume is higher and order-flow signals are clearer.
🎯 BUY Scenario – “Liquidity Buy” at the Lower Range
Buy: 4.191 – 4.194
SL: 4.187
TP: 4.212 – 4.235 – 4.260 – 4.290
The 4.191–4.194 zone is a Liquidity Buy area:
It aligns with the most recent sweep low.
It sits near a thick volume cluster showing strong absorption of sell orders earlier.
If price dips into this zone, I prefer buying back toward the upper boundary of the range, taking partial profits from 4.212 up to 4.26x.
This setup follows the idea of catching the defensive buy flow that is protecting the bottom of the accumulation zone.
🔁 SELL Scenario – Sell POC at Upper Range 4.237–4.240
Sell: 4.237 – 4.240
SL: 4.245
TP: 4.220 – 4.202 – 4.180 – 4.155
The 4.237–4.240 zone is a Sell POC / supply region:
Heavy volume sitting at the top.
Confluence with the current range high.
Price has previously rejected several times from this region.
If price returns to this zone, I prefer selling down toward the mid and lower range.
SL is kept tight above 4.245 to avoid being caught by a genuine breakout.
1️⃣ Broader Context – Market Shock ≠ Market Collapse
2013 – Abenomics: BOJ’s extreme easing caused volatility, but no systemic crash.
2022–2023: Fed hiked aggressively; risk assets corrected but eventually recovered.
Lesson: Modern financial markets are highly resilient to policy shocks.
For gold, this means:
Current pullbacks are not signs of a trend collapse — they are position re-balancing phases.
Our task is to read price levels & liquidity instead of reacting emotionally to short-term news.
2️⃣ Technical View from H1
Price is ranging between ~4.19x and ~4.24x.
Volume Profile shows most volume at the centre; liquidity is thin at both edges — perfect zones for stop hunts and reversals.
A deeper Buy Zone POC lies around 4.16x.
If price breaks below 4.155 and closes beneath it, the short-term bullish structure becomes threatened.
With no clean breakout yet, I stick to a mean-reversion strategy:
Buy at the liquidity bottom
Sell at the supply top
Until the sideways structure breaks
3️⃣ Today’s Trading Plan
Only trade around the two edges:
✔ Buy Setup
Buy: 4.191–4.194
SL: 4.187
TP: 4.212 – 4.235 – 4.260 – 4.290
✔ Sell Setup
Sell: 4.237–4.240
SL: 4.245
TP: 4.220 – 4.202 – 4.180 – 4.155
No entries in the middle of the range to avoid getting “bitten from both sides.”
Keep risk at 1–2% per trade, do not widen SL.
If price breaks strongly beyond either boundary and stabilizes, I stop the range-trading strategy and wait for a new structure.
If you find this analysis useful, feel free to follow the TradingView account and share whether today you prefer BUY at the bottom or SELL at the POC zone.

XAUUSD – LANA LOOKS FOR WAVE 5 BUY, SKIPS ALL SELL SETUPS ON ...XAUUSD – LANA LOOKS FOR WAVE 5 BUY, SKIPS ALL SELL SETUPS ON 03/12
1. Quick Summary
Main timeframe: H2 – H4
Data used: TPO, Footprint, Elliott Wave, futures/option flow
Core idea: Today Lana prioritises BUY setups only, aligned with Wave 5.
Key zone: Buy around 4190–4194, SL 4185, TP targeting the Wave 5 peak near 4315.
2. Futures & Market Profile Data
1. US Session TPO – “Thin” Structure
Yesterday’s TPO formed a Thin Profile, which commonly appears after a shakeout in an overall uptrend.
The Value Area was accepted at the lower region, but the market did not spend much time there.
Upper auction zones remain unfinished → increasing the probability that price will return to retest higher levels.
2. Footprint Chart – Strong Trap Sell with Negative Delta
On the H1 candle, the Footprint chart recorded a Trap Sell with Delta around –1113 contracts.
Sellers attempted a push down but were absorbed completely, leaving many short positions trapped at the candle’s low.
Lana interprets this as a sign that smart money is accumulating — shaking out weak buyers while absorbing fear-based sell orders.
3. Elliott Wave Outlook & Key Price Areas
The raw Elliott Wave count is still following the scenario Lana shared earlier this week:
Monday: Uptrend confirmed.
Tuesday: Wave 4 correction, offering a small sell opportunity.
Wednesday (today): Expectation of Wave 5 upward, so Lana focuses on buying.
The 4190–4194 zone aligns with the recent swing low and a strong liquidity/accumulation area.
Ideal Take-Profit Levels:
Minimum: Current Wave 5 high
If the wave extends cleanly:
Around 4315
Higher liquidity clusters at 4250–4260 and 4365–4370, based on H4/H2 chart structures
4. Trading Plan
⭐ Primary Scenario – ONLY BUY Today
Buy: 4190 – 4194
Stop Loss: 4185
Target: Current Wave 5 top
Extended target: Around 4315 (traders may divide TP depending on personal strategy)
Lana does not recommend selling against the trend today.
This is Lana’s personal market view based on TPO, Footprint, and the Elliott Wave model.
👉 Follow Lana on TradingView to receive the earliest updates.

What do you think about gold’s movement today?Hello traders!
What do you think about gold’s movement today?
Market Context
This morning, the Fed Chair delivered a speech without mentioning any economic updates. Despite that, gold still showed a corrective move, indicating that the SELL side remains dominant at the moment.
Main Strategy for Today
🔴 Prefer SELL setups
Stop selling only if price breaks above 4,246 — a key level defended by sellers.
Consider SELL entries at the previous high 4,265.
Additional SELL reaction zone to watch: 4,227 – 4,225.
BUY on deeper pullbacks
Ideal BUY zone: 4,194 – 4,190
BUY zone: 4,209 – 4,206
→ Only BUY if strong support reactions or reversal patterns appear.
🎯 Risk Management
Stop Loss (SL): 100 pips
Take Profit (TP): 100 pips
→ Maintain consistent risk throughout the session.
Do you think gold will continue to face bearish pressure and break lower,
or will it bounce from these deeper support zones and regain momentum?

XAUUSD – Healthy Correction, Favour Short-term Sells & Buy at...✨ XAUUSD – Healthy Correction, Favour Short-term Sells & Buy at POC
Gold has just tapped a new high around 4,264 — the highest level in six weeks — and is now entering a technical correction phase.
Liquidity on the sell side has been tested, but the medium-term uptrend remains intact, so my plan is to trade both directions:
Sell short-term when price retraces into supply
Buy again at the POC zone, where buying interest is likely to return
🎯 Scenario 1 – SELL at the POC Zone 4.236–4.238
Sell: 4.236 – 4.238
SL: 4.244
TP: 4.220 – 4.202 – 4.180 – 4.145
On the H1 chart, 4.236–4.238 is the POC area + the volume distribution top, aligning with the upper boundary of the small consolidation after the steep rally.
If price retests this region, I prioritise a scalping sell along the ongoing correction, targeting:
4.220 – 4.202: short-term support
4.180 – 4.145: deeper support, confluence with the major ascending trendline
This setup goes against the medium-term uptrend, so I keep position size small and use a firm SL at 4.244.
⭐ Scenario 2 – BUY at the POC Buy Zone 4.156–4.158
Buy: 4.156 – 4.158
SL: 4.150
TP: 4.175 – 4.190 – 4.225 – 4.250
The 4.156–4.158 zone is the POC Buy area, with:
Confluence of the ascending trendline
The accumulation zone before price broke out toward 4.26x
If gold pulls back deeply and forms a strong reaction (pin bar, long wick, rising buy volume), I consider this a good DCA opportunity following the medium-term uptrend, targeting 4.19x – 4.225, and higher toward 4.25x.
1. Fundamental Context
Gold and silver continue to benefit from expectations of upcoming Fed rate cuts, a weakening USD, and signs of a slowing US economy.
Gold has gained +6% in November, marking the 4th consecutive positive month, and is up over 60% YTD — on track for its strongest annual performance in 46 years.
Economic and geopolitical uncertainty continues to push flows into safe-haven assets, with silver additionally supported by industrial demand — indirectly strengthening sentiment toward precious metals.
Key events on 02/12:
08:00: Fed Chair Jerome Powell speaks
22:00: Fed Governor Bowman testifies before the House Financial Services Committee
Both events may trigger strong intraday volatility, especially if the Fed’s tone deviates from the market’s “dovish expectations”.
2. Technical & Market Sentiment Outlook
After the vertical rally to 4.26x, gold is sliding inside a descending channel on H1, reflecting short-term profit-taking pressure.
Sell POC 4.236–4.238 is where sellers are defending aggressively — every retest brings visible supply.
Buy Zone POC 4.156–4.158 is where buyers previously absorbed large sell orders before pushing price upward; this zone will likely be defended to protect the medium-term uptrend.
Current sentiment:
Short-term: Sellers have the edge due to profit-taking after a new high
Medium-term: Capital still prefers gold, so I avoid turning fully bearish unless 4.145 breaks decisively
3. Action Plan
Short-term Sell if price retests 4.236–4.238
SL: 4.244
TP: 4.220 – 4.202 – 4.180 – 4.145
Buy again at 4.156–4.158 if a strong reaction appears
SL: 4.150
TP: 4.175 – 4.190 – 4.225 – 4.250
Keep risk per scenario at 1–2% of your account
Never widen the SL when the market goes against your position
During Powell/Bowman speeches, reduce lot size or stay out to avoid getting hit by sudden spikes

XAUUSD – LANA’S CORRECTION OUTLOOK FOR 02/12✨ XAUUSD – LANA’S CORRECTION OUTLOOK FOR 02/12
1. Quick Update
Today, Lana views gold as being in a short-term corrective phase, mainly forming Wave 4 in Elliott Wave, after a strong upward move earlier.
The goal is to take advantage of this technical pullback to:
Sell short toward lower price zones
Then buy again at a strong support area in line with the main trend
2. Technical Analysis
The 4250–4260 Liquidity Zone on the weekly timeframe is a very strong liquidity region based on Market Profile.
Lana considers this an area prone to a “fake break” — price may push up to grab liquidity before pulling back.
Based on Session data, Lana prioritises the scenario where:
Price gets rejected around that upper liquidity region
Then forms a downward move toward 418x, completing the Wave 4 correction
Once Wave 4 is complete, the medium-term uptrend can still continue.
3. Key Price Zones
Liquidity / Strong Resistance:
4250 – 4260
Short-term Sell Zone:
4236 – 4241
Buy Zone (Trend-follow Buy):
4180 – 4175
4. Trading Scenarios
⭐ Scenario 1 – Sell with the correction
Sell: 4236 – 4241
SL: Above 4245
Target: 418x (can take partial profits around 4180)
⭐ Scenario 2 – Buy with the trend after correction
Buy: 4180 – 4175
SL: 4170
TP: Minimum 20 dollars (you may take profit gradually at nearby resistance levels)
Lana’s Priority Approach
Avoid buying directly at the Liquidity Zone 4250–4260
Be patient and wait for:
✔ Sell at 4236–4241
✔ Buy at 4180–4175 following the main trend
This is Lana’s personal view for the correction phase on 02/12.
Please evaluate carefully and manage your risk before entering any trade. 💛

XAUUSD – Early-week continuation buys, targeting Fibonacci ...✨ XAUUSD – Early-week continuation buys, targeting Fibonacci extension zones
Gold enters the new week under a very special market backdrop:
+6.0% in November, marking the 4th consecutive bullish month.
This follows +3.7% in October and +11.9% in September.
Year-to-date, gold is up about 60.7%, on track to record its strongest yearly gain in nearly five decades.
With a market that is literally making history, I am not trying to pick the top. I continue to prioritise trend-following buys, and only consider quick counter-trend sells at extended Fibonacci levels.
🎯 Scenario 1 – BUY THE DIP in line with the bullish trend
Buy: 4,194 – 4,195
SL: 4,185
TP: 4,210 – 4,235 – 4,270 – 4,295
The 4,194–4,195 zone on H1 is the VAL / lower boundary of the volume distribution after a strong impulsive move. It aligns with short-term structural support. If price pulls back cleanly into this area and forms a solid rejection candle, I prefer adding BUY positions with the prevailing trend.
Take-profit structure:
4,210 – 4,235: Near-term resistance zone, also around the 1.618 Fibonacci extension.
4,270 – 4,295: Major extension zone 2.618 Fibo, where selling pressure and short-term reversals may become stronger.
🔁 Scenario 2 – Short-term SELL at Fibo 2.618 extension
Sell: 4,285 – 4,287
SL: 4,295
TP: 4,262 – 4,240 – 4,210
This is a counter-trend setup, suitable only for small-lot scalping trades.
If price is pushed into the 4,285–4,287 region (near the 2.618 Fibo extension) but fails to sustain momentum—leaving long wicks or clear bearish reversal signals—I will consider SELLing back toward 4.26x – 4.24x, and deeper to 4.210.
1. Technical View from the Charts
The trend on H1/H4 remains strongly bullish, with higher highs and higher lows, and price respecting the upward channel.
The latest impulse has already extended above the 1.618 Fibo, now targeting the 2.618 extension around 4.28x–4.29x.
Below, VAL around 4.19x is the first support; deeper lies sell-side liquidity near 4.16x, where many buy-side stops are clustered (only relevant for deeper intraday corrections).
Given this structure, every pullback into support is treated as a trend-continuation opportunity, not a reversal signal.
2. Market Sentiment & Action Plan
After months of strong gains, the market is showing clear FOMO behaviour. This is why I avoid buying directly at resistance and instead wait for price to return to accepted value zones (VAL/POC) for better risk-to-reward entries.
The SELL setup is only a secondary scenario, triggered when price reaches a high Fibo extension and fails—usually leading to heavy profit-taking from earlier buyers.
✅ My Trading Plan
Primary Setup
BUY 4,194–4,195
SL 4,185
TP 4,210 – 4,235 – 4,270 – 4,295
Secondary Setup
SELL 4,285–4,287 (only with a clean bearish reversal signal)
SL 4,295
TP 4,262 – 4,240 – 4,210
Risk per scenario remains capped at 1–2% of the account.
No widening of stop-losses, and I stay out if market structure breaks.

XAUUSD – LANA FOCUSES ON BUYING WITH THE SWING TREND AT THE...✨ XAUUSD – LANA FOCUSES ON BUYING WITH THE SWING TREND AT THE START OF THE WEEK
Fundamental Analysis
The Fed has just announced that it will end its QT (Quantitative Tightening) programme starting from 1st December, along with setting the federal funds target rate at 3.75–4%.
When QT stops, the balance-sheet reduction slows down, meaning liquidity is no longer being aggressively withdrawn from the market. This generally supports risk assets — and gold as well.
Mechanism recap:
QE: Expands the Fed’s balance sheet, injecting liquidity into the market.
QT: Shrinks the balance sheet, pulling liquidity out.
With QT paused, the market expects the Fed to take a softer stance on monetary policy, which strengthens the medium-term bullish outlook for gold.
Given this environment, Lana expects gold to retain upside potential early in the week, though price may show volatility near key liquidity zones.
Technical Analysis
On the H4 timeframe, price structure is following a clear bullish Elliott Wave sequence (1)–(2)–(3)–(4)–(5). The current upward wave has not shown any major reversal signal yet.
The Swing Zone at 4190–4195 is the nearest important low and serves as the primary short-term support. This is Lana’s preferred zone for swing-trend buying.
Above price, two notable Liquidity Zones are forming:
4250–4260: Near liquidity zone where fake breaks or temporary pullbacks may appear.
4365–4370: Higher liquidity zone aligned with previous highs — likely an area for significant profit-taking if the bullish wave continues.
Lana’s main expectation: gold may pull back slightly into the 4190–4195 swing zone, then extend the bullish wave to re-test the liquidity regions above. However, since liquidity zones often create stop-hunts and fake breakouts, Lana does not recommend buying directly at these resistance levels.
Key Price Levels
Main Support (Swing Buy Zone): 4190 – 4195
Resistance / Liquidity Zones:
4250 – 4260
4365 – 4370
Trade Setup
Buy: 4190 – 4195
Stop Loss: 4185
Take Profit: 4250 – 4260 – 4365 – 4370

XAUUSD – H4 Fibonacci Supports the Bullish Trend, Prefer ...XAUUSD – H4 Fibonacci Supports the Bullish Trend, Prefer Buying at the POC for the Coming Week
Gold closed Friday near 4,215, following a strong rally after the CME system glitch.
On the H4 timeframe, the bullish structure is now clearly forming and remains relatively stable. Price has just broken out of a multi-day consolidation zone and is moving into the Fibonacci extension levels.
With the current context, I continue to prioritise medium-term buy setups on pullbacks to the POC, rather than chasing price at new highs.
🎯 Primary Trading Plan – BUY THE DIP Using Fibonacci & POC
Buy Entry: around 4,187
Stop Loss: 4,175
Target Levels: 4,225 – 4,240 – 4,290 – 4,300
These profit-taking zones are derived from the H4 Fibonacci extensions, with the 1.618–2.618 levels being areas where strong profit-taking often appears in the market.
For every position, I maintain risk at only 1–2% of the account — staying in the game matters more than trying to catch every top or bottom of a wave.
Key Level:
4,160 is the major support and the “life line” of the H4 uptrend.
If price breaks below and closes under 4,160 on H4, the current bullish structure is invalidated. In that case, I will pause the BUY scenario and rebuild a new plan — possibly considering a deeper SELL setup in the next analysis.
1. Fundamental Context
Gold’s strong recovery momentum recently slowed down after failing to stay above the 4,160 region.
However, the previous rally took place while the USD was weakening again, despite US bond yields attempting to recover across the curve.
On the higher timeframes, gold is on track for its fourth consecutive bullish month, following the major breakout in October that once again drew attention to the 4,400 region.
Prolonged geopolitical tensions combined with expectations of further Fed rate cuts give buyers enough reason to maintain mid-term positions, even if short-term volatility increases.
Overall, the fundamentals remain supportive of the uptrend — unless there is a major shift in interest-rate expectations or systemic risk.
2. H4 Technical Analysis – Fibonacci Perspective
The previous consolidation zone around 4,160–4,185 was broken to the upside with a series of strong bullish candles, confirming a higher-high, higher-low structure on H4.
The POC (Point of Control) has shifted upward to 4,187, signalling heavy trading activity before the breakout — a suitable area for waiting on a retest to buy again.
Fibonacci extensions from the latest bullish swing highlight important resistance clusters ahead:
1.618: the 4.24x zone — first profit-taking target, likely to see volatility.
2.618: the 4.35x–4.36x region — an extended target if the bullish trend continues strongly.
With this structure, any pullback to 4,187 while holding above 4,160 is, for me, a medium-term BUY opportunity, not a reversal signal.
3. Market Sentiment & Action Plan
After a strong rally, the market is experiencing FOMO buying at elevated levels.
This phase often brings sudden pullbacks to shake out late buyers.
I avoid chasing the price during this stage.
Instead, I wait for price to revisit the POC at 4,187, where volume previously accumulated, to secure a better risk-to-reward and a tighter SL.
If buyers truly dominate, they will protect the 4,160–4,187 region.
If not, stepping aside after structure breaks is safer than forcing a bias.
Plan for Next Week
Priority: Buy around 4,187
SL: 4,175
TP: 4,225 – 4,240 – 4,290 – 4,300
If price breaks strongly below 4,160 and closes under it on H4 →
Cancel all BUY plans and wait for a new structure before considering any deep correction SELL setup.
Do not chase buys near high Fibonacci extension levels unless there is a clear intraday setup with a well-defined SL.
If you find this perspective useful for your gold trading plan next week, follow the TradingView account and share which levels you are watching for entries. I always read the feedback to improve future analyses.

XAUUSD – LANA TRACKS MID-TERM WAVE 5 TOWARDS THE ATH ZONE AT ...XAUUSD – LANA TRACKS MID-TERM WAVE 5 TOWARDS THE ATH ZONE AT 4360
1. Fundamental Analysis
On the geopolitical front, President Putin has once again reiterated the conditions for a ceasefire between Russia and Ukraine. While the possibility of a peace agreement remains uncertain, his firm stance suggests the conflict is unlikely to end soon. This keeps gold supported as a mid-term safe-haven asset.
On the US side, Donald Trump continues to emphasise that the stock market will keep making new all-time highs, and even mentioned the potential removal of most income taxes, replacing them with tariff-based revenue. These comments fuel “risk-on” sentiment for equities and the USD, creating short-term fluctuations for gold.
Overall, Lana expects gold to maintain a mid-term bullish bias over the next 1–2 weeks, though short-term volatility is likely as the market constantly re-prices geopolitical risks and US policy expectations.
2. Technical Analysis
On the D1 timeframe, gold is forming a mid-term Elliott Wave 5 structure. Wave (4) has completed at a key support region, accompanied by a bullish market structure shift (MSS), signalling the start of Wave (5).
Using the Fibonacci extension tool, the theoretical target for Wave (5) lies around the 2.618 extension at 4360 — a strong psychological level and close to the potential ATH zone, where significant profit-taking from buyers may appear.
On the way up, the 4246 level is a major resistance zone:
If price breaks this level decisively and closes above it on D1, the bullish trend strengthens, confirming buyers are willing to push price to new highs.
The descending trendline has already been broken. After the breakout, price retested the line and bounced, showing buyers have regained control. A pullback towards the trendline zone at 4133–4139 would give Lana a clean opportunity to join Wave 5 with a better risk-to-reward ratio.
3. Key Price Levels to Watch
Major Resistance / Mid-term Take-Profit Zones:
4240 – 4246: Intermediate resistance; needs a clear breakout to reinforce the bullish trend.
4360: Fibonacci 2.618 extension & potential ATH target for Wave 5.
Support / Potential Buy Zones:
4133 – 4139: Near the trendline; Lana’s preferred buy zone if price pulls back.
4124: Technical stop-loss level; a break below may weaken the short-term bullish wave structure.
4. Trade Setup
BUY: 4133 – 4139
SL: 4124
TP: 4240 – 4280 – 4350
👉 Follow Lana on TradingView for the earliest gold analysis updates. 💛

XAUUSD – LANA WAITING TO BUY THE CONTINUATION WITHIN THE ...XAUUSD – LANA WAITING TO BUY THE CONTINUATION WITHIN THE UPTREND CHANNEL
1. Fundamental Analysis
Gold is maintaining its upward momentum as investors closely monitor the Russia–Ukraine tension and the mixed signals around potential peace efforts.
President Putin’s recent statements suggest peace proposals could form the basis of a future agreement, yet Russia is still prepared to continue fighting if conditions are not favourable. This creates a mixed risk environment — reducing short-term safe-haven demand but still keeping geopolitical uncertainty elevated, which may pressure the USD in the medium term.
In this context, Lana prefers the scenario where gold continues to follow the broader uptrend, looking for opportunities to buy on technical pullbacks into major liquidity zones rather than FOMO entries at higher prices.
2. Technical Analysis
On the H1 timeframe, XAUUSD is moving inside a clear ascending channel, currently trading near the midline of the channel. The dominant structure remains bullish, with no sign of a break of market structure.
After a strong bullish candle, the market left a Strong Liquidity area below and created a small Gap under the channel — this is where Lana expects price to retrace and retest before resuming the upward movement.
The Buy zone aligns with a major liquidity region near 4,166–4,167, close to the lower boundary of the channel — an ideal level for continuation buys during a controlled pullback.
Using Fibonacci extensions, the key levels include:
1.618: near the current price — a region where price often pauses or consolidates
2.618: around 4,210 — Lana marks this as a potential short-term Sell scalping zone
3.618: around 4,235–4,237 — a stronger Sell zone where heavy profit-taking may appear
The 4,155 level is a key structural boundary:
If price breaks below and holds under this zone, Lana will stop prioritising long-term buy setups, as the bullish channel may be invalidated.
3. Key Levels to Watch
Support / Buy zone & strong liquidity:
4,166 – 4,167 (near the midline descending toward the lower channel boundary)
4,155 — mid-term trend boundary
Resistance / Fibo extension & Sell zones:
4,210 – 4,213: Sell scalping zone (Fibo 2.618)
4,235 – 4,237: Strong Sell zone (Fibo 3.618), near the channel top
4. Trade Setups
BUY Setup:
Buy: 4166 – 4167
SL: 4160
TP: 4182 – 4195 – 4210 – 4250
SELL Setup 1:
Sell: 4210 – 4213
SL: 4218
TP: 4200 – 4185 – 4160 – 4145
SELL Setup 2:
Sell: 4235 – 4237
SL: 4243
TP: 4212 – 4200 – 4185 – 4160
👉 Follow Lana on TradingView to read all updates early. 💛

XAUUSD – H2: The Discount Zone Is Formed, Now Waiting for ...XAUUSD – H2: The Discount Zone Is Formed, Now Waiting for Price to Retrace for Continuation Buys
On the H2 timeframe, gold has just made a strong breakout above the 4,180 zone after a period of tight consolidation. Since it is the weekend and also Thanksgiving in the US, I will only prioritise pullback buys at discounted levels — absolutely no chasing price at the highs.
🎯 PRIMARY SETUP – BUY THE DIP at Fibo & POC Zone (4.163–4.160)
Buy Entry: 4.163 – 4.160
Stop Loss: 4.155
Take Profit: 4.178 – 4.195 – 4.220
⭐ SECONDARY SETUP – DEEPER BUY at VAL + Strong Support (4.139–4.136)
Buy Entry: 4.139 – 4.136
Stop Loss: 4.130
Take Profit: 4.150 – 4.172 – 4.190 – 4.220
I always keep total risk per setup within 1–2% of the account.
Fundamental Context
Weekend + Thanksgiving → thin liquidity, more price whipsaws near the close.
Recent comments from Trump & credit data show the economic picture and the December rate path are still uncertain.
This keeps gold supported as a defensive asset, but not strong enough to expect a straight-up rally.
Therefore, I prefer trading based on technical levels and clear zones.
Technical Analysis – H2
Market Sentiment & Trading Outlook
After the breakout, buyers still hold momentum, but the sideways movement at the top suggests partial profit-taking and liquidity patience.
In thin liquidity conditions, price often makes a liquidity sweep down into support before reversing — exactly the move I aim to catch.
Plan
Prioritise Buy at 4.163–4.160.
Only consider the deeper 4.139–4.136 setup if price flushes harder.
All trades use strict Stop Losses (4.155 & 4.130) — no widening.
Take partial profits step-by-step and trail SL as price approaches TP levels.
