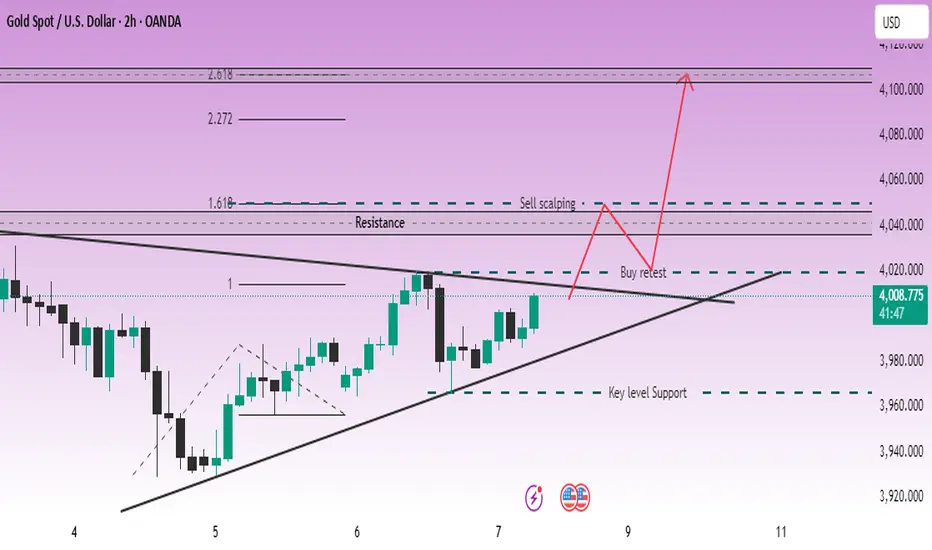
LiamTrading – Gold compressed at the triangle peak; watch for...LiamTrading – Gold compressed at the triangle peak; watch for a break at 4020 (H2)
After a week of accumulation, the price is pressing against the triangle peak between the descending trendline (from late October) and the ascending trendline (from 5/11). The advantage will clearly lean towards an increase if 4020 is broken and held.
Technical Analysis (prioritise H2, Volume Profile – Trendline – S/R – Fibonacci)
Trendline & Structure
The descending trendline is blocking recovery waves; the ascending trendline supports adjustment waves.
Closing the H2 candle above the confluence area ~4020 will confirm a clear upward movement.
Support / Resistance (S/R)
Main support: 3970–3972 (swing low & “Key level Support”).
Decision zone: 4014–4020 (break–retest zone).
Resistance: 4045 (medium-term), 4050 (supply for scalp orders), upper band 4105–4110.
Volume Profile (recent session / composite)
POC magnet: 4015–4017 → likely profit-taking/fluctuations; staying above POC turns this area into a launchpad.
LVN: around 4020 → beautiful break-and-go; failing to hold often pulls back to 4015/4010.
Fibonacci Extension (H2 swing)
1.618 coincides with 4045–4050 → first upward target.
2.272/2.618 creates a liquidity zone 4095–4110 → area may weaken/strong profit-taking.
Today's Trading Scenarios
Scenario 1 – Buy on breakout direction
Entry: 4020–4022 after closing above trendline + retest holding 4018–4020
SL: 4014
TP: 4045 → 4070 → 4100–4110
Management: Partially close at 4045; move SL to breakeven when reaching +1R. Staying above 4020 means POC 4015–4017 should switch roles to support.
Scenario 1b – Buy on adjustment wave (before breakout, cautious volume)
Entry: 3998–4002 (“400x”) when there is an upward reaction at the ascending trendline
SL: 3988
TP: 4017 → 4045
Note: H2 closes below 3988 → cancel the order.
Scenario 2 – Sell scalp at resistance
Entry: 4048–4052 (confluence Fibo 1.618 + supply zone)
SL: 4056
TP: 4040 → 4030 → 4020
Note: This is counter-trend. Ignore if H2 closes strongly above 4052.
Summary
The upward bias is confirmed when breaking–holding 4020, opening targets 4045 → 4070 → 4100+. Before that signal, trade within the range respecting POC 4015–4017 and ceiling 4045/4050. Risk per order 0.5–1%, move SL to BE when reaching +1R.
Tecnicalanalysis
XAUUSD – AWAITING CONFIRMATION OF UPTREND – TARGET 4050💛 XAUUSD – AWAITING CONFIRMATION OF UPTREND – TARGET 4050 🎯
🌤 1. Overview
Hello everyone 💬
Gold today remains in a phase of indecision – waiting for signals to confirm a new trend.
On the H2 chart, the price has broken the downtrend line and is retesting this line. The structure of “higher lows” indicates that buying pressure is gradually gaining dominance.
The previous peak around 4018 is currently the decisive point for the trend – if the price confirms a breakout above, the upward momentum may extend towards the 4050 area.
Currently, the market is fluctuating within the range of 3964 – 4018, and needs to break out of this zone to determine a clearer direction.
💹 2. ICT Perspective
📈 The price has broken the downtrend line and retested the structure on the H2 chart – an early signal for the potential formation of an uptrend.
🟣 The area 3964–4018 is a short-term liquidity accumulation zone before the price expands.
🔹 OB 4040–4042 coincides with significant resistance, suitable for short sell orders (scalp) if there is a strong reaction.
💫 When the price surpasses 4018, the upward structure will be confirmed and the expansion target may aim towards 4050 – 4077.
🎯 3. Reference Trading Plan
💖 BUY scenario (priority when confirmed)
Entry: above 4018 | SL: 4011
TP: 4025 – 4033 – 4050 – 4077
💢 Short SELL scenario (scalping)
Entry: 4040–4042 | SL: 4046
TP: 4022 – 4015 – 3998
⚠️ 4. Important Notes
Clear confirmation is needed when breaking the 4018 zone before entering a buy order.
If the price continues to fluctuate within the 3964–4018 range, trading should be limited.
Today is Friday, manage risk more tightly, prioritise accuracy in each order.
🌷 5. Conclusion & Interaction with LanaM2
Gold is showing positive signals 💛
Be patient and wait for reactions around the 4018 zone – this could be the start of a new uptrend if clearly confirmed.

LiamTrading – Gold confirms medium-term uptrendLiamTrading – Gold confirms medium-term uptrend
Gold has officially broken the downward trendline, confirming the transition phase to a medium-term uptrend. After a prolonged accumulation phase, the market is beginning to show clear buying power, and the potential for an extended rally is gradually forming.
Macro – Fundamental Analysis
The latest report from the World Gold Council (WGC) shows that central banks continued to increase gold purchases significantly in September, totalling 39 tonnes, the highest level since the beginning of the year.
Most notably, the Central Bank of Brazil – for the first time this year – added 15 tonnes of gold to its national reserves.
Since the beginning of the year, the net purchases by central banks have reached 200 tonnes, clearly reflecting the trend of moving away from the USD amidst global economic and geopolitical instability. This capital flow provides a solid foundation for the medium and long-term uptrend of gold.
Technical Analysis
On the H2 chart, gold prices have broken the downward trendline, signaling a reversal and establishing a new upward structure.
The 3985–3988 zone is acting as dynamic support, potentially serving as a retest point before prices continue to rise.
The POC of the Volume Profile at the 4015–4017 zone is a short-term resistance, where the market may see profit-taking reactions before breaking higher.
The 4046 mark is considered a decisive zone; if surpassed and held, the medium-term uptrend will be strongly reinforced.
Today's Trading Scenarios
Scenario 1 – Buy in line with the uptrend:
Entry: 3986–3988 (may wait for retest confirmation)
SL: 3980
TP: 4020 – 4045 – 4090
Scenario 2 – Short sell at resistance:
Entry: 4015–4017
SL: 4023
TP: 4002 – 3986
Summary
Gold is giving clear signals of establishing a medium-term uptrend, supported by buying flows from central banks. Traders should prioritise buying positions at strategic support zones and observe price reactions around the POC to confirm the next direction.

XAUUSD – INTRADAY BULLISH SCENARIO – TARGET 4050💛 XAUUSD – INTRADAY BULLISH SCENARIO – TARGET 4050 🎯
🌤 1. Overview
Hello everyone 💬
Although the larger timeframe for gold still leans towards a bearish trend, today in the short term, I prioritise a bullish scenario.
On the M30 timeframe, the price structure is gradually increasing, indicating that short-term capital is shifting to the buying side.
Zone 3990 is a very important area – where a Break of Structure (BOS) has just appeared and is also a strong resistance that has reacted multiple times before.
Price needs to confirm breaking this zone to continue expanding the bullish trend.
💹 2. Technical Analysis (ICT Perspective)
📈 An ascending structure (BOS) has formed on M30.
🟣 Buy Zone 3977–3979 coincides with the support trendline – a beautiful confluence point for buyers.
🔹 Resistance zone 3990–4000 is the area to confirm the main direction.
💫 Higher target: Fibonacci Extension 1.618 around 4049–4050, coinciding with the psychological resistance 4050.
🎯 3. Trading Plan Reference
💖 MAIN BUY (priority)
Entry: 3977–3979 | SL: 3970
TP: 3988 – 4000 – 4022 – 4040 – 4050
💢 SHORT SELL (when price reacts strongly at resistance)
Entry: 4012–4014 | SL: 4020
TP: 4002 – 3988 – 3965
⚠️ 4. Important Notes
Price needs to confirm through zone 3990 to reinforce the bullish trend.
If it breaks below 3970, the ascending structure is temporarily invalidated.
Today, prioritise buying according to the capital flow, sell only when there is a clear signal at the resistance zone.
🌷 5. Conclusion & Interaction with LanaM2
Gold is showing positive signals 💛
Patiently wait for reactions at the Buy Zone 3977–3979, this could be the starting point for a new upward move towards 4050.
This is not investment advice, just a personal perspective according to the ICT method.
If you find it useful, please 💛 like – 💬 comment – 🔔 follow LanaM2 to update gold analysis with me every day ✨

XAUUSD – PRIORITISE BUYING, TARGET 4040XAUUSD – PRIORITISE BUYING, TARGET 4040 🎯
🌤 1. Overview
Hello everyone 💬
My perspective on gold today remains to prioritise buying, as there hasn't been a clear deep decline.
The price is currently consolidating in a narrow range, needing more time to build momentum before breaking out.
I will wait to buy back at the OB area – where there is high liquidity, this is a region likely to see strong price reactions.
The best scenario today: the price may sell lightly at FVG, then drop to OB to trigger the buy setup.
💹 2. Technical Analysis (ICT Perspective)
💜 Price Structure: Gold still maintains a short-term uptrend, the main trend hasn't been broken.
💎 Liquidity: Liquidity is concentrated below the 3940 area – potential buying OB.
💫 FVG: The 3975–3980 area is where a slight decline reaction may occur.
⚙️ Order Block (OB): 3938–3945 is a crucial support area, with potential for a strong price rebound from here.
📈 Main Target: 4040 – high liquidity area, coinciding with the large frame FVG.
🎯 3. Reference Trading Scenario
💢 Short SELL (scalping)
Entry: 3980 | SL: 3988
TP: 3972 – 3960 – 3940
💖 Main BUY (priority)
Entry: 3940 | SL: 3932
TP: 3952 – 3968 – 3990 – 4012 – 4035
✨ 4. Important Notes
🔹 Observe price reactions at FVG and OB before taking action.
🔹 If the price exceeds 3988, the decline scenario is temporarily invalidated.
🔹 The main direction remains to buy following the Smart Money trend – only look for short sells with confirmation.
🌷 5. Conclusion & Interaction with LanaM2
Gold is still on the right track of the Smart Money Flow,
patiently wait for the price to reach a favourable area to act 💪
This is not investment advice, just a personal perspective based on the ICT method.
If you find it useful, please 💛 like – 💬 comment – 🔔 follow LanaM2
to stay updated with the latest gold insights every day.

LiamTrading - $XAUUSD$: Second Scenario – BUY UP Priority ...LiamTrading - OANDA:XAUUSD $: Second Scenario – BUY UP Priority After BREAKING RESISTANCE $4002$
With the Support of the US Treasury Secretary
Hello traders community, LiamTrading is back with detailed OANDA:XAUUSD $ analysis for the start of the week!
The Gold market is receiving strong support from policy: US Treasury Secretary Scott Bessent calls on the Fed to continue cutting interest rates as the PCE inflation is currently at $2.7\%$.
This call, aimed at reducing mortgage rates and supporting the housing market, strengthens the long-term outlook for Gold.
Technical Analysis: We prioritize continuing to buy up following the main trend. The best strategy is to enter orders at strong resistance/support zones to ensure the lowest risk.
📰 MACRO FUNDAMENTALS: CALL FOR RATE CUT
Impact: The Treasury Secretary's statement on cutting interest rates to support the "transitioning" economy increases expectations of policy easing, which is a strong support factor for Gold (although not yet an official decision).
Suitable Strategy: Market sentiment is being driven by expectations of easing policy, reinforcing the priority for a BUY (Long) position.
📊 TECHNICAL ANALYSIS: IMPORTANT PIVOT POINT
Resistance Zone $4002$: This area acts as an important pivot point.
Buy Entry will be triggered after the price breaks resistance $4002$ and retests.
Sell Entry: Look for short-term scalping at the resistance zone $4030$ to secure profits. Highlighted Zone: Prioritize entering orders at confirmed Trendline zones.
🎯 DETAILED TRADING PLAN (ACTION PLAN)
We will wait for Gold to break structure and create a BUY setup.
🟢 Main BUY Scenario (BUY Break & Retest)
Logic: Buy at $4002$ after breaking resistance and retesting, leveraging new upward momentum.
Entry (BUY): $4002$
SL: $3995$ (tight SL)
TP1/TP2: $4020$ | $4035$
TP3: $4070$
🔴 SELL Scalping Scenario
Logic: Short-term scalping at the strong resistance zone $4030$ (near Sell Liquidity zone).
Entry (SELL): $4030$
SL: $4038$
TP1/TP2: $4015$ | $4004$
TP3: $3990$
📌 SUMMARY & DISCIPLINE (Liam's Note)
Our BUY strategy is reinforced by policy outlook and technical break at $4002$. Strictly adhere to SL $3995$ to manage risk before the upward structure is confirmed.
Are you ready for Gold's movement at $4002$? Please LIKE and COMMENT!

LiamTrading - $XAUUSD$: NEW WEEK TRADING SCENARIO...LiamTrading - OANDA:XAUUSD $: NEW WEEK TRADING SCENARIO – PRIORITISE SELLING After BREAKING THE TRENDLINE
Hello traders community,
The new week opens with a clear strategy: Prioritise SELLING after Gold has broken the previous upward trendline.
Although fundamental economic news (like interest rate policies and politics) supports Gold potentially reaching the $5,000$ USD mark, we must trade according to the current Price Action. The technical selling pressure is strong. We will SELL at key resistance zones and continue SELLING as the price breaks the downward structure.
📰 FUNDAMENTALS & LONG-TERM OUTLOOK
$5,000$ Prospect: Fundamental and political factors continue to support the scenario of Gold reaching $5,000$ USD in the long term (due to geopolitical risks and potential loss of Fed independence).
Short Term 🔴: Gold is under technical selling pressure after breaking through the $4,000$ USD mark.
📊 TECHNICAL ANALYSIS: TRENDLINE BREAK
Structure: Gold has exited the upward price channel and is retesting the broken trendline.
Priority: SELL at the retest resistance zone $4024$.
🎯 DETAILED TRADING PLAN (ACTION PLAN)
🔴 SELL Scenario (SELL Primary) - Preemptive Resistance
Entry 1: $4024$ (Sell retest trendline zone)
SL: $4032$
TP1/TP2: $4012$ | $4000$
TP3: $3989$
Entry 2 (Continuation SELL): When price breaks the next trendline at $3992$
SL: $4000$
TP: $3940$
🟢 BUY Scenario (BUY Reversal) - Buy at Strong Support
Logic: Only buy when price hits strong liquidity support, potential for a short-term rebound.
Entry (BUY): Around $3960$ (Buy Scalping Zone)
SL: $3954$
TP1/TP2: $3972$ | $3988 FWB:TP3 : $4000$
📌 SUMMARY & DISCIPLINE (Liam's Note) Don't let the $5,000$ USD prospect affect short-term risk management. Trade according to Price Action. Adhere to SL and prioritise SELL positions at resistance zones.
Are you ready for the SELL strategy at the start of this week?

LiamTrading - XAUUSD: Outlook $5,000 USD and Priority BUY... LiamTrading - XAUUSD: Outlook $5,000 USD and Priority BUY Strategy at POC $3973
Hello traders community,
Gold is positioned between an extremely optimistic long-term outlook (forecast $5,000 USD in the next 12-18 months by Bank of America) and short-term technical adjustments.
Although Gold has broken the upward trendline, a sustainable downward trend has not been confirmed.
BUY positions are still prioritised!
🔥 LONG-TERM CONTEXT & INFLATION
Long-Term Push: Gold prices adjusted for inflation have DOUBLED in the past 4 years.
Highlight: Gold reinforces its role as an anti-inflation asset as real prices soar to all-time highs.
📊 DETAILED TRADING PLAN (ACTION PLAN)
Strategy: Buy at POC Zone to leverage liquidity advantage.
🟢 BUY Scenario (BUY Primary) - Buy at High Value Zone
Logic: The $3973 - 3975$ zone is right above the Buy POC (highest value zone).
Entry (BUY): $3973 - 3975$
SL: $3968$
TP1: $3988$ | TP2: $4000
Buy Up Target 2: Buy when price retests the trendline around $4002$.
🔴 SELL Scenario (SELL Scalping) - Preemptive strike at resistance zone
Entry (SELL): $4032 - 4034$
SL: $4040$
TP1: $4022$ | TP2: $4015
📌 SUMMARY & DISCIPLINE (Liam's Note)With the $5,000 USD forecast and inflation factors, the risk of SELL is increasing.
Focus on BUY at POC $3973$ and absolute SL.
Trade responsibly and with discipline!

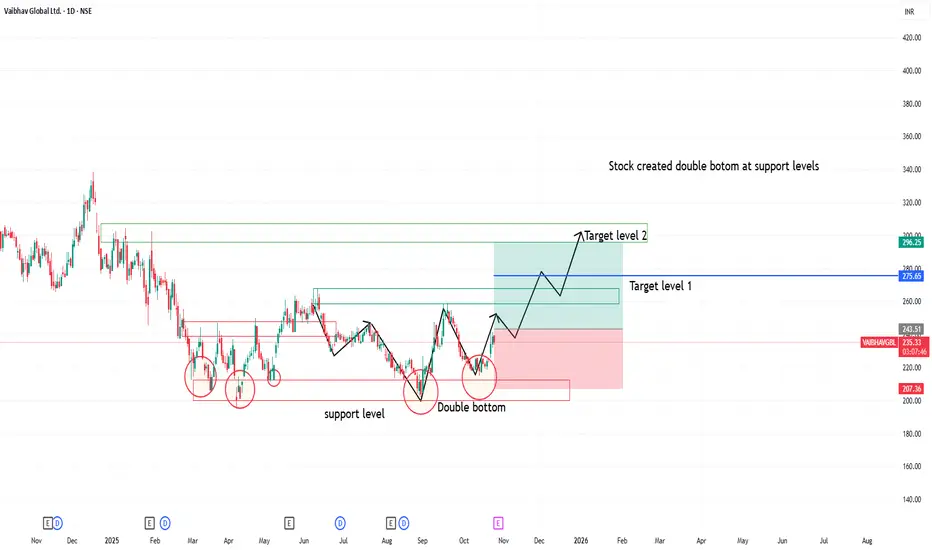
Vaibhav global created double bottom on support levelsStock created double bottom at support levels
good fundamental stock
good for long swing movement
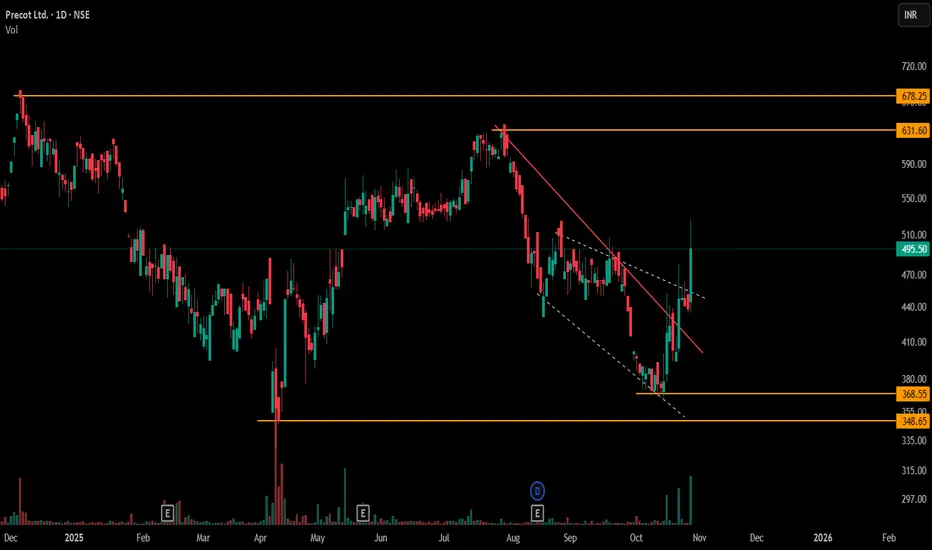
Objective Observation in Sideways Markets1) Sideways market action is clearly depicted here, with price oscillating between well-defined resistance and support bands (marked by orange horizontal lines). The presence of both multiple resistance and support levels typifies a range-bound environment, where relying solely on single breakout/CT patterns may lead to inconsistent observations.
2) To supplement this, a solid red counter-trendline has been drawn across recent swing highs/lows, offering a direct visual of shifting momentum pockets. In sideways phases, such counter-trendlines might limit or expand their analytical usefulness, depending on whether price respects or ignores these boundaries within the broader “box”.
3) Further, layering a secondary dotted formation—a small broadening pattern—provides additional observation reference points. Using both counter-trend and minor broadening structures together helps in mapping probable price responses at key junctions, especially when horizontal supports/resistances cluster.
4) By objectively tracking these intersections and reactions—rather than expecting a directional resolution—traders gain more nuanced insight for potential tactical responses on future moves. No forecasts here; just systematic, multi-pattern observation.
Supply-Demand Squeeze: Symmetrical Triangle at the Flip zoneWitness a textbook supply-demand play on the monthly chart of Bharat Wire Ropes Ltd. as price contracts above a major zone conversion! The chart highlights a high-probability symmetrical triangle pattern—marked with a red counter trendline (lower highs) and a green trendline (higher lows).
This powerful squeeze forms right at the intersection of key supply and demand zones.
- Both supply (resistance) and demand (support) have been mapped for clear zone analysis.
- The symmetrical triangle shows classic price contraction
- Red line: Counter trendline connecting lower highs.
- Green line: Trendline connecting higher lows.
Disclaimer:
This Observation / Post is for educational purposes only and does not constitute investment advice. Please do your own research and consult with a financial advisor before making any trading decisions.

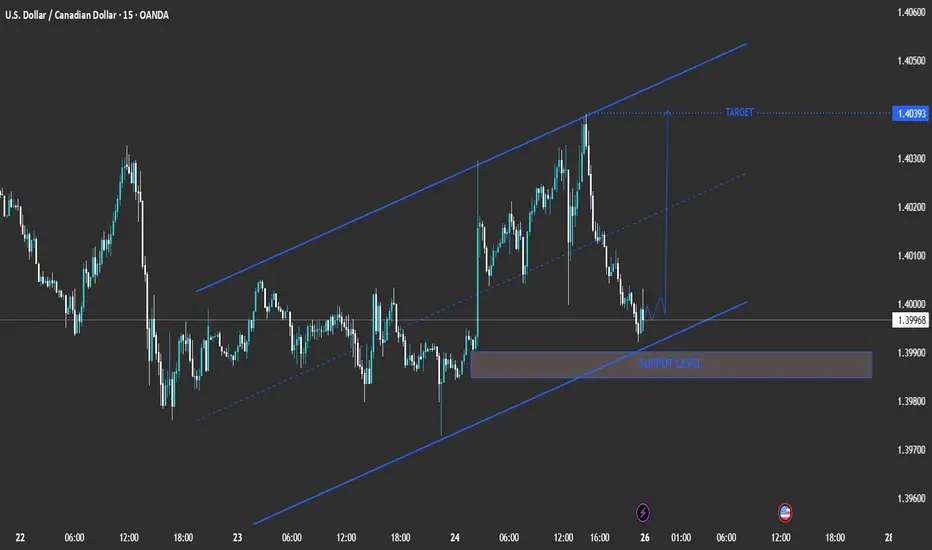
technical analysis of your chart for USD/CAD (15-minute timeframMarket Structure
The pair is moving within an ascending channel, indicating short-term bullish momentum.
Higher highs and higher lows confirm the ongoing uptrend structure.
🟦 Key Zone
Support Level: 1.3985 – 1.3990
This shaded zone represents a demand area where price previously found strong buying interest.
As long as this level holds, the short-term bullish bias remains valid.
🔹 Price Action Outlook
Price is currently testing the lower trendline of the channel and near the support zone.
A bullish reaction from this level could trigger a bounce toward the mid-channel and potentially the upper resistance.
🎯 Target
Upside Target: 1.4039
This corresponds to the upper boundary of the channel and a previous swing high area.
⚠️ Invalidation / Risk Level
A break below 1.3980 would invalidate the bullish setup and could lead to a bearish correction toward 1.3965 or lower.
📈 Trading Signal (Summary)
Bias: Bullish (short-term)
Entry Zone: 1.3985 – 1.3995 (support area)
Target: 1.4039
Stop-Loss: Below 1.3980 FX:EURUSD OANDA:EURUSD OANDA:GBPUSD FX:USDJPY OANDA:USDJPY OANDA:AUDUSD OANDA:GBPJPY OANDA:USDCAD OANDA:USDCHF FX_IDC:USDINR FOREXCOM:EURUSD OANDA:EURNZD
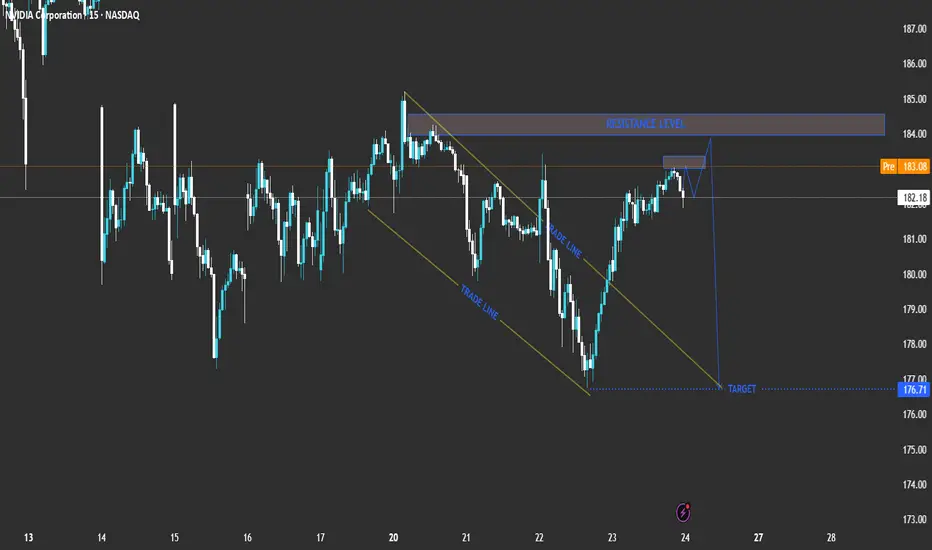
l analysis for NVIDIA Corporation (NVDA) based on your chart:Current Price: 182.18
Pre-Market Price: 183.21
Trend: Short-term bullish recovery inside a broader corrective phase.
Technical Breakdown
Descending Channel (Trade Line)
NVDA recently traded inside a downward-sloping channel, showing controlled selling pressure.
The breakout above the upper trade line suggests a short-term bullish correction phase.
Resistance Zone
A strong resistance level lies between 183.00 and 184.00.
This zone aligns with previous highs and may act as a reversal area if the price fails to break above it.
Expected Move
The chart projection shows a potential rejection near the resistance level, followed by a pullback towards the 176.71 target area.
This indicates that the current upward move might be corrective before another bearish swing.
Trade Scenarios
📉 Bearish Reversal Scenario (Primary Setup)
Entry Zone: 183.00 – 184.00 (resistance area)
Confirmation: Bearish rejection candlestick pattern or a failed breakout.
Target: 176.71
Stop Loss: Above 184.50
Comment: Ideal short setup if price rejects resistance.
📈 Bullish Breakout Scenario (Alternative)
Entry: Above 184.50 with strong bullish momentum.
Target: 186.50 – 187.00
Comment: A breakout and hold above resistance would invalidate the short setup and indicate further upside.
Summary Table
Bias Key Level Confirmation Target Notes
Bearish (Primary) 183 – 184 Rejection candle 176.71 Short setup
Bullish (Alternative) Above 184.50 Breakout candle 186.5 – 187 Upside continuation
Conclusion
NVIDIA (NVDA) is approaching a crucial resistance level. The most probable scenario is a bearish reversal from the 183–184 zone, targeting 176.71. However, a confirmed breakout above 184.50 would signal bullish continuation toward 187.00. EURONEXT:KBCA EURONEXT:UMI EURONEXT:AZE EURONEXT:KBC EURONEXT:ABI EURONEXT:GBLB EURONEXT:LOTB EURONEXT:NYXH EURONEXT:PROX EURONEXT:SIP EURONEXT:ABO EURONEXT:AGFB XETR:SAP GETTEX:NSE XETR:CON XETR:HCL FWB:BREA
XAU/USD: Channel Breakout → Retest → Downside Target at 3,940Pair: Gold Spot (XAU/USD)
Timeframe: 1-hour
Current Price: 4,253.975
Trend: Recently broke out of an ascending channel (bearish signal)
📉 Chart Breakdown
1. Ascending Channel (Trade Lines)
Price was moving steadily inside a rising channel, indicated by the two parallel yellow “TRADE LINE” levels.
The break below the lower trade line suggests weakening bullish momentum and potential trend reversal.
2. Resistance Level (4,320 – 4,360 zone)
Marked in purple, this zone served as a key resistance.
Price rejected strongly from this area, confirming seller presence.
3. Structure Retest and Potential Move
After the channel break, price retraced back to retest the broken channel support (now resistance).
The projected blue path shows a lower-high formation followed by a new drop, completing a bearish continuation pattern.
4. Target Zone
The projected target is near 3,940.693, aligning with previous structure support.
This level could serve as a profit-taking area for short positions.
📊 Summary of Key Levels
Zone Type Range / Level
4,320 – 4,360 Resistance Strong supply zone
4,220 – 4,240 Retest zone Potential short entry area
3,940 Target Bearish target / demand zone
⚙️ Trading Plan Concept (Hypothetical)
Bias: Bearish
Entry Idea: Wait for rejection from 4,220–4,240 zone.
Stop Loss: Above 4,280 (resistance)
Take Profit: Around 3,940 (target)
Risk/Reward: Approximately 1:3 or better
🧭 Conclusion
The chart suggests that Gold (XAU/USD) might be entering a corrective bearish phase after failing to sustain its bullish channel. A retest of broken structure before another drop aligns with typical market structure behavior. EURONEXT:AXFZ2025 EURONEXT:FMXX2025 EURONEXT:QL6X2025 EURONEXT:RH6X2025 EURONEXT:VV8Z2025 EURONEXT:2FTX2025

LiamTrading – GOLD: Risk of ABC Correction Wave..LiamTrading – GOLD: Risk of ABC Correction Wave, Short-term Sell at 4028
Hello traders,
Gold has had an impressive growth week, but as prices hit new highs, the risk of correction always increases. Let's examine this week's Gold scenario based on wave analysis and market liquidity.
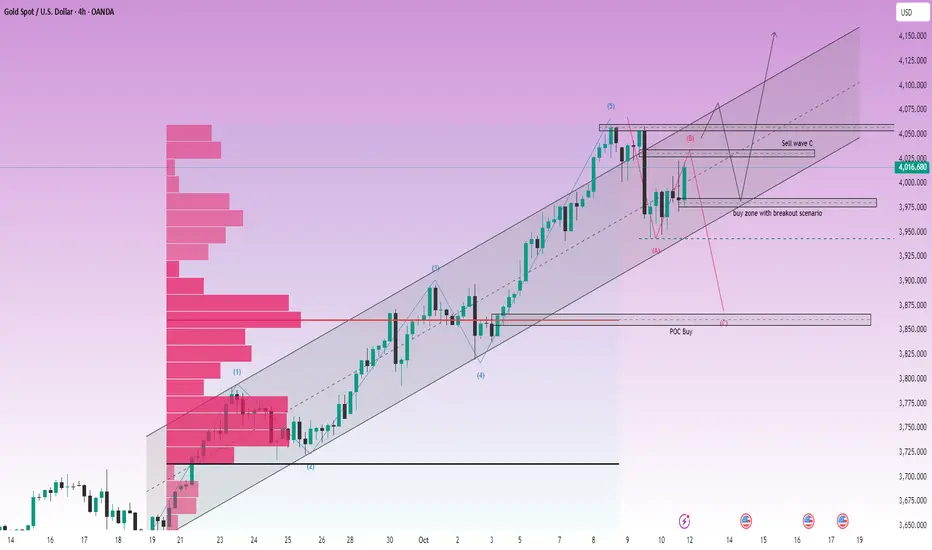
📊 Technical Analysis (Chart H4 – XAUUSD)
Based on the H4 chart, Gold (GOLD) seems to have completed the Push Wave 5 (Elliott Wave 5) in the current uptrend cycle, reaching strong resistance around 4050–4060.
Current Structure:
The price is within a sustainable Uptrend Channel.
The 4050–4060 range is a significant resistance where selling pressure may emerge.
An ABC correction wave scenario appears after completing Wave 5.
Key Liquidity Zones:
Potential Resistance Zone (Sell Wave C): Around 4028–4033 (Price area to watch for the reaction of the final Wave C).
Confirmed Drop Support Zone: 3972 (Critical price area confirming if selling pressure is strong enough).
Attractive Buy Zone: 3976 (Temporary liquidity if price corrects, waiting for Breakout confirmation).
Long-term Buy Zone (POC Buy): ~3850 (Price area with a huge Volume Profile, ideal for long-term buy orders).
🎯 New Week Trading Scenario
📉 Short-term Sell
This scenario is based on the expectation of an ABC correction wave starting from the resistance zone.
📍 Entry: 4033
🛑 SL: 4040 (Very tight SL, suitable for short-term Sell strategy at the wave peak)
🎯 TP: 3976 → 3943 → POC (~3850)
📈 Long-term Buy
This setup waits for a correction to lower liquidity zones to enter Buy orders with optimal R:R ratio.
📍 Entry: 3976 (Temporary liquidity buy zone)
🛑 SL: 3970
🎯 TP: 4040 → 4090 → 4150
🛑 Failure Scenario (Wait for Breakout Confirmation)
If the price breaks the 4060 peak and creates a new ATH (All-Time High), the ABC wave scenario will fail.
Action: Continue to prioritize Buying. The best entry is to wait for the price to retest the broken liquidity zone (Breakout Retest) around 3976.
🧭 Fundamental & Long-term Analysis
Macroeconomic Sentiment: The Royal Bank of Canada (RBC) forecasts Gold to rise to $4,500 in the next two years, bolstered by long-term inflation concerns. This confirms the long-term uptrend of Gold remains intact.
US Dollar Impact (USD): The traditional view is that USD rises as investors seek liquidity during market stress. However, Gold's rise alongside USD shows the market prioritizes gold as an inflation hedge rather than just a safe haven.
Long-term Strategy: The buy zone at POC (~3850) according to Volume Profile is extremely suitable. Large liquidity here will help traders enter optimal orders and hold long-term, leveraging the pressure from the Seller's Liquidity to push prices up.
📌 Conclusion
Gold is at a critical crossroads. Although the long-term trend is up, the short-term correction risk (ABC Wave) at the 4028–4033 zone is very high.
Priority: Watch for short-term sells at the resistance zone with a tight SL.
Safe strategy: Wait to Buy at liquidity support zones like 3976 or POC (~3850) to optimize risk/reward (R:R).
I will continue to update Gold scenarios daily with insights from 8 years of trading experience.
👉 Follow me to not miss important updates!
Sustainable Price Rise: Where’s the Next Optimal Entry?Hello TradingView community! 🚀
Gold (XAU/USD) is in an extremely sustainable upward structure. Instead of lengthy analysis, let's dive straight into the action plan: What is the optimal entry point and what target is Gold aiming for? Check out the details below.
1. Market Structure Analysis: The Strength of the Bulls 🐂
Looking at the chart, the first thing that catches our eye is a series of "BoS" (Break of Structure).
Every time Gold breaks an old peak, it not only creates a Higher High but also confirms that the upward trend is very strong and sustainable. This indicates that buying power is completely overwhelming and shows no sign of weakening. Smart Money is continuously pushing the price higher, and our job is to ride this "wave."
2. Potential Buying Zones - Where to Catch the Wave? 🧐
To optimize profits and minimize risks, finding a beautiful entry point after a price correction is extremely important. Based on the chart, we have 2 noteworthy potential buying zones:
Buying Zone 1 - Fibonacci Confluence ($3885): This is an extremely ideal "Buy Zone," coinciding with the golden Fibonacci ratio of 0.618. In technical analysis, this is a very strong support level, where prices often tend to reverse and continue the main trend. Professional traders always hunt for pullbacks to this zone.
Buying Zone 2 - Exploiting FVG ($3914 - $3933): Slightly higher, we have the FVG (Fair Value Gap) area at $3914 and the "Buy Scalping" zone at $3933. These are "price gaps" created by supply-demand imbalances when prices rise too quickly. The market tends to return to fill these gaps before continuing its journey. This could be an opportunity for those wanting to catch an earlier wave.
3. Target Conquest - What’s Gold’s Next Destination? 🎯
Once we have a buying position, where will our target be?
Short-term target: The "Sell Scalping FVG" zone around $3969 could be a minor resistance point where some traders will take profits.
Main target: The ultimate destination this structure is aiming for is the "Sell Gold Liquidity" zone at $3998. This is an important "liquidity" area, concentrating many stop-loss orders of the Sellers. Prices are often attracted to these zones like a "magnet" to sweep liquidity before making further moves.
Summary & Advice
Main trend: UP.
Primary strategy: Buy on dip when prices correct to important support zones.
Potential buying zones: $3885 (Fibonacci) and $3914 - $3933 (FVG).
Price targets: $3969 (short-term) and $3998 (main target).
Always remember, risk management is the key to surviving in the market. Set reasonable Stop-loss for all your trades.
WHAT DO YOU THINK ABOUT THIS PLAN?
Will Gold retrace to the Fibonacci zone $3885 or react right at the FVG zone $3914? Leave your opinions and perspectives in the comments below. We will discuss together to find the best opportunities!
👇 Don't forget to Like 👍 and Follow my TradingView channel to not miss daily Gold analyses!

LiamTrading – Gold continues to be “crazy”LiamTrading – Gold continues to be “crazy”: Strong trend, but awaiting reaction at 3900
Gold has just recorded its 39th all-time high in 2025, now approaching the 3,900 USD/oz mark. This is not only a significant psychological threshold but also coincides with extended Fibonacci levels, making this area a sensitive point in the market.
Trend & Trendline
On the H4 chart, gold remains firmly within the upward channel formed since early September. The price continuously bounces off the lower trendline and expands its range towards the upper boundary.
The lower trendline around 3760–3780 acts as a dynamic support. If the price breaks below this area, a deeper correction scenario towards 3720–3730 will be triggered.
The upper trendline is currently “pressing” the price right at the 3897–3900 area, confluencing with the 2.618 Fibonacci. This is a strong resistance, potentially causing profit-taking reactions and creating a technical pullback.
Volume Profile & Liquidity
The 3800 and 3720 areas are dense volume clusters, indicating significant capital is positioned here. These are also potential Buy zones when the price corrects.
The 3640–3650 area is a larger liquidity cluster, but will only be activated if a strong breakdown occurs from the current trendline.
Reference Trading Scenarios
Sell zone: 3897 – 3900, SL 3905, TP 3885 – 3862 – 3850 – 3833
Short-term Buy zone: 3797 – 3800, SL 3793, TP 3822 – 3840 – 3855 – 3872 – 3890
Medium-term Buy: 3720 – 3730, SL 3710, TP 3760 – 3800 – 3850
Conclusion
The upward trend remains very strong, but the 3897–3900 area will be a crucial challenge. If the price is rejected here, we might witness a correction back to the lower trendline before gold continues towards the larger target of 4000 USD.
This is my personal view on XAUUSD. Please manage risks carefully and stay updated with the latest scenarios.

XAUUSD – Prioritise waiting to buy after gold hits ATHXAUUSD – Prioritise waiting to buy after gold hits ATH, target 3840
Hello Trader,
Right at the start of the week, gold has set a new ATH, affirming the upward trend remains dominant. The price structure on H1 shows buying pressure remains quite strong, while adjustments are mainly to balance liquidity. In the current context, the preferred trading strategy is still to wait to buy at key support zones, with a target towards 3840.
Basic Context
This week, the usual focus would be on the Nonfarm Payrolls (NFP) data. However, the risk of a US Government shutdown might delay this crucial report.
The US fiscal year runs from 1/10 to 30/9. If Congress does not pass all 12 spending bills, agencies without funding will have to cease operations.
In the absence of important economic information, gold continues to benefit from safe-haven sentiment and fiscal policy uncertainty.
Technical View
The price has broken out and created an ATH, with the 3837 – 3840 zone currently being strong resistance (Fibonacci + market psychology).
The 3770 – 3773 zone is near support, coinciding with the trendline and previous liquidity, suitable for buying.
MACD on H1 shows buying momentum is maintained, but a correction is needed for price balance before breaking higher.
Trading Strategy
Short-term Sell (at resistance):
Entry: 3837 – 3840
SL: 3844
TP: 3830 – 3800 – 3770
Note: This is only a reactive order at resistance, going against the main trend, so manage risk tightly.
Preferred Buy (trend-following):
Entry: 3770 – 3773
SL: 3766
TP: 3784 – 3799 – 3810 – 3838
Conclusion
This week, gold still prioritises the Buy strategy at support zones. The main target is towards 3840, an important resistance zone and a benchmark for trend strength. The Sell order is only short-term at resistance, while the main scenario remains waiting for a correction to buy up.
Follow me for short-term scenario updates during the week, especially as news and US fiscal policy changes can significantly impact gold.

XAUUSD – Will Gold Continue to Print New ATH ?XAUUSD – Will Gold Continue to Print New ATHs?
Hello Traders,
The Asian session today shows that buying interest in gold remains strong. A confirmed break above 3658 would mark a key resistance level and signal that gold could extend its bullish trend further.
Technical Outlook
The Fibonacci 2.618 extension has already produced a reaction, but in my view, liquidity in that area has not been fully absorbed. This leaves room for one more push to complete that liquidity sweep before a corrective move.
As today is Friday, there is also the possibility of a pullback to balance order flow and for the market to close the weekly candle at a lower level.
On the downside, a clear break below 3613 support would confirm a stronger bearish outlook for today’s session.
Trading Strategy
Sell Zone: Around 3688 (Fibonacci 2.618), with a suggested stop-loss of about 6 dollars.
Buy Zone: Around 3558, with a suggested stop-loss of about 8 dollars. This zone could offer potential for a deeper upside move.
Alternative Scenario: If price breaks and closes below 3613, immediate short positions can be considered as bearish momentum takes control.
This is my trading plan for gold today. Use it as a reference and feel free to share your own perspective in the comments.

SEBI Expedites IPO Approvals: A Deep Dive into India’s Capital SEBI Expedites IPO Approvals: A Deep Dive into India’s Capital Market Shift
1. Introduction
The Securities and Exchange Board of India (SEBI) has recently undertaken a significant step—fast-tracking Initial Public Offering (IPO) approvals. Traditionally, IPO approval in India has been a lengthy process, often stretching to six months. But SEBI’s new measures aim to cut this time nearly in half, potentially bringing it down to three months or less.
This shift comes at a time when India’s equity markets are booming, with record levels of fundraising expected in 2025. After raising around $20.5 billion through IPOs in 2024, analysts predict that 2025 could surpass this figure. According to reports, $8.2 billion has already been raised so far in 2025, with an additional $13 billion in IPOs already approved and nearly ₹18.7 billion pending approval.
2. Why SEBI is Expediting IPO Approvals
Several factors are driving SEBI to accelerate the IPO pipeline:
Surging Investor Appetite
Indian retail participation in stock markets has seen an explosion in recent years.
Over 11 crore Demat accounts are active as of 2025, compared to just 3.6 crore in 2019.
More retail investors mean more demand for IPOs, making faster approvals essential.
Global Capital Flows
India is seen as one of the fastest-growing large economies.
With global investors diversifying away from China, India is attracting billions in Foreign Portfolio Investments (FPIs).
A streamlined IPO process will help India capture this liquidity flow before it moves elsewhere.
Boosting Startup Ecosystem
Unicorns like PhysicsWallah, Urban Company, and WeWork India are preparing for listings.
Startups require quicker capital-raising routes to compete globally.
Regulatory Efficiency and AI Adoption
SEBI is now deploying AI-powered document screening tools to check IPO filings.
This reduces human delays and allows faster compliance checks.
Collaboration with merchant bankers and exchanges has also been strengthened.
Record Fundraising Target
SEBI expects India to break the $20B mark again in 2025, possibly setting an all-time record.
Expedited approvals are central to making this happen.
3. How the New Approval System Works
Traditionally, IPO approvals involved multiple manual steps:
Filing of Draft Red Herring Prospectus (DRHP).
SEBI reviews disclosures, company financials, risk factors, and governance.
Queries are raised with the company, leading to back-and-forth communication.
Final approval takes 4–6 months.
Now under the fast-track mechanism:
AI Pre-Screening: Automated checks scan filings for missing data, compliance issues, and inconsistencies.
Concurrent Review: Instead of sequential reviews, SEBI, merchant bankers, and exchanges review documents simultaneously.
Time-Bound Queries: Companies are given strict deadlines to respond to SEBI’s queries.
Standardization: Risk disclosure formats and governance checks are now standardized across sectors.
This is expected to cut approval timelines by 40–50%.
4. IPO Pipeline for 2025
Some big-ticket IPOs in the pipeline include:
PhysicsWallah (₹3,820 crore) – Edtech unicorn expanding into AI-driven education.
Urban Company – Already raised ₹854 crore from anchor investors; IPO opening soon.
LG Electronics India – Large consumer electronics brand targeting India’s growing tech-savvy population.
WeWork India – Despite global challenges, the Indian arm remains profitable and expansion-focused.
Credila Financial Services – Education loan subsidiary of HDFC, a high-demand financial segment.
The SME IPO market is equally hot with listings like Goel Construction debuting at a 15% premium and Prozeal Green Energy getting SEBI approval.
5. Benefits of Faster IPO Approvals
For Companies
Quicker access to capital for expansion.
Ability to capitalize on favorable market sentiment without delays.
Reduced costs of prolonged regulatory processes.
For Investors
More frequent and diverse IPO opportunities.
Increased transparency due to standardized disclosures.
Higher liquidity as more firms enter the public market.
For Indian Markets
Strengthened image of India as an investment hub.
Alignment with global best practices (US SEC and Hong Kong’s IPO process are faster).
Improved global competitiveness for Indian startups.
6. Risks and Challenges
Speed vs. Quality
Faster approvals must not compromise on due diligence.
Weak companies slipping through could hurt investor trust.
Market Saturation
Too many IPOs in a short span could lead to oversupply, reducing listing gains.
Retail Investor Overexposure
Retail investors may flock to IPOs without understanding fundamentals, increasing risk of losses.
Global Volatility
Geopolitical tensions, US interest rate decisions, or oil price shocks can derail IPO plans.
7. Global Context
Globally, IPO markets have been mixed:
US Markets: Tech IPOs are recovering but still face valuation pressure.
China: Tighter regulations have slowed down IPO fundraising.
Middle East: Saudi Arabia and UAE continue to see large IPOs in energy and infrastructure.
In this scenario, India is positioning itself as a global IPO leader, especially in the tech and services sector.
8. Investor Strategy for 2025 IPOs
For investors, the IPO rush creates both opportunities and challenges. Some strategies include:
Focus on Fundamentals
Look for companies with strong financials, governance, and growth potential.
Avoid IPOs driven purely by hype.
Anchor Investor Signals
Strong anchor participation (like Urban Company’s ₹854 Cr funding) signals institutional confidence.
Sector Plays
Edtech, Renewable Energy, Fintech, and Consumer Services are hot sectors.
Traditional sectors like construction and manufacturing are also showing resilience.
Listing Gains vs. Long-Term Holding
Some IPOs (like Goel Construction SME) deliver quick listing pops.
Larger IPOs (like PhysicsWallah, Urban Company) may be better for long-term growth.
9. Case Study: Urban Company IPO
Urban Company is a prime example of SEBI’s faster approval ecosystem.
Filed DRHP earlier in 2025.
Received SEBI approval within 12 weeks.
Raised ₹854 crore from anchors before IPO launch.
Price band set at the higher end, reflecting strong demand.
Market analysts project strong long-term growth given India’s rising demand for home services.
This showcases how SEBI’s new process benefits both issuers and investors.
10. Conclusion
SEBI’s decision to expedite IPO approvals is a game-changer for India’s financial markets. By cutting approval times, using AI-driven compliance, and standardizing processes, SEBI is creating a faster, more transparent, and investor-friendly IPO environment.
With major companies like PhysicsWallah, Urban Company, Neilsoft, and Prozeal entering the market, and regulatory support from SEBI, 2025 is poised to be a record-breaking year for IPO fundraising in India.
However, investors must balance enthusiasm with caution—choosing fundamentally strong IPOs, monitoring global market conditions, and avoiding blind bets driven by hype.
In essence, SEBI’s move reflects India’s ambition to emerge as a global capital-raising hub, connecting domestic growth stories with global capital at unprecedented speed and scale.
Buy, Sell, or Skip? Backtesting Charts with Bar Replay!Using TradingView’s Bar Replay, I break down an old chart and reveal the exact logic behind whether it was a buy, sell, or skip trade. Perfect for traders who want to sharpen entry-decisions with real market context.

XAUUSD – Week 08/09 to 12/09, Focus on CPI & PPIXAUUSD – Week 08/09 to 12/09, Focus on CPI & PPI
Hello Traders,
Gold delivered a strong rally last week, consistently printing new highs on a daily basis. While this is not unusual, it has introduced caution in the market. Investor sentiment continues to lean heavily towards buying gold, underlining its importance as a safe-haven asset.
Fundamental Outlook
In the coming week, the release of US CPI and PPI data will be a key focus. These indicators will provide important insight into the financial health of the US economy and could directly influence the Fed’s decision on a potential rate cut in September.
Technical Perspective
Gold has already broken through the Fibonacci 1.618 level, with the next target aligning around the 2.618 extension near 3687.
Before reaching this zone, a mild correction at FVG (Fair Value Gap) areas cannot be ruled out.
For the long term, the zone around 3467 – 3475 is considered a strong buying region, supported by the confluence of FVG, Dibo, and Volume Profile.
Trading Strategies
Bullish Priority: Long positions remain favored. The 3467–3475 zone offers an attractive entry for longer-term buyers.
Bearish Condition: Short opportunities should only be considered if there is a confirmed reversal structure, with price breaking below 3510 or showing rejection signals near the 2.618 Fibonacci level.
Conclusion
For the upcoming week, gold remains a buy-on-dip market. Traders should closely monitor reactions at key levels, while staying flexible with short-term strategies as intraday updates unfold. Proper risk management remains crucial given the upcoming macroeconomic data releases.
How to Talk to Charts & Paint Price Action | TradingView IndiaStop treating charts like raw data. In this TradingView India tutorial, learn how to talk to charts by drawing levels, zones, and patterns on a blank canvas—transforming price into actionable art. Perfect for beginners and pros looking to visualize market structure and make smarter trades
