Advanced Put Call Ratio (PCR)Slide 1: Introduction to Advanced Put Call Ratio (PCR)
The Put Call Ratio (PCR) is a widely used sentiment indicator in options trading. It measures the volume or open interest of put options relative to call options. Advanced analysis of PCR helps traders gauge market sentiment—whether fear or greed is dominant—and anticipate potential reversals or continuations.
Slide 2: Basic Formula and Types
PCR Formula:
Volume-based PCR = Total Put Volume / Total Call Volume
Open Interest-based PCR = Total Put OI / Total Call OI
Interpretation:
PCR > 1: Bearish sentiment (more puts)
PCR < 1: Bullish sentiment (more calls)
Key Types:
Index PCR – NIFTY, BANKNIFTY PCR
Stock PCR – For individual stocks
Slide 3: Advanced Interpretation of PCR
1. Contrarian Indicator:
Very high PCR (e.g., >1.5): Indicates excess fear, potential reversal upward
Very low PCR (e.g., <0.6): Indicates extreme optimism, potential market correction
2. Trend Confirmation:
Stable rising PCR in uptrend = Confirmed strength
Falling PCR in downtrend = Confirmed weakness
3. Divergence Signal:
If prices rise but PCR also rises → underlying caution (hidden bearishness)
If prices fall but PCR drops → lack of fear (hidden bullishness)
Slide 4: Using PCR with Other Tools
Combine PCR with:
Volume & OI Data – To confirm trader positions
Implied Volatility (IV) – High PCR + high IV = fear-based overreaction
Support/Resistance Levels – Look for breakout confirmations
Technical Indicators – RSI, MACD, VWAP with PCR for enhanced edge
Tecnicalanalysis

Option Trading Master classIntroduction to Investing and Option Trading
Investing and option trading are two pillars of wealth creation and risk management in modern finance. Investing focuses on long-term growth by acquiring assets that appreciate over time, while option trading involves strategic bets on price movements within a defined period using derivative contracts. Together, they offer investors a combination of growth, income, and hedging capabilities.
What is Investing?
Definition:
Investing is the process of allocating money into financial instruments (like stocks, bonds, ETFs, or real estate) with the expectation of generating a return over time.
Key Objectives:
Wealth accumulation
Passive income generation
Capital preservation
Beating inflation
Common Asset Classes:
Equity (Stocks): Ownership in companies
Fixed Income (Bonds): Lending capital to earn interest
Real Estate: Physical properties generating rental income
Mutual Funds/ETFs: Pooled investments
Commodities and Gold: Inflation hedges

Learn institutional Trading Part -5Option Buying vs Selling
Option Buyers
Pay premium
Unlimited profit, limited risk
Need strong directional movement
Option Sellers (Writers)
Receive premium
Limited profit, unlimited risk
Thrive in sideways or range-bound markets
Need deep knowledge of Greeks and risk management
6. Popular Option Trading Strategies
Beginner Strategies
Long Call/Put – Directional trades
Protective Put – Hedge stock losses
Covered Call – Generate income from holdings
Intermediate Strategies
Bull Call Spread – Buy and sell calls of different strikes
Bear Put Spread – Buy and sell puts
Straddle – Buy both call and put at same strike (high volatility)
Strangle – Buy OTM call and put (cheaper than straddle)
Advanced Strategies
Iron Condor – Neutral strategy with 4 legs
Butterfly Spread – Limited risk range strategy
Calendar Spread – Exploiting time decay differences
Ratio Spread – More contracts sold than bought

Master class 9. Introduction to Option Trading
Options are powerful derivative instruments that give buyers the right (not obligation) to buy or sell an underlying asset at a predetermined price within a specific time. They are commonly used for hedging, speculation, and income strategies.
There are two basic types:
Call Options: Right to buy
Put Options: Right to sell
Options derive value from stocks, indices (Nifty, Bank Nifty), commodities, or currencies and are traded on platforms like NSE in India.
2. Key Terminology in Option Trading
Strike Price: Price at which the option can be exercised
Premium: Cost of buying the option
Expiry: Last day the option is valid
Lot Size: Fixed number of underlying units (e.g., 50 for Nifty)
Intrinsic Value: Real value of an option if exercised now
Time Value: Portion of premium linked to time left before expiry
ATM/ITM/OTM: At The Money, In The Money, Out of The Money – defines moneyness of options

Institution Master class Welcome to the Institution Trading Master Class, an advanced educational module crafted for serious traders and investors who want to understand how big institutions trade, move markets, and manage risk at scale. This course blends practical market experience with strategic tools and institutional concepts.
📘 Page 1: Understanding Institutional Trading
🔹 What is Institutional Trading?
Institutional trading refers to market activities performed by large entities like:
Mutual Funds
Pension Funds
Hedge Funds
Insurance Companies
Foreign Institutional Investors (FIIs)

Power of India VixWhy India VIX Matters?
✅ Predicts Market Sentiment: Spikes in VIX often precede sharp market moves.
✅ Option Pricing Insight: High VIX = Expensive Options; Low VIX = Cheaper Options.
✅ Helps Strategy Selection:
High VIX: Favor credit strategies (Iron Condor, Strangle Sell).
Low VIX: Favor debit strategies (Buy Call/Put, Spread Buy).
✅ Risk Management Tool: Helps gauge when to reduce exposure or go aggressive.
Option trading is a financial strategy where traders buy and sell options contracts — financial instruments that derive value from underlying assets like stocks or indices. Each option gives the buyer the right (not obligation) to buy (Call) or sell (Put) at a specified price before expiry.

Advanced Technical Trading Advanced Technical Trading: A Deep Dive
Introduction
Advanced technical trading goes beyond basic chart patterns and indicators. It blends quantitative analysis, risk management, algorithmic methods, and behavioral insights to make data-driven trading decisions. The goal is to create a structured trading framework that adapts to market dynamics with precision.
This guide covers advanced tools, methods, and strategies used by professional traders and hedge funds to navigate complex market conditions.
1. Market Structure Analysis
Understanding market structure is critical for timing entries and exits.
Market Phases: Accumulation → Mark-Up → Distribution → Mark-Down
Order Blocks: Institutional price levels where smart money enters (used in ICT and SMC).
Liquidity Pools: Zones of stop-loss clustering (above highs or below lows).
Break of Structure (BOS): A key signal that trend direction is shifting.
Change of Character (CHOCH): A microstructure shift that signals potential reversals.
Tools:
Volume Profile
VWAP (Volume-Weighted Average Price)
Footprint Charts (for order flow)
2. Multi-Timeframe Analysis (MTFA)
Advanced traders always align multiple timeframes:
HTF (High Time Frame): Weekly/Daily → Defines macro trend
MTF (Mid Time Frame): 4H/1H → Confirms setups
LTF (Low Time Frame): 15min/5min → Execution
Example: Look for a daily demand zone + 4H BOS + 5min bullish CHoCH to confirm long entry.
3. Advanced Indicators & Tools
A. ATR-Based Strategies
Average True Range (ATR): Measures volatility.
Use ATR to set dynamic stop losses and targets.
ATR Channels can be used to gauge overbought/oversold conditions.
B. Ichimoku Cloud
Gives a complete picture: trend, momentum, support/resistance.
Cloud twist (Kumo twist) indicates potential trend reversals.
C. RSI Advanced Usage
RSI Divergence: Price making new highs, RSI not confirming.
RSI Levels: Beyond 80/20—watch for failure swings.
D. Fibonacci Extensions
Combine with Elliott Wave for confluence in target projections.
4. Price Action + Liquidity Concepts
Price action trading at an advanced level involves understanding:
Fair Value Gaps (FVG): Imbalances where price moves aggressively without filling orders.
Liquidity Grabs: Price sweeping a high/low to trigger stop hunts, then reversing.
Mitigation Blocks: Areas where the market re-tests a previous imbalance before continuing.
Use in:
ICT (Inner Circle Trader) methodology
Smart Money Concepts (SMC)
5. Algorithmic & Quantitative Techniques
A. Statistical Edge
Backtest strategies using Python or Excel.
Metrics: Win rate, profit factor, Sharpe ratio, max drawdown.
B. Monte Carlo Simulations
Assess risk and variability in performance.
C. Correlation Analysis
Use tools like rolling correlation between assets (e.g., Nifty 50 vs. Bank Nifty).
6. Volume and Order Flow Trading
Volume tells the story behind price movement:
Footprint Charts: Show actual volume at each price level.
Delta Divergence: Difference between aggressive buyers and sellers.
Volume Clusters: Zones where high volume transactions occurred—often act as support/resistance.
Tools:
Bookmap
Sierra Chart
TradingView + Volume Profile plugins
7. Risk and Trade Management
Advanced trading isn't about always being right—it's about managing risk:
Kelly Criterion: Used to size trades based on edge.
R-Multiple Tracking: Risk-to-reward measurement on every trade.
Position Sizing Models:
Volatility-based sizing (using ATR)
Equity curve-based sizing
8. Strategy Building & Optimization
Build a Rules-Based Strategy
Setup (Entry Criteria): Structure + Indicator confluence
Trigger: Candlestick or microstructure confirmation
Risk Management: Fixed % or volatility-based
Exit Plan: Partial profit-taking, trailing stop, or time-based exit
Optimize Your Edge
Forward test in live but small positions
Maintain a trading journal
9. Psychological Edge
Advanced trading requires emotional discipline:
Avoid Overtrading: High-quality setups only.
Process Over Outcome: Focus on execution, not money.
Meditation and Mindfulness: Helps manage stress and improve decision-making.
Pre/Post-Market Routines: Review trades, plan ahead.
Books like "Trading in the Zone" by Mark Douglas are highly recommended.
10. Specialized Strategies
A. Options Flow Analysis
Track institutional options activity.

Learn Institutional options trading Part-1Tools & Data for Option Traders
Tools to Use:
Option Chain Analysis (NSE Website)
Open Interest Charts (OI Analysis)
IV vs HV Charts (Volatility Tools)
PCR (Put Call Ratio) Indicators
FII/DII Activity Monitoring
TradingView, Sensibull, Opstra, StockMock

Learn Institutional options trading Part-4SEBI Regulations & Reforms
SEBI has made multiple reforms to ensure safe and transparent options trading:
Peak Margin Requirements – Traders must maintain full upfront margin.
Ban List – Illiquid stock options are periodically banned.
Lot Size Revisions – To control leverage and speculation.
Options Chain Transparency – Exchanges provide real-time data.
Investor Education Initiatives – Workshops, certifications, and sandbox testing.
Risks in Options Trading'
Options can generate high rewards, but they carry significant risks, especially if misused without understanding.
Key Risks:
Premium decay
Volatility risk
Leverage risk
Liquidity issues in stock options
Wrong position sizing
SEBI has introduced risk-mitigation measures, such as margin rules and banning of certain contracts for illiquid stocks.

Learn Institutional options trading Part-5Future of Options Trading in India
What Lies Ahead:
More weekly expiries (e.g., MIDCPNIFTY)
Improved retail education
Stricter compliance and reporting
Rise in algo trading and automation
Integration with global exchanges (GIFT City)
With platforms like NSE IFSC, Indian traders may soon get access to international stock derivatives from Indian soil.

Learn Institutional options trading Part-6Psychology & Discipline in Options Trading
Success in options requires:
Defined trading plan
Strict risk-reward ratio
Avoiding revenge trades
Avoiding overtrading on expiry days
Regular review and journaling of trades
Emotional control and discipline are more important than strategy in consistent profitability.

Advance Institutions Option Trading - Lecture 4If you're looking for a simple options trading definition, it goes something like this: Options trading gives you the right or obligation to buy or sell a specific security on or by a specific date at a specific price. An option is a contract that's linked to an underlying asset, such as a stock or another security.
Options trading also involves two parties: the holder (buyer) and the writer (sometimes called the seller). Holders are investors who purchase contracts, while writers create them. The holder pays the writer a premium for the right to sell or buy a stock by a certain date.

$SUI Looks Super Bullish, But There’s a Catch!CRYPTOCAP:SUI Looks Super Bullish, But There’s a Catch!
SUI Network is heating up in this bull market, and yes — it could potentially reach $10… even $15–$20 long-term! 🔥
But here’s something you need to know 👇
🔓 Today, 44M CRYPTOCAP:SUI (~$143M) tokens got unlocked — that’s 1.32% of the circulating supply.
▶️ Only 33.87% of total supply is unlocked — meaning 66.13% is still locked with early investors and the team.
▶️ That’s ~$140M worth of tokens unlocking every month. This could put serious sell pressure on the price!
✅ I'm still bullish long-term, already holding from $0.50–$0.60.
▶️ If CRYPTOCAP:SUI drops to around $2.80, I’ll be buying more.
Short-term dip = Long-term opportunity?
Be smart. Track unlocks. Buy low. Think long.
NFA & DYOR

USD/JPY Long Trade Setup – Key Support Rebound Targeting 148.674Entry Point:
Price: 143.373
The chart suggests initiating a long (buy) position at this level, which is just slightly below the current market price.
Stop Loss:
Price: 141.707
Positioned below a strong support zone. This level protects the trade from excessive downside risk if the price breaks down.
Target Point:
Price: 148.674
The target is clearly defined, indicating a potential gain of approximately 5.991 points, or 4.20% from the entry.
🟪 Support/Resistance Zones
The purple boxes indicate demand (support) and supply (resistance) zones.
The lower zone (entry/stop area) shows a historically significant support range that has been tested multiple times (indicated with orange circles).
The upper purple zone marks the take-profit area, which coincides with previous resistance.
📊 Moving Averages
Blue Line: 200 EMA (Exponential Moving Average) – acting as dynamic resistance.
Red Line: 50 EMA – price is currently trading below it, indicating bearish short-term pressure but potential for reversal.
🧠 Trade Idea Summary
Bias: Bullish (long position)
Risk-Reward Ratio: Favorable
Risk: ~1.67 points (from 143.373 to 141.707)
Reward: ~5.3 points (from 143.373 to 148.674)
Approx. R:R = 1:3.17
Validation: The setup relies on the price holding the key support zone and bouncing higher, targeting the next major resistance.
⚠️ Considerations
Monitor for bullish candlestick patterns near the entry zone.
Keep an eye on macroeconomic news (like BoJ or Fed updates) that could cause volatility in USD/JPY.
Confirm momentum shift with RSI or MACD if using indicators.

BTC/USD Bullish Setup: Double Bottom Breakout Targeting $110,000 Trade Setup Analysis
1. Support & Resistance Zones
Support Zone (Buy Zone):
Highlighted in purple, between $103,764 and $104,633, with a noted stop loss area near $104,061.
Resistance/Target Zone (Take Profit Area):
Around $109,878 – $110,002 labeled as “EA TARGET POINT”.
2. Double Bottom Pattern (Bullish Signal)
There are two orange circles at the bottom, indicating a double bottom pattern—often a bullish reversal signal.
This is supported by a neckline break near the entry point at $104,534.
3. Moving Averages
Two moving averages are displayed:
Likely a short-term MA (red) and a medium/long-term MA (blue).
The price crossing above both suggests bullish momentum.
4. Trade Plan
Entry Point: Around $104,534
Stop Loss: Below $104,061
Take Profit (Target): $109,878 – $110,002
Risk/Reward Ratio: High, given the tight stop and wide target.
📈 Price Projection
The blue arrowed path suggests:
A minor dip or consolidation near $104,534, followed by a strong upward move toward the target zone.
The movement outlines a classic cup-and-handle or double-bottom breakout pattern.
🧠 Conclusion
This is a bullish trading setup for BTC/USD with a favorable risk-reward ratio. The chart suggests:
Buying near $104,534
Stop loss just below support
Targeting a move to ~$110,000

Gold (XAU/USD) Bullish Breakout Trade Setup – Targeting $3,4201. Entry Point Zone (~3,302.88 - 3,317.09):
This is the area where a long position (buy) is suggested.
The price has already moved slightly above this zone, indicating the trade may have already been triggered.
2. Stop Loss (~3,260.41 - 3,299.02):
Positioned below the entry zone to limit downside risk.
Suggests that if the price drops below this support zone, the trade idea is invalidated.
3. Target Point (3,420.41):
A bullish target suggesting a potential upside move of ~117.62 points (or ~3.56%).
This zone acts as a take-profit level.
4. Technical Indicators:
Moving averages (possibly 50 EMA in red and 200 EMA in blue) show a bullish crossover recently, supporting the upward momentum.
5. Pattern Outlook:
The chart implies a possible cup-and-handle or bullish consolidation breakout pattern, anticipating continuation upward.
Summary:
The strategy depicted is a bullish breakout setup:
Buy near 3,302.88–3,317.09
Stop Loss near 3,260–3,299
Take Profit near 3,420
This setup favors buyers as long as the price remains above the stop-loss zone. If the market holds this structure, there's a good risk-reward ratio for a move to 3,420.41.

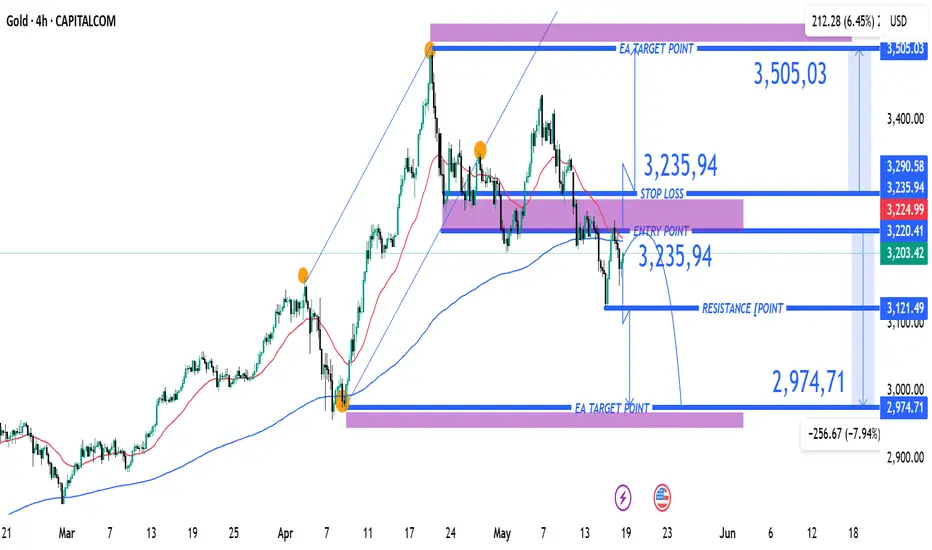
XAUUSD Bearish Setup with Key Entry, Stop Loss & Target LevelEntry Point: $3,235.94
Stop Loss: $3,235.94 (above current price, suggesting a SELL trade)
Target Points:
EA Target Point (Downside): $2,974.71 (Short target)
EA Target Point (Upside): $3,505.03 (Long target — likely alternate scenario)
Resistance Level: $3,121.49
Nearby Support Zone: Around $3,000–$2,975
📉 Trade Strategy Implied
This appears to be a short position setup:
Sell at: ~$3,220–$3,235
Stop Loss: $3,235.94
Take Profit: $2,974.71
Risk/Reward Ratio: ~1:3 (very favorable setup if thesis holds)
The upside target ($3,505.03) might be for a different scenario — if price reverses and breaks above resistance.
🧠 Market Structure Observations
Trend: A bearish break from a previous ascending channel.
Momentum: Price has bounced slightly after hitting support, but the moving averages suggest bearish momentum may persist.
Key Risk: If price breaks above $3,236 convincingly, it could invalidate the short setup and trigger a bullish run.
📌 Summary
Bias: Bearish (based on current setup)
Setup: Short with tight stop above resistance
Confirmation Needed: Watch for rejection at the $3,220–$3,236 zone and a breakdown below $3,200 for follow-through.
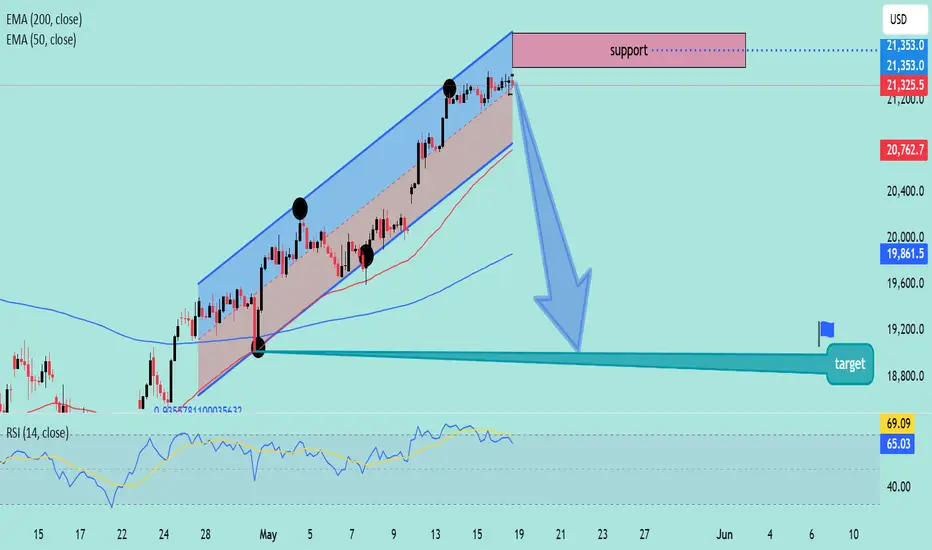
3. Reversal Target: 18,800 USD
1. Price Action
The price has been trending within an ascending channel.
It recently touched the upper boundary of this channel and entered a resistance/support zone (marked in red at the top).
The blue arrow suggests a projected breakdown from the channel.
2. Support & Target
The target zone is marked around 18,800 USD, with a label and flag indicating this as a key level.
This zone is also aligned with a previous consolidation area and possibly strong historical support.
3. Indicators
EMAs:
50 EMA (red line): 20,762.7
200 EMA (blue line): 19,861.5
The price is currently above both EMAs, typically bullish, but divergence from the channel and potential resistance may imply an upcoming correction.
RSI:
Currently at 65.03, nearing overbought territory (70).
The RSI shows a bearish divergence—price makes higher highs while RSI stays flat or dips slightly.
4. Implications
If the price breaks below the channel and 50 EMA, a move toward 200 EMA or the marked target zone (around 18,800 USD) is likely.
Traders may look for confirmation via a break of lower trendline support, a strong red candle, or declining volume before entering short.
USD/JPY Rebounds from Key Support – Eyes on 150.035 Target Support Zone:
The price is currently respecting a strong support area between 144.459 - 145.101. This zone aligns closely with the 200 EMA (145.101), increasing its validity.
EMAs:
50 EMA (146.059) is slightly above the current price.
200 EMA (145.101) is acting as dynamic support.
Price is currently trading just above the 200 EMA and below the 50 EMA — a neutral-to-bullish bias, especially since it bounced off support.
Bullish Signal:
The price has rejected the support zone and is attempting to break higher, supported by the bullish arrow projection.
Target Point:
Clearly marked at 150.035, which is a previous resistance level. This gives a potential upside of around 460 pips from the support area.
🧭 Trade Idea (if bullish bias is maintained)
Entry: Around 145.40–145.10 (current area)
Stop Loss: Below 144.459 (support base)
Take Profit: Around 150.035
Risk-Reward: ~1:3 or higher, depending on exact entry/exit.
⚠️ Caution
Watch for resistance at 146.059 (50 EMA); a clean break and retest would further confirm upside potential.
If price closes below 144.459, bullish invalidation could lead to a deeper correction

EUR/JPY Long Setup – Bullish Reversal from Key Support ZoneEntry Point: 162.227
Stop Loss: 161.629
Take Profit (Target): 166.778
Current Price: ~162.798
Risk/Reward Ratio:
Risk: ~60 pips
Reward: ~455 pips
Risk/Reward ≈ 1:7.6 (strong setup)
🔍 Technical Insights
Support Zone:
The purple rectangle around 162.227 to 162.000 is identified as a key demand zone or support area.
Price has tested this zone previously and appears to be bouncing off it.
Price Structure:
The pattern suggests a potential double-bottom or reversal structure forming.
A rounded recovery projection is drawn, implying bullish momentum is expected.
Moving Averages:
A red (shorter period) moving average is crossing below the price.
A blue (longer period) moving average near the support zone could act as dynamic support.
Target Area:
166.778 marks a clear resistance or prior high and is labeled as the “EA Target Point”.
This is a logical profit-taking zone based on past price action.
✅ Bullish Trade Bias Justification
Strong support reaction near entry.
Favorable risk/reward ratio.
Reversal pattern potential.
Confluence with moving average support.
⚠️ Considerations
Ensure confirmation from a bullish candle or reversal signal before entry.
Be mindful of macroeconomic events or EUR/JPY fundamentals that might impact volatility.

WTI Crude Oil (USOIL) Bullish Pullback Setup – Targeting $66.70Entry Point: Around $62.30 - $62.26
Stop Loss: Set below the entry zone at $61.65, with a potential lower buffer at $60.90
Target Zone (EA TARGET POINT): Between $66.62 and $67.00
A projected gain of 4.22 points (~6.77%)
📈 Price Action & Indicators:
The price had a strong bullish run recently and is now consolidating or pulling back slightly.
The red and blue moving averages (likely short-term and medium-term MAs) show a bullish crossover and trend.
There's a potential bullish setup if the price pulls back to the entry zone and finds support.
The blue curved arrow indicates a projected bounce from the $62.30 support region back up toward the $66.70 target.
🛠️ Strategy Implied:
Wait for pullback to the entry zone (~$62.30).
Enter long at or around that level.
Set Stop Loss at $61.65 to limit downside risk.
Take Profit at $66.70 for a solid risk-reward ratio.
⚠️ Risks:
If support at $62.30 fails, price may head toward $61.65 or lower.
Market volatility (especially with crude oil) can invalidate setups quickly.
Economic events (e.g., U.S. inventory reports, OPEC news) can disrupt technical patterns.

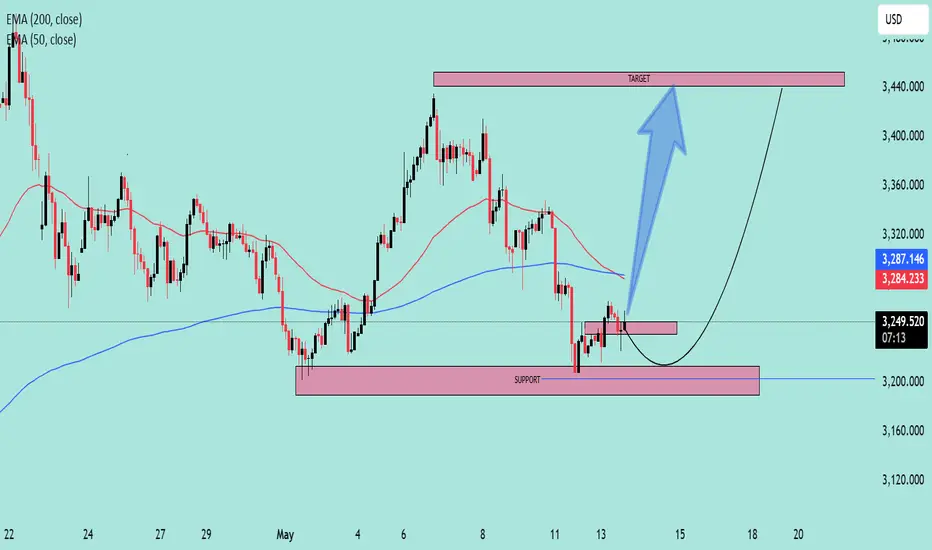
Bullish Reversal Forming at Key Support Zone – Targeting 3,450Instrument: Unspecified (likely XAU/USD or an index, judging by the price range)
Current Price: ~3,250.100
Indicators Used:
EMA 50 (Red): 3,284.255
EMA 200 (Blue): 3,287.152
🟣 Key Zones:
Support Zone: Around 3,200 – a strong demand zone where price previously bounced.
Target Zone: Around 3,450 – the last major resistance and recent high.
📉 Current Price Action:
Price recently tested the support zone and is forming a potential double bottom pattern.
EMAs are above the price, indicating a short-term bearish trend, but the price holding support may suggest a possible reversal.
A bullish trajectory is drawn, projecting a potential rise toward the target zone at 3,450.
📈 Potential Trade Idea (Hypothetical):
Entry: Near current price or on pullback to the small support box (~3,240)
Stop-loss: Below the major support (~3,190)
Take-profit: Around 3,450
⚠️ Key Considerations:
Price needs to break above the EMAs to confirm momentum shift.
Watch for confirmation with bullish candlesticks or volume spike.
Failure to hold the 3,200 support could invalidate this setup.
"BTC/USD Short from 104,855 – Target 93,159. Entry Point
104,855 USD is marked as the entry point (likely for a short position).
The current price is around 103,775 USD, slightly below the entry level.
2. Resistance Zone
Highlighted just below the entry point (~103,000–104,855 USD).
Price is currently testing this zone, possibly indicating a failed breakout or pullback setup.
3. Stop Loss
Placed around 104,807 USD, just above the resistance area, in a shaded purple zone.
Suggests the trade strategy is based on shorting near resistance with a tight stop.
4. Target
EA Target Point is marked at 93,159 USD.
Implies a projected downward move of about −11,264 USD (−10.76%) from entry.
5. Indicators & Tools Used
Moving Averages: 200-period (blue) and a shorter MA (red), showing bullish momentum.
Support/Resistance Zones: Multiple purple rectangles denote demand/supply areas.
Trend Lines: Used to capture recent bullish momentum; a break of the lower line may confirm a trend reversal.
6. Pattern Recognition
Series of lower highs forming after a strong uptrend could suggest bearish divergence or distribution phase.
The price appears to be stalling at the resistance area, aligning with a potential short setup.
🧾 Trade Setup Analysis:
Bias: Bearish (short position).
Entry: 104,855
Stop Loss: 104,807 (tight SL above resistance zone)
Take Profit: 93,159
Risk-Reward Ratio (RRR): Roughly 1:10, which is aggressive and would require high conviction or confirmation
