TERM
INTERNATIONAL CONVEYORS GOING TO HIT AGAIN 75 LEVEL SOONOn the weekly chart, the Share is able to hold a major support level at 60 levels on a closing basis. if he holds it and momentum continues upward as per the chart then it going to test again at 75 levels in the near future.
Short term target is 68 from the current level
Long term target is 75 in 6 to 9 months.
Home work from lesson 2 course 101Hello everybody. This is my homework for a lesson in the Trading View 101 course on 8/25/2021.
It is a technical analysis about long term and short term in the monthly/daily, and their relationship to each other.
All analysis is described in monthly and daily graph, trying to understand the context of monthly to daily and see their relationships. This is an analysis of monthly (long and short) and daily (long and short) trends.
**Look the analysis on the monthly chart and the daily chart.**
**Monthly Chart **
Support at 1065Best stock for Long Term.
OPM - 63%
ROE - 25%
ROCE - 32.4%
ROIC - 27.5%
SALES 3Y - 22%
PROFIT 3Y - 25%
At this point many investors are in panic because of this stock going into ASM list. Any stock goes into ASM list if there is an unusual price action in very short duration of time.
At this moment just have patience. And wait for a reversal.
IRCTC FUNDAMENTAL BETGoI recently announced monetization of 400 railways stations or nearly 152,000 crore of assets. considering this is positive for the stock we can go long in this. immediate support lies on the horizontal support drawn below which is for short term traders. long termers can hold the stock according to their risks. targets are marked on the charts which are for both short term and medium-long term.
Trade setup For IndigoNSE:INDIGO
Watch out Indigo
Keep in watchlist as it has come to a strong trending support levels
Support from any of the levels will lead to a good Up side
It is a Good Quality stock and is at very good valuation and pricing
Investors can accumulate this stock, as we all know Global Pandemic will not last forever and today or tomorrow
Aviation industries would bounce back and we must not miss such good quality stock to buy on dips
Rest Deatils can be Known from the chart
Fantom Buy on retest.FTM/USDT is taking resistance on the Fibonacci Re-tracement level. Also RSI is highest somewhere around 80 and MACD is about to give crossover. Yellow box is the buying zone and can give up to at least 20% in short term. If holding don't exit (buy more on support),if not enter after 4 hr candle closes above in yellow zone.
Fantom Buy on retest.FTM/USDT is taking resistance on the Fibonacci Re-tracement level. Also RSI is highest somewhere around 80 and MACD is about to give crossover. Yellow box is the buying zone and can give up to at least 20% in short term. If holding don't exit (buy more on support),if not enter after 4 hr candle closes above in yellow zone.
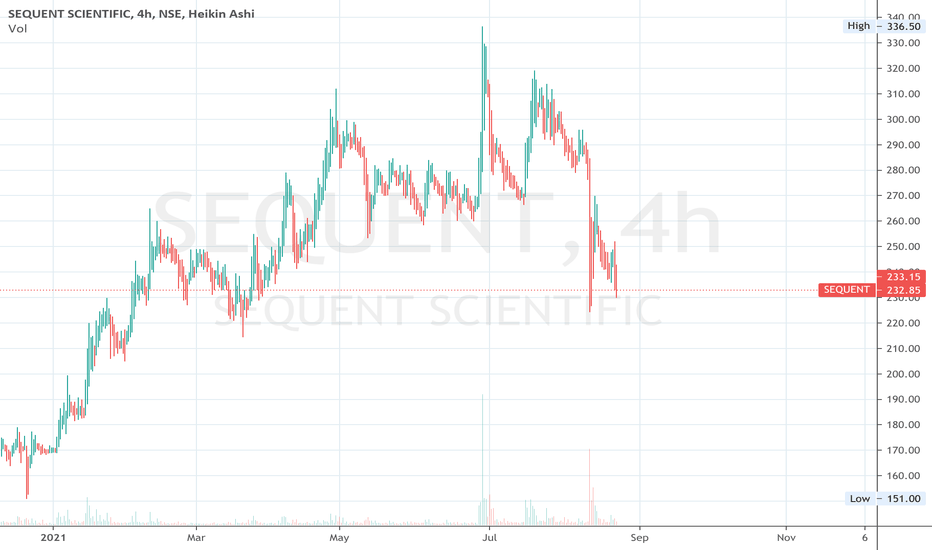
Long Sequent ScientificSequent Scientific
NSE:SEQUENT
Cmp - 232
Stop - Nil, Add more on relevant dips
Expectation -
T1 - 500
T2 - Open, Review at 500
Expected Holding Period - 12 months or earlier for T1
Technicals - ✅
Fundamentals - ✅
View:- Positional/Investment
Disclaimer:-
Ideas being shared only for educational purpose
Please do your own research or consult your financial advisor before investing
Long Greenply IndustriesGreenply Industries
NSE:GREENPLY
Cmp - 172
Stop - Nil, Add more on relevant dips
Expectation -
T1 - 300
T2 - Open, Review at 300
Expected Holding Period - 18 months or earlier for T1
Technicals - ✅
Fundamentals - ✅
View:- Positional/Investment
Disclaimer:-
Ideas being shared only for educational purpose
Please do your own research or consult your financial advisor before investing
Support at 1065Best stock for Long Term.
OPM - 63%
ROE - 25%
ROCE - 32.4%
ROIC - 27.5%
SALES 3Y - 22%
PROFIT 3Y - 25%
At this point many investors are in panic because of this stock going into ASM list. Any stock goes into ASM list if there is an unusual price action in very short duration of time.
At this moment just have patience. And wait for a reversal.
LOOKS TOO GOOD TO ACCUMULATE AT THESE LEVELS!!!This simply looks too good, both, technically and fundamentally as well, the formations are good, stock seems to be retesting the breakout levels and this is considered to be one of the best times to get into any stock, a buy is strongly recommended in the bracket of 1010-1050 with a stop-loss of 980 for higher targets.
Happy Investing :)


