Tesla’s Technical Outlook and Future Possibilities Tesla’s Technical Outlook and Future Possibilities
Tesla’s current price action reflects a phase of consolidation after a strong rally, where traders are carefully observing how the stock reacts near crucial levels.
The stock’s position around $439 indicates indecision between buyers and sellers, as it trades between an important support trendline and a well-defined resistance zone.
This structure typically represents a buildup phase before a major directional move.
The inclined support line has shown consistent strength over the past few months, highlighting steady institutional interest even during market pullbacks.
As long as the price respects this trendline, the overall technical bias remains positive. A bounce from this level could reignite bullish momentum, targeting the higher range of $480 to $490.
A breakout above this ceiling could confirm a continuation of the long-term uptrend, possibly leading to new record highs.
On the contrary, a failure to sustain above the inclined support may shift market sentiment toward short-term weakness.
If selling pressure intensifies, the stock could revisit lower supports around $400 or even the $350 area, which served as the base of the previous breakout.
Such a pullback, however, would not necessarily signal the end of Tesla’s larger bullish cycle — it could instead offer a healthier retracement for long-term investors.
Overall, Tesla’s chart reflects a stock at a turning point. The next move will depend on how it behaves around its support structure and whether it can overcome the heavy resistance overhead.
Traders should stay alert to both technical triggers and fundamental news especially updates from the Chinese market, production data, and macroeconomic factors.
Tesla remains one of the most watched stocks globally, and its upcoming moves are likely to set the tone for broader sentiment in the electric vehicle sector.
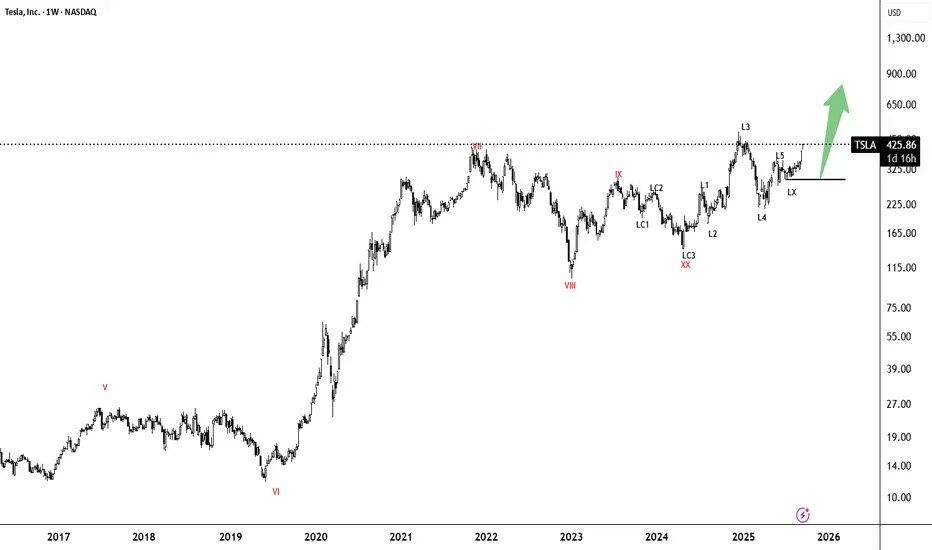
Tesla

TESLA Bullish Wave CyclesHi everyone
Welcome to intelligent investor, we provide market insights by synchronising and combining all the price action waves from different time frames and gives you single trend.
If you see different keyword in charts, here is the meaning and an explaining video will be made in some time how to read and trade with these waves charts. Still if you have any query , you can leave a comment, i will be happy to answer your query.
Keyword Mean-
S- Short Term Trend
M- Medium Term Trend
L- Long Term Trend
I- Super Trend
(I)- Multiyear Trend
1,2,3,4,5 are wave bullish or bearish wave count
SC,MC,LC,AA,(AA)- mean consolidation or correction
X/XX- Like a joint in a trend or consolidation.
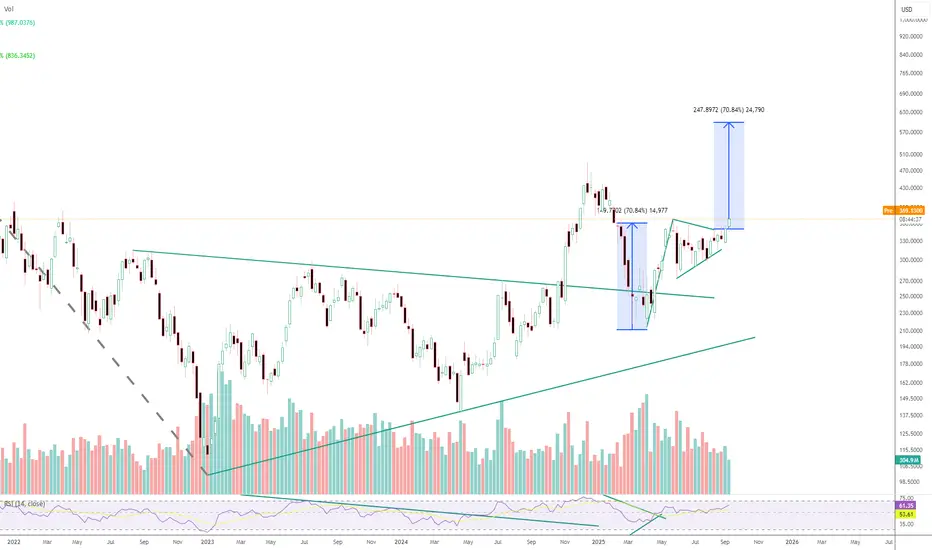
Tesla - Flag & Pennant Pattern BreakoutTesla breaking out of a Flag & Pennant Pattern that may take it to new all time highs
Part 1 Support and ResistanceThe Role of Options in Financial Markets
Options exist because they provide flexibility and risk management tools. Their role includes:
Hedging: Protecting portfolios from adverse price movements (insurance against loss).
Speculation: Betting on price direction with limited capital.
Leverage: Controlling large positions with small investment.
Income Generation: Selling options to earn premium income.
Arbitrage: Exploiting price differences between markets or instruments.
Why Traders Use Options
Options serve different purposes:
Investors: Hedge portfolios (e.g., protective puts).
Traders: Speculate on price moves (buying calls/puts).
Institutions: Manage risk exposure across assets.
Market Makers: Provide liquidity and earn spreads.
Psychology of an Options Trader
Trading is not just numbers, it’s emotions.
Fear and greed drive bad decisions.
Over-leverage leads to blowing up accounts.
Patience and discipline are more important than intelligence.
A successful trader has a trading plan, risk management, and psychological control.

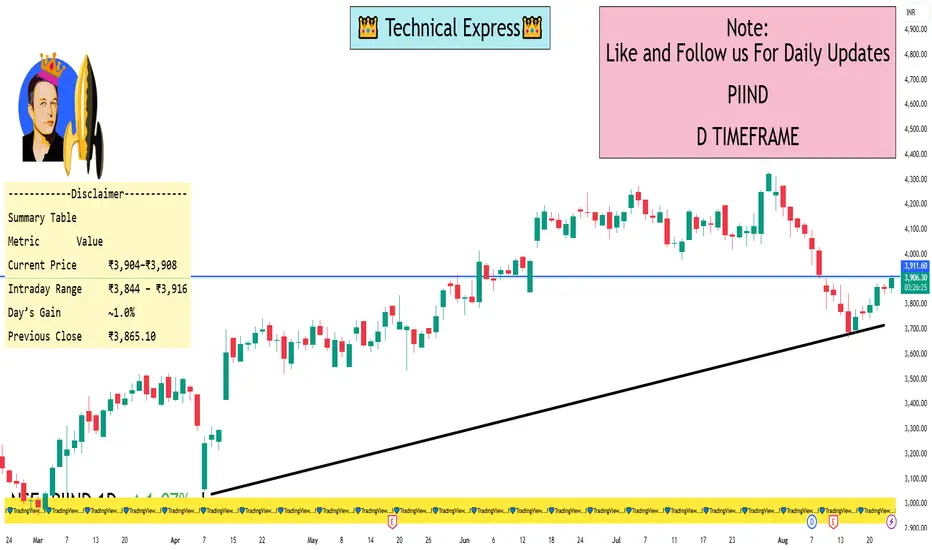
PI Industries 1 Day ViewIntraday Snapshot
Latest Price:
As per Investing.com, the price on August 25, 2025, stood at ₹3,903.80, marking a 1.00% gain for the day
Moneycontrol shows a pre-opening/early trading figure of ₹3,907.70, up roughly 1.10%
Daily Price Range:
Highest: ₹3,915.80
Lowest: ₹3,844.10
Previous Close: ₹3,865.10 on August 22, 2025, meaning today’s gain is from this base
Summary Table
Metric Value
Current Price ₹3,904–₹3,908
Intraday Range ₹3,844 – ₹3,916
Day’s Gain ~1.0%
Previous Close ₹3,865.10
Part 2 Candle Stick Pattern Introduction to Options Trading
In the world of financial markets, traders are always looking for ways to manage risk, generate income, or profit from price movements. Stocks, bonds, and futures are common instruments, but options trading adds a completely new layer of flexibility.
An option is a financial contract that gives the buyer the right, but not the obligation, to buy or sell an underlying asset at a specific price (called the strike price) on or before a certain date (called the expiry date).
Unlike stocks, which represent ownership in a company, options are derivative contracts—their value is derived from the movement of an underlying asset such as Nifty, Bank Nifty, Reliance Industries, Tesla, Gold, Crude Oil, etc.
The beauty of options is that they allow traders to benefit in bullish, bearish, or even sideways markets, depending on the strategy used. That’s why understanding option trading strategies is like learning the different moves in a chess game—you pick the right one for the right situation.
Basics of Options
Before jumping into strategies, let’s revisit some fundamentals:
Call Option: Gives the buyer the right to buy the asset at a specific strike price.
Put Option: Gives the buyer the right to sell the asset at a specific strike price.
Option Premium: The price paid to buy an option.
Strike Price: The price at which the underlying can be bought/sold.
Expiry Date: The last date the option can be exercised.
ITM (In-the-Money): Option has intrinsic value (profitable if exercised).
OTM (Out-of-the-Money): Option has no intrinsic value (not profitable if exercised).
ATM (At-the-Money): Strike price is very close to current market price.
💡 Quick Example:
Nifty is at 22,000. You buy a 22,000 Call Option for ₹200 premium. If Nifty rises to 22,500, your option has value (ITM). If Nifty stays flat or goes down, you may lose the premium.
Now, depending on whether you buy or sell Calls/Puts, you can build hundreds of strategies.

Risk Management in TradingIntroduction
Trading is often seen as the art of predicting market moves, buying low, and selling high. Yet, the most successful traders will tell you that trading is not about prediction, it’s about protection. The markets are uncertain, and no strategy, indicator, or system can guarantee 100% accuracy. What separates consistently profitable traders from losing ones is not just their ability to analyze charts but their skill in managing risk.
Risk management is the backbone of long-term survival in trading. Without it, even the best strategies eventually fail. With it, even an average strategy can deliver consistent returns over time. In this guide, we’ll dive deep into what risk management is, why it matters, and the tools and techniques every trader must master.
Chapter 1: What is Risk in Trading?
Risk in trading refers to the possibility of losing money due to adverse market movements. Every trade carries uncertainty, and risk management is about controlling the size and impact of that uncertainty.
There are different types of risk in trading:
Market Risk (Price Risk):
The chance of prices moving against your trade. For example, buying a stock at ₹100 and it falls to ₹90.
Leverage Risk:
Using borrowed money or margin amplifies both gains and losses. A small price move can wipe out capital if leverage is excessive.
Liquidity Risk:
The inability to exit a position at the desired price due to low trading volume. This happens often in small-cap stocks or thinly traded futures.
Volatility Risk:
Sudden price swings can trigger stop losses or create unexpected losses, especially around news events.
Psychological Risk:
Emotional decisions – fear, greed, revenge trading – often increase losses.
Systemic Risk:
External shocks like economic crises, geopolitical tensions, or pandemics can affect all markets simultaneously.
In simple terms: Risk = Probability of Loss × Magnitude of Loss.
Chapter 2: Why Risk Management is the Core of Trading
Most beginners focus on finding the “perfect strategy.” They try indicators, signals, or tips. But even the most accurate strategies have losing trades.
Consider two traders:
Trader A: Has a 70% winning strategy but risks 20% of capital per trade.
Trader B: Has a 50% winning strategy but risks only 1% of capital per trade.
Who survives longer? Trader B. Why? Because Trader A only needs a short losing streak to blow up his account, while Trader B can survive hundreds of trades.
Risk management ensures three things:
Survival: You live to trade another day.
Consistency: Your equity curve grows steadily without wild drawdowns.
Confidence: Knowing losses are controlled reduces stress and emotions.
In short: Trading without risk management is gambling.
Chapter 3: The Mathematics of Risk
3.1 The Risk of Ruin
Risk of ruin means the probability of losing all your trading capital. If you risk too much per trade, your account may not survive inevitable losing streaks.
Example:
If you risk 20% per trade, a losing streak of just 5 trades wipes out 67% of your account. To recover, you would need a 200% gain!
But if you risk 1% per trade, even 20 consecutive losses only reduce your account by ~18%. That’s survivable.
3.2 Risk-Reward Ratio
The Risk-Reward Ratio (RRR) measures potential reward compared to risk.
If you risk ₹100 to make ₹200, your RRR is 1:2.
A higher RRR allows profitability even with a low win rate.
For example:
At 1:2 RRR, you need only 34% win rate to break even.
At 1:3 RRR, just 25% win rate keeps you profitable.
3.3 Position Sizing Formula
A popular formula is:
Position Size = (Account Size × Risk per Trade) ÷ Stop Loss (in points/value)
Example:
Account Size = ₹1,00,000
Risk per Trade = 1% = ₹1,000
Stop Loss = ₹10 per share
Position Size = 1000 ÷ 10 = 100 shares
This ensures you never lose more than ₹1,000 in that trade.
Chapter 4: Tools of Risk Management
4.1 Stop Loss
A stop-loss order closes your trade automatically at a pre-defined price to limit losses. Types:
Hard Stop: Fixed exit point.
Trailing Stop: Moves with price to lock profits.
4.2 Take Profit
Opposite of stop-loss – locks in gains at a target level.
4.3 Diversification
Never put all capital into one trade or one asset. Spread risk across instruments, sectors, or strategies.
4.4 Hedging
Using options, futures, or correlated assets to reduce risk. Example: Buying Nifty futures and buying a protective put option.
4.5 Risk per Trade Rule
Most professional traders risk 0.5% to 2% of capital per trade. This balance allows growth while protecting against drawdowns.
4.6 Daily Loss Limit
Set a maximum daily loss (e.g., 3% of account). If hit, stop trading for the day. This prevents emotional revenge trades.
Chapter 5: Psychological Aspects of Risk
Risk management is not just technical; it’s psychological. Many traders fail because of:
Overconfidence: After wins, increasing position size too aggressively.
Fear: Cutting winners too early or avoiding valid trades.
Greed: Holding losers, hoping they’ll turn profitable.
Revenge Trading: Trying to recover losses quickly, leading to bigger losses.
Good risk management enforces discipline. You follow rules, not emotions.
Chapter 6: Advanced Risk Management Strategies
6.1 Kelly Criterion
A mathematical formula to optimize bet size based on edge and win probability.
Formula: f = (bp – q) / b*
Where:
f = fraction of capital to risk
b = odds (reward/risk)
p = probability of win
q = probability of loss
Although powerful, many traders use a fraction of Kelly (half-Kelly) to reduce volatility.
6.2 Value at Risk (VaR)
Common in institutional trading. It estimates the maximum expected loss over a given period at a certain confidence level (e.g., 95%).
6.3 Volatility-Based Position Sizing
Adjust position size according to market volatility. If volatility is high, trade smaller; if low, trade larger.
6.4 Portfolio Risk Management
Beyond individual trades, manage total portfolio risk. For example:
Limit exposure to correlated trades (e.g., don’t go long on multiple IT stocks at once).
Set maximum portfolio drawdown (e.g., 10%).
Chapter 7: Real-Life Examples
Example 1: The Trader Without Risk Management
Rahul has ₹1,00,000. He risks ₹20,000 per trade. After just 5 consecutive losses, his account drops to ₹33,000. To recover, he now needs +200% returns. Emotionally shattered, Rahul quits trading.
Example 2: The Disciplined Trader
Priya also starts with ₹1,00,000. She risks 1% per trade = ₹1,000. After 5 losses, she still has ₹95,000. She survives, learns, improves her strategy, and grows steadily.
Moral: Survival > Prediction.
Chapter 8: Building a Personal Risk Management Plan
Every trader must design a plan tailored to their style. Key components:
Capital Allocation: How much capital to trade vs. keep in reserve.
Risk per Trade: Set a percentage (1–2%).
Stop Loss Rules: Fixed or ATR (Average True Range) based.
Position Sizing Method: Use formula or volatility-based sizing.
Diversification Rules: Limit exposure per sector/asset.
Daily & Weekly Loss Limits: Stop trading after exceeding them.
Review & Adaptation: Analyze performance monthly and adjust.
Chapter 9: Common Mistakes Traders Make
Trading without stop losses.
Risking too much on one trade.
Averaging down losing trades.
Ignoring correlation between trades.
Trading during high-impact news without preparation.
Not tracking risk metrics (drawdown, expectancy, RRR).
Chapter 10: Risk Management for Different Trading Styles
Day Traders: Must be strict with intraday stop losses and daily limits.
Swing Traders: Should focus on overnight gap risk and diversify across positions.
Long-Term Investors: Must manage concentration risk and rebalance portfolios.
Options Traders: Need to monitor Greeks (Delta, Gamma, Vega) for exposure.
Conclusion
Risk management is the invisible hand that shapes trading success. While strategies may change, markets may evolve, and tools may improve, the principle remains timeless: Control risk, and profits will take care of themselves.
Every trader faces uncertainty, but those who respect risk survive and thrive. Without risk management, trading becomes a casino. With it, trading becomes a business.
Part 1 Ride The Big MovesIntroduction to Options Trading
In the world of financial markets, options trading is considered one of the most powerful and flexible forms of trading. Unlike simple stock buying and selling, options allow traders to control larger positions with less capital, hedge their risks, and design strategies that fit different market conditions — bullish, bearish, or even sideways.
An option is essentially a contract that gives the buyer the right, but not the obligation, to buy or sell an asset at a specific price (called the strike price) within a given period of time.
If you buy an option, you are purchasing a right.
If you sell (or write) an option, you are giving someone else that right and taking on an obligation.
Options are traded on stocks, indexes (like Nifty 50 or Bank Nifty in India), commodities, currencies, and even cryptocurrencies in some global markets.
They are widely used by:
Investors to hedge portfolios.
Speculators to make money from price moves.
Institutions to manage large exposures.

Option Trading 1. Introduction – What are Options?
Imagine you want to buy a house, but you are not fully sure. The seller says:
“You can pay me ₹1 lakh today as a token, and within the next 3 months you have the right (not obligation) to buy this house for ₹50 lakh. If you don’t buy, I will keep your ₹1 lakh.”
👉 That token money is exactly like an option premium.
If house prices shoot up to ₹60 lakh, you can buy it at ₹50 lakh (huge profit).
If prices fall to ₹40 lakh, you don’t buy, and you only lose ₹1 lakh.
This is the essence of options trading:
Right but not obligation to buy/sell at a fixed price within a fixed time.
Limited loss (premium paid).
Unlimited potential profit.
In stock markets, instead of houses, you deal with shares, indexes, or commodities.
2. How Options Work
Options are part of the derivatives market (value is derived from something else).
Underlying asset: Could be NIFTY, Bank NIFTY, Reliance stock, Gold, etc.
Strike price: Pre-decided price at which you may buy/sell.
Expiry: Fixed date (weekly/monthly).
Premium: Price you pay to buy the option.
Options are of two main types:
Call Option (CE) → Right to buy at a fixed price.
Put Option (PE) → Right to sell at a fixed price.

Part 2 Support And ResistanceWhy Trade Options?
Leverage – You control large positions with small capital (premium).
Hedging – Protect portfolio from losses. (Insurance-like function).
Speculation – Bet on price movement (up, down, or sideways).
Income Generation – By selling options (collecting premiums).
Example in Real Life
Suppose you think Nifty (index) will go up:
Instead of buying Nifty futures (which needs big margin),
You buy a Nifty Call Option by paying just a small premium.
If Nifty rises, your profit multiplies due to leverage.
If Nifty falls, your maximum loss is only the premium paid.
In simple words: Options = flexibility + leverage + risk control.
They are widely used by retail traders, institutions, and hedgers across the world.

Narrative-Based TradingIntroduction
Financial markets are often portrayed as mathematical and data-driven—filled with algorithms, technical charts, and economic models. But beneath that seemingly rational layer lies something deeply human: stories. Investors, traders, and even institutions make decisions not just on numbers but also on narratives—coherent stories that explain why markets move, why a company has potential, or why a sector is “the next big thing.”
This is the essence of Narrative-Based Trading (NBT). Instead of relying only on earnings, charts, or interest rates, traders also weigh the power of collective belief shaped through stories. Whether it’s the “AI boom,” “India growth supercycle,” “EV disruption,” or “crypto revolution,” narratives influence flows of capital.
Robert Shiller, the Nobel laureate economist, introduced the concept of Narrative Economics, where he argued that viral stories influence markets as much as fundamentals do. Traders who understand and anticipate these narratives can position themselves ahead of the crowd.
What Is Narrative-Based Trading?
Narrative-Based Trading is the strategy of identifying, interpreting, and trading financial assets based on dominant market stories that shape investor psychology.
In other words:
Markets move not only on facts but also on the stories built around those facts.
Traders who can read and ride these narratives can capture big moves.
For example:
The dot-com bubble (1999–2000) was not just about internet adoption—it was about the story that “the internet will change everything.”
The crypto boom (2017 & 2020–21) was not just about blockchain—it was about the story of “decentralized money replacing banks.”
The EV rally (2020–22) was not just about electric cars—it was about the story of “the end of fossil fuels.”
Narratives can push valuations beyond fundamentals because humans are wired to respond emotionally to stories more than to raw numbers.
The Psychology Behind Narrative-Based Trading
1. Humans Think in Stories
Cognitive science shows our brains are wired to understand information in the form of narratives. We remember stories far more easily than spreadsheets.
For instance:
Saying “AI will take over jobs and revolutionize industries” excites emotions more than “AI companies’ CAGR is 14%.”
That emotional excitement fuels buying pressure.
2. Fear of Missing Out (FOMO)
Narratives spread like memes. Once everyone believes “EV is the future,” investors don’t want to miss the ride. This collective enthusiasm drives prices higher—even when fundamentals lag.
3. Confirmation Bias
Investors seek stories that confirm their beliefs. If you believe India is the “next growth superpower,” you’ll look for and invest in stocks that support that story.
4. Social Proof
When big investors, influencers, or media outlets endorse a narrative, others follow—just like viral trends on social media.
Key Elements of a Market Narrative
Every powerful narrative usually contains:
A Vision of the Future – e.g., “AI will redefine industries.”
A Villain or Obstacle – e.g., “Traditional banks are outdated; DeFi will replace them.”
A Hero or Winner – e.g., “Tesla will dominate EV markets.”
An Emotional Hook – e.g., “Clean energy will save the planet.”
Simplicity – Narratives spread when they’re easy to explain.
When a story has all these elements, it spreads fast and influences prices.
Historical Examples of Narrative-Driven Markets
1. Dot-Com Bubble (1999–2000)
Narrative: “The internet will revolutionize business.”
Reality: True, but early. Many companies had no earnings, only websites.
Outcome: Nasdaq rose 400% in 5 years, then crashed 78%.
2. Bitcoin & Crypto (2017, 2020–21)
Narrative: “Decentralized money will free us from central banks.”
Reality: Blockchain has utility, but valuations were inflated by hype.
Outcome: Bitcoin rose from $1,000 → $20,000 (2017), then crashed, later reaching $69,000 in 2021.
3. Tesla & EV Mania (2019–2022)
Narrative: “The end of oil, EVs will dominate.”
Reality: EV adoption is growing, but valuations became extreme.
Outcome: Tesla’s stock went from ~$40 in 2019 → $1200 in 2021 before correcting.
4. India Growth Supercycle (2023–2025)
Narrative: “India is the next China.”
Reality: India has demographics, reforms, and digital adoption.
Outcome: Indian indices outperformed, with foreign investors pouring in.
Identifying Narratives Early
The challenge for traders is spotting a narrative before it goes mainstream. Some tools and signals include:
Media Monitoring – Watch financial news, trending topics, and CEO statements.
Social Media Sentiment – Platforms like X (Twitter), Reddit, StockTwits, YouTube often amplify narratives before mainstream media catches on.
Google Trends – Rising searches for “AI stocks” or “EV companies” show growing interest.
Options & Volume Flow – Spikes in call buying often signal retail narrative adoption.
Venture Capital Activity – If VCs are pouring billions into a sector, the narrative is building.
How to Trade Narratives
1. Early Adoption Phase
Narrative is in niche circles (forums, VC blogs).
Stocks are undervalued, only a few believers.
Strategy: Enter early, accumulate, low risk high reward.
2. Mainstream Adoption Phase
Media picks it up, retail floods in.
Stocks rally sharply.
Strategy: Ride the trend, but manage risk.
3. Euphoria Phase
Everyone is talking about it.
Valuations detach from fundamentals.
Strategy: Take profits, prepare for exit.
4. Collapse / Reality Check
Narrative cracks when fundamentals can’t keep up.
Price correction or bubble burst.
Strategy: Avoid fresh buys, short opportunities possible.
Tools and Techniques for Narrative-Based Traders
Narrative Mapping
Write down the story driving the asset.
Identify the hero (leading company/stock), villains (competitors), and catalysts (events).
Volume Profile & Market Structure
Check if the narrative is supported by actual participation.
High volume spikes = narrative adoption.
Event Tracking
Government policies, product launches, speeches, or geopolitical events can fuel narratives.
Cross-Asset Analysis
Narratives often spill over.
Example: AI narrative lifted not just Nvidia, but also cloud, chipmakers, and robotics.
Exit Framework
Always define conditions when narrative breaks.
Example: If government policy reverses, or adoption slows, exit quickly.
Risks of Narrative-Based Trading
Hype vs Reality Gap
Narratives often run far ahead of fundamentals.
Risk: Holding too long into a bubble burst.
Confirmation Bias
Traders may ignore evidence against the story.
Overcrowding
Once everyone is in, upside is limited.
Policy & Regulation
Narratives like crypto or EV subsidies depend heavily on policy support.
Short Narrative Lifespan
Some stories burn out quickly (e.g., “Metaverse” hype in 2021).
Case Study: The AI Narrative (2023–2025)
Early Stage (2022): ChatGPT launch → small AI startups gained attention.
Adoption (2023): Nvidia earnings blowout, AI “arms race” headlines.
Mainstream (2024–2025): AI became part of every investor deck.
Euphoria Signs: Even non-AI firms rebranded themselves as “AI-driven.”
Trading Strategy:
Early buyers of Nvidia, AMD, Microsoft captured 200–400% gains.
By late 2024, caution needed as valuations stretched.
Narrative vs Fundamentals vs Technicals
Fundamentals – Show “what should happen” based on earnings, cash flows.
Technicals – Show “what is happening” in price & volume.
Narratives – Show “what people believe will happen.”
The best traders combine all three:
Use narratives for trend identification.
Use technicals for timing entries/exits.
Use fundamentals for long-term conviction.
Building a Narrative-Based Trading Strategy
Scan Narratives (media, VC, policy, social buzz).
Validate with Data (Google trends, volume, institutional flows).
Select Leaders (stocks most associated with narrative).
Define Entry Point (technical confirmation).
Scale with Trend (add as narrative strengthens).
Exit with Rules (valuation excess, fading news, policy reversal).
The Future of Narrative-Based Trading
AI Tools will help detect emerging narratives via sentiment analysis.
Retail Power (Reddit, Telegram, Twitter) will keep driving viral trades.
Geopolitical Narratives (e.g., “China vs US tech war”) will grow stronger.
Sustainability & ESG Narratives (“Green transition,” “India digitalization”) will dominate long-term.
Narrative-based trading will not replace fundamentals but will remain a critical layer of market psychology.
Conclusion
Narrative-Based Trading reminds us that markets are not just numbers—they are stories we tell ourselves about the future. The most powerful stories spread, shape collective belief, and move billions of dollars.
For traders, the key is not blindly following hype but understanding when a story is gaining traction, when it’s peaking, and when reality is about to check it.
If you can learn to read market narratives like a storyteller, you can trade not just with charts and balance sheets—but with the heartbeat of the market itself.
Long-Term Position TradingIntroduction
In the world of financial markets, traders and investors often debate between short-term opportunities and long-term wealth-building strategies. One of the most reliable and time-tested methods for wealth creation is long-term position trading. Unlike day trading or swing trading that rely on short-term price movements, long-term position trading is about identifying strong trends, quality assets, and holding positions for months or even years.
This strategy is closer to investing but still falls within the discipline of trading because it involves market timing, entry/exit strategies, risk management, and portfolio adjustments. Long-term position traders often aim to ride big moves, benefit from compounding, and avoid the stress of daily market noise.
In this guide, we’ll break down long-term position trading in detail—covering its philosophy, strategies, tools, pros & cons, and practical approaches to mastering it in the Indian and global markets.
Chapter 1: What is Long-Term Position Trading?
Long-term position trading is a trading approach where positions are held for extended periods—usually six months to several years—to benefit from large market trends.
Key features:
Time Horizon: Longer than swing trading (days/weeks), shorter than buy-and-hold investing (decades).
Objective: Capture major price trends (secular uptrends, super cycles, sectoral booms).
Approach: Fundamental and technical analysis combined to filter strong assets.
Risk Appetite: Medium to high, since market volatility must be tolerated.
In simple terms: A position trader says, “Instead of fighting intraday noise, I’ll enter into a fundamentally strong stock or asset during accumulation phases, and hold it through the bigger move until the trend matures.”
Chapter 2: Why Long-Term Position Trading Works
Trend Follower Advantage
Markets move in cycles: accumulation → uptrend → distribution → downtrend.
Long-term position traders focus on catching the uptrend phase that can deliver 100%–500% returns.
Less Noise, More Clarity
Daily fluctuations, news-driven volatility, and short squeezes matter less.
Weekly/monthly charts filter out the noise and highlight the real trend.
Compounding Effect
Holding quality stocks allows dividends + capital appreciation to compound over time.
Psychological Relief
No constant monitoring like intraday traders.
Stress-free decision-making with focus on big picture.
Alignment with India’s Growth Story
For Indian traders, position trading aligns with the India Growth Supercycle—rising middle class, infrastructure push, financialization, and technology adoption.
Chapter 3: Difference Between Position Trading and Other Strategies
Feature Intraday Trading Swing Trading Long-Term Position Trading Investing
Time Horizon Minutes/Hours Days/Weeks Months/Years 5–20+ Years
Focus Volatility Short Swings Major Trends Business Growth
Analysis Used Technical Technical Both (Fundamental + Technical) Fundamental
Stress Level Very High Moderate Low-Moderate Very Low
Return Style Small but frequent Medium Large but fewer Large, steady
Capital Requirement High Margin Medium Medium-High Any
Chapter 4: Foundations of Long-Term Position Trading
1. Fundamental Analysis
Position traders give importance to fundamentals because weak companies rarely sustain long-term rallies. Some factors:
Revenue Growth (10–20% CAGR stocks outperform).
Profit Margins (expanding margins are bullish).
Debt Levels (low-debt, high cash-flow firms are stable).
Moats (brand, patents, market leadership).
Macro Tailwinds (sectors aligned with government policies, global demand).
Example: In India, IT services (Infosys, TCS), FMCG (HUL), banking (HDFC Bank), and pharma (Sun Pharma) have rewarded long-term position traders massively.
2. Technical Analysis
Even long-term players need technicals to time entries. Tools include:
Moving Averages (50, 200 DMA crossovers for long-term trend).
Volume Profile (identifies accumulation/distribution zones).
Support & Resistance (monthly/weekly zones matter most).
Breakouts (multi-year consolidation breakouts often lead to huge rallies).
3. Macro & Sectoral Analysis
Long-term traders follow sectoral rotation. Capital flows from one sector to another, and identifying the next booming sector is critical. Example:
2003–2008: Infra & Real Estate Boom.
2010–2014: Pharma Rally.
2014–2019: NBFC & Banking Growth.
2020–2023: IT, Specialty Chemicals, PSU Banks.
Chapter 5: Tools & Indicators for Position Traders
Weekly & Monthly Charts – To identify primary trends.
Fibonacci Retracements – Entry zones after corrections in long-term uptrend.
Relative Strength Index (RSI) – To avoid overbought long entries.
MACD on Weekly – Trend confirmation.
Volume Profile – Shows institutional accumulation zones.
Fundamental Screeners – Tools like Screener.in, Tickertape, Trendlyne for Indian stocks.
Chapter 6: Step-by-Step Process of Long-Term Position Trading
Step 1: Market Outlook
Study global and Indian macro trends.
Identify strong themes: EV, renewable energy, banking digitization, infrastructure, AI.
Step 2: Stock Selection
Filter fundamentally strong companies.
Look for leaders in high-growth sectors.
Step 3: Technical Entry
Wait for breakout above multi-year resistance.
Confirm with volume surge.
Step 4: Position Sizing
Invest gradually (SIP mode into position trades).
Allocate 10–20% per stock in portfolio.
Step 5: Holding Discipline
Avoid reacting to minor news.
Focus on quarterly results and sectoral momentum.
Step 6: Exit Strategy
Sell when trend weakens (break below 200 DMA, falling growth).
Book profits in stages during euphoric rallies.
Chapter 7: Psychology of Long-Term Position Trading
Patience is Everything: Multi-year rallies test your patience.
Control Over News-Driven Fear: Ignore daily market noise.
Conviction in Research: Confidence comes from solid analysis.
Avoid Overtrading: Stick to your selected few winners.
Chapter 8: Risk Management
Even long-term traders need strict risk management:
Stop-Loss (Mental/Trailing): Place it below major support.
Diversification: Don’t put all in one sector.
Portfolio Review: Quarterly recheck.
Avoid Leverage: Margin positions don’t suit long-term holding.
Exit During Structural Shifts: If sector fundamentals collapse (e.g., telecom price wars killed many stocks).
Chapter 9: Real Examples of Position Trading
Indian Market
Infosys (1995–2020): ₹100 → ₹15,000+ (split-adjusted).
HDFC Bank: A long-term compounding machine with consistent growth.
PSU Banks: From 2020 lows to 2023, gave 300–400% returns as a sectoral play.
Global Market
Apple: From $1 in early 2000s to $200+.
Tesla: From $17 IPO to $1200 peak before split.
Amazon: One of the greatest position trades in history.
Chapter 10: Pros & Cons of Long-Term Position Trading
Pros
Stress-free compared to intraday.
Big reward potential.
Aligned with economic cycles.
Better for working professionals.
Cons
Requires patience.
Drawdowns can be painful (20–40%).
Needs deep research (time-consuming).
Black Swan events (COVID, global crisis) can hit hard.
Conclusion
Long-term position trading is not just about buying and holding. It’s about selecting the right stocks, entering at the right time, and having the patience to sit through volatility until the big trend matures. It’s a strategy that bridges the gap between short-term trading and investing, offering both the thrill of trading and the wealth-building potential of investing.
For Indian markets, with the growth supercycle unfolding, long-term position trading can be one of the most rewarding approaches for the next decade. The key lies in discipline, patience, and the courage to ride trends while ignoring short-term noise.
Part 1 Master Candle PatternIntroduction to Options Trading
Options trading has become one of the fastest-growing segments of the Indian financial market. Once considered a playground only for institutions and advanced traders, options are now widely accessible to retail investors thanks to online trading platforms, mobile apps, and reduced brokerage costs.
In India, the NSE (National Stock Exchange) is the world’s largest derivatives exchange in terms of contracts traded, with Bank Nifty and Nifty 50 options leading the charge. For retail traders, options present opportunities for hedging, speculation, and income generation, making them versatile instruments.
But options are also complex. Unlike stocks, where you directly own a piece of a company, options are derivative contracts—their value depends on the price of an underlying asset. This makes them both powerful and risky if not understood properly.
What are Options?
An option is a financial contract that gives the buyer the right, but not the obligation, to buy or sell an underlying asset at a predetermined price (strike price) before or on a specific date (expiry).
Call Option → Right to buy an asset at a strike price.
Put Option → Right to sell an asset at a strike price.
Unlike futures contracts, option buyers are not obligated to execute the trade. They can choose to let the option expire worthless if the trade doesn’t go their way.

Part 3 Trading Master Class With Experts Non-Directional Strategies
Used when you expect low or high volatility but no clear trend.
Straddle
When to Use: Expecting big move either way.
Setup: Buy call + Buy put (same strike, same expiry).
Risk: High premium cost.
Reward: Large if price moves sharply.
Strangle
When to Use: Expect big move but want lower cost.
Setup: Buy OTM call + Buy OTM put.
Risk: Lower premium but needs bigger move to profit.
Iron Condor
When to Use: Expect sideways movement.
Setup: Sell OTM call + Buy higher OTM call, Sell OTM put + Buy lower OTM put.
Risk: Limited.
Reward: Premium income.
Butterfly Spread
When to Use: Expect price to stay near a target.
Setup: Combination of long and short calls/puts to profit from low volatility.

Intraday Scalping & Momentum Trading1. Introduction
In the high-speed world of financial markets, two strategies stand out for traders who thrive on quick decisions and rapid results: Intraday Scalping and Momentum Trading.
While both are short-term trading styles, they differ in execution speed, trade duration, and the logic behind entries and exits.
Intraday Scalping focuses on capturing tiny price movements — sometimes just a few points — multiple times throughout the trading session.
Momentum Trading aims to ride significant price moves caused by strong buying or selling pressure, often holding positions for minutes to hours until the trend exhausts.
In both strategies:
Speed is critical.
Precision is non-negotiable.
Discipline is the backbone.
2. The Core Concepts
2.1 Intraday Scalping
Scalping is like market sniping — taking small, precise shots. The goal is not to hit a home run but to consistently hit singles that add up.
Key traits:
Very short holding times (seconds to a few minutes).
Multiple trades per day (5–50+ depending on style).
Targets are small (0.1%–0.5% price move per trade).
Relies on high liquidity and tight bid-ask spreads.
Example:
Stock XYZ is trading at ₹100.25/₹100.30.
Scalper buys at ₹100.30.
Price ticks up to ₹100.40 in 30 seconds.
Exit at ₹100.40 — profit of ₹0.10 per share.
Tools used:
Level 2 order book (market depth).
Time & sales tape.
Tick charts (1-min, 15-sec).
Volume profile for micro-trends.
2.2 Momentum Trading
Momentum trading is like surfing a wave. Once a strong move starts (due to news, earnings, sector activity, or breakout), momentum traders jump in to ride the surge until it slows.
Key traits:
Holding time is longer than scalping (minutes to hours).
Focus on directional moves with high relative volume.
Larger price targets (0.5%–3% or more per trade).
Relies on trend continuation until exhaustion.
Example:
Stock ABC breaks resistance at ₹250 on high volume after earnings.
Trader buys at ₹252 expecting further upside.
Price runs to ₹260 before showing weakness.
Exit at ₹259 — profit of ₹7 per share.
Tools used:
1-min to 15-min charts.
Moving averages for trend confirmation.
Relative Volume (RVOL) scanners.
Momentum oscillators like RSI, MACD.
3. Scalping vs Momentum — Quick Comparison
Feature Scalping Momentum Trading
Trade Duration Seconds to few minutes Minutes to hours
Profit Target 0.1%–0.5% 0.5%–3%+
Risk per Trade Very small Small to medium
Frequency High (10–50 trades/day) Moderate (2–10 trades/day)
Chart Timeframes Tick, 15s, 1m 1m, 5m, 15m
Market Conditions High liquidity, volatile Trending, news-driven
Mindset Ultra-fast decisions Patient within trend
4. Market Conditions Suitable for Each
Scalping Works Best When:
Market is choppy but liquid.
Bid-ask spread is tight.
Price moves in micro-waves.
There is high intraday volatility without a clear trend.
Momentum Works Best When:
Market has strong trend days.
There’s a news catalyst or earnings.
Breakouts/breakdowns occur with volume surge.
A sector rotation drives capital into specific stocks.
5. Technical Tools & Indicators
For Scalping
VWAP (Volume Weighted Average Price) – Used as a magnet for price action; scalpers fade moves away from VWAP or trade rejections.
EMA 9 & EMA 20 – For micro-trend direction.
Order Flow Analysis – Reading the tape to identify big orders.
Bollinger Bands (1-min) – Spotting overextensions.
Volume Profile – Identifying intraday support/resistance.
For Momentum
Moving Averages (EMA 20, EMA 50) – Identify trend continuation.
MACD – Confirm momentum strength.
RSI (5 or 14 period) – Spotting overbought/oversold within a trend.
Breakout Levels – Pre-marked resistance/support zones.
Relative Volume (RVOL) – Ensures trade is supported by unusual buying/selling pressure.
6. Strategies
6.1 Scalping Strategies
A) VWAP Bounce Scalping
Wait for price to pull back to VWAP after a quick move.
Enter on rejection candles.
Exit after a small bounce.
B) Breakout Scalping
Identify micro-breakouts from 1-min consolidation.
Enter just before the breakout.
Exit within seconds once target is hit.
C) Market Maker Following
Watch for large limit orders on Level 2.
Follow their buying/selling pressure.
Exit when big order disappears.
6.2 Momentum Strategies
A) News Catalyst Plays
Scan for stocks with fresh positive/negative news.
Wait for first pullback after breakout.
Ride until momentum slows.
B) Trend Continuation
Identify stock above VWAP and moving averages.
Enter on EMA 9/EMA 20 bounce.
Exit when price closes below EMA 20.
C) High Relative Volume Breakouts
Use RVOL > 2.0 filter.
Enter when volume spikes confirm breakout.
Place stop-loss just under breakout level.
7. Risk Management
Both scalping and momentum trading require tight stop-losses because small moves against you can quickly turn into bigger losses.
For Scalping:
Stop-loss: 0.1%–0.3%.
Risk per trade: ≤ 0.5% of account.
Don’t average down — cut losses immediately.
For Momentum:
Stop-loss: 0.5%–1.5%.
Risk per trade: ≤ 1% of account.
Trail stops to lock in profits.
General Rules:
Use position sizing: Risk Amount ÷ Stop Size = Position Size.
Always account for slippage.
Never risk more than you can afford to lose in a single day.
8. Trading Psychology
For Scalpers:
Stay hyper-focused. Avoid hesitation. The moment you second-guess, the trade is gone. Mental fatigue sets in quickly — take breaks.
For Momentum Traders:
Patience is key. Don’t exit too early from fear or greed. Stick to the plan and avoid chasing after missed moves.
Mind Traps to Avoid:
Overtrading.
Revenge trading after a loss.
Ignoring stop-loss because “it might bounce back.”
Letting small losses turn into big ones.
9. Examples of a Trading Day
Scalping Example
9:20 AM: Identify stock XYZ near pre-market resistance.
9:25 AM: Scalper enters on small pullback.
9:26 AM: Price moves 0.15% up — exit instantly.
Repeat 12–15 times, ending with 8 wins, 4 losses.
Momentum Example
9:25 AM: News drops on ABC Ltd.
9:30 AM: Stock gaps up 3%, breaks resistance with volume.
Buy at ₹252, hold for 20 minutes as it climbs to ₹259.
Exit when volume declines and price closes under EMA 20.
10. Common Mistakes
Scalping:
Entering in low-volume stocks → big slippage.
Over-leveraging.
Trading during low volatility periods.
Momentum:
Chasing moves without pullback.
Ignoring broader market trend.
Overstaying in trade after momentum fades.
11. Advanced Tips
Use hotkeys to speed up entries and exits.
Trade during high liquidity hours (first and last 90 minutes of market).
Combine pre-market analysis with real-time setups.
Keep a trading journal to refine entries/exits.
12. Conclusion
Intraday Scalping and Momentum Trading are high-performance trading styles that can generate consistent profits for skilled traders — but they’re not for the faint-hearted.
They require:
Quick decision-making.
Iron discipline.
Solid risk management.
Technical precision.
The golden rule is: protect your capital first, profits will follow.
Support and ResistancePsychological Factors
Options trading is mentally challenging:
Overconfidence after a win can cause big losses.
Patience is key — many setups fail if entered too early.
Emotional control matters more than strategy.
Pro Tips for Successful Options Trading
Master 2-3 strategies before trying complex ones.
Use paper trading to practice.
Keep an eye on Option Chain data — OI buildup can hint at support/resistance.
Avoid holding long options to expiry unless sure — time decay will hurt.
Final Thoughts
Options trading is like a Swiss Army knife — powerful but dangerous if misused. With the right strategy, discipline, and risk management, traders can profit in any market condition. Whether you’re buying a simple call or building a complex Iron Condor, always remember: the market rewards preparation and patience.

Part11 Trading Master ClassOption Chain Key Terms
Let’s go deep into each term one by one.
Strike Price
The predetermined price at which you can buy (Call) or sell (Put) the underlying asset if you exercise the option.
Every expiry has multiple strike prices — some above the current market price, some below.
Example:
If NIFTY is at 19,500:
19,500 Strike → ATM (At The Money)
19,600 Strike → OTM (Out of The Money) Call, ITM (In The Money) Put
19,400 Strike → ITM Call, OTM Put
Expiry Date
The last trading day for the option. After this date, the contract expires worthless if not exercised.
In India:
Index options (like NIFTY, BANKNIFTY) → Weekly expiries + Monthly expiries
Stock options → Monthly expiries
Call Option (CE)
Gives you the right (not obligation) to buy the underlying at the strike price.
Traders buy calls when they expect the price to rise.
Put Option (PE)
Gives you the right (not obligation) to sell the underlying at the strike price.
Traders buy puts when they expect the price to fall.

Options Trading Strategies 1. Introduction to Options Trading
Options are like a financial “contract” that gives you rights but not obligations.
When you buy an option, you are buying the right to buy or sell an asset at a specific price before a certain date.
They’re mainly used in stocks, commodities, indexes, and currencies.
Two main types of options:
Call Option – Right to buy an asset at a set price.
Put Option – Right to sell an asset at a set price.
Key terms:
Strike Price – The price at which you can buy/sell the asset.
Expiration Date – The last day you can use the option.
Premium – Price paid to buy the option.
In the Money (ITM) – Option has intrinsic value.
Out of the Money (OTM) – Option has no intrinsic value yet.
At the Money (ATM) – Strike price equals current market price.
Options give traders flexibility, leverage, and hedging power. But with great power comes great “margin calls” if you misuse them.
2. Why Traders Use Options
Options aren’t just for speculation — they have multiple uses:
Speculation – Betting on price moves.
Hedging – Protecting an existing investment from loss.
Income Generation – Selling options for premium income.
Risk Management – Limiting losses through defined-risk trades.
3. Basic Options Strategies (Beginner Level)
3.1 Buying Calls
When to Use: You expect the price to go up.
How It Works: You buy a call option to lock in a lower purchase price.
Risk: Limited to the premium paid.
Reward: Unlimited upside.
Example: Stock at ₹100, buy a call at ₹105 strike for ₹3 premium. If stock rises to ₹120, your profit = ₹12 – ₹3 = ₹9 per share.
3.2 Buying Puts
When to Use: You expect the price to go down.
How It Works: You buy a put option to sell at a higher price later.
Risk: Limited to the premium.
Reward: Significant (but capped at the strike price minus premium).
Example: Stock at ₹100, buy a put at ₹95 for ₹2 premium. If stock drops to ₹80, profit = ₹15 – ₹2 = ₹13.
3.3 Covered Call
When to Use: You own the stock but expect it to stay flat or slightly rise.
How It Works: Sell a call option against your owned stock to collect premium.
Risk: You must sell the stock if price exceeds strike.
Reward: Stock appreciation + premium income.
Example: Own stock at ₹100, sell call at ₹105 for ₹2. If stock stays below ₹105, you keep the ₹2.
3.4 Protective Put
When to Use: You own a stock and want downside protection.
How It Works: Buy a put to protect against price drops.
Risk: Premium cost.
Reward: Security against big losses.
Example: Own stock at ₹100, buy put at ₹95 for ₹2. Even if stock crashes to ₹50, you can still sell at ₹95.
4. Intermediate Options Strategies
4.1 Bull Call Spread
When to Use: Expect moderate price rise.
How It Works: Buy a call at a lower strike, sell a call at higher strike.
Risk: Limited to net premium paid.
Reward: Limited to strike difference minus premium.
Example: Buy call at ₹100 (₹5), sell call at ₹110 (₹2). Net cost ₹3. Max profit ₹7.
4.2 Bear Put Spread
When to Use: Expect moderate decline.
How It Works: Buy put at higher strike, sell put at lower strike.
Risk: Limited to net premium paid.
Reward: Limited but cheaper than buying a single put.
Example: Buy put ₹105 (₹6), sell put ₹95 (₹3). Net cost ₹3. Max profit ₹7.
4.3 Straddle
When to Use: Expect big move but unsure direction.
How It Works: Buy call and put at same strike & expiry.
Risk: High premium cost.
Reward: Big if price moves sharply up or down.
Example: Stock at ₹100, buy call ₹100 (₹4) and put ₹100 (₹4). Cost ₹8. Needs a big move to profit.
4.4 Strangle
When to Use: Expect big move but want cheaper entry than straddle.
How It Works: Buy OTM call and put.
Risk: Cheaper than straddle but needs larger move.
Example: Stock at ₹100, buy call ₹105 (₹3) and put ₹95 (₹3). Cost ₹6.
4.5 Iron Condor
When to Use: Expect low volatility.
How It Works: Sell an OTM call spread + sell an OTM put spread.
Risk: Limited by spread width.
Reward: Limited to premium collected.
Example: Stock at ₹100, sell call ₹110, buy call ₹115; sell put ₹90, buy put ₹85.
5. Advanced Options Strategies
5.1 Butterfly Spread
When to Use: Expect stock to stay near a specific price.
How It Works: Buy 1 ITM option, sell 2 ATM options, buy 1 OTM option.
Risk: Limited.
Reward: Highest if stock ends at middle strike.
Example: Stock ₹100, buy call ₹95, sell 2 calls ₹100, buy call ₹105.
5.2 Calendar Spread
When to Use: Expect low short-term volatility but possible long-term move.
How It Works: Sell short-term option, buy long-term option at same strike.
Risk: Limited to net premium.
Reward: Comes from time decay of short option.
5.3 Ratio Spread
When to Use: Expect limited move in one direction.
How It Works: Buy 1 option, sell multiple options at different strikes.
Risk: Unlimited on one side if not hedged.
5.4 Diagonal Spread
When to Use: Expect gradual move over time.
How It Works: Buy long-term option at one strike, sell short-term option at different strike.
6. Risk Management in Options
Even though options can limit loss, traders often misuse them and blow accounts.
Key risk tips:
Never risk more than 2–3% of capital on one trade.
Understand implied volatility — high IV inflates premiums.
Avoid selling naked options without sufficient margin.
Always set stop-loss rules.
7. Understanding Greeks (The DNA of Options Pricing)
Delta – How much the option price changes per ₹1 move in stock.
Gamma – How fast delta changes.
Theta – Time decay rate.
Vega – Sensitivity to volatility changes.
Rho – Interest rate sensitivity.
Mastering the Greeks means you understand why your option is moving, not just that it’s moving.
8. Common Mistakes to Avoid
Holding OTM options too close to expiry hoping for a miracle.
Selling naked calls without understanding unlimited risk.
Over-leveraging with too many contracts.
Ignoring commissions and slippage.
Not adjusting positions when market changes.
9. Practical Tips for Success
Backtest strategies on historical data.
Start with paper trading before using real money.
Track your trades in a journal.
Combine technical analysis with options knowledge.
Trade liquid options with tight bid-ask spreads.
10. Final Thoughts
Options are like a Swiss Army knife in trading — versatile, powerful, and potentially dangerous if misused. The right strategy depends on:
Market view (up, down, sideways, volatile, stable)
Risk tolerance
Timeframe
Experience level
By starting with basic strategies like covered calls or protective puts, then moving into spreads, straddles, and condors, you can build a strong foundation. With practice, risk management, and discipline, options trading can be a valuable tool in your investment journey.
Smart Liquidity1. Introduction to Smart Liquidity
In the world of financial markets — whether traditional stock exchanges, forex markets, or the rapidly evolving world of decentralized finance (DeFi) — liquidity is a crucial concept. Liquidity simply refers to how easily an asset can be bought or sold without causing a significant impact on its price. Without adequate liquidity, markets become inefficient, volatile, and prone to manipulation.
Smart Liquidity, however, is not just liquidity in the conventional sense. It represents an evolution in how liquidity is managed, deployed, and utilized using advanced strategies, technology, and algorithms. It combines market microstructure theory, institutional trading practices, and algorithmic liquidity provisioning with real-time intelligence about market participants' behavior.
In the trading world, “smart liquidity” can refer to:
Institutional trading systems that detect where big players are placing orders and adapt execution strategies accordingly.
Smart order routing that seeks the best execution price across multiple venues.
Liquidity pools in DeFi that dynamically adjust incentives, fees, and token allocations to maintain efficient trading conditions.
Smart money concepts in price action trading, where traders look for liquidity zones (stop-loss clusters, order blocks) to anticipate institutional moves.
Essentially, smart liquidity is about identifying, accessing, and optimizing liquidity intelligently — not just relying on what’s available at face value.
2. The Evolution of Liquidity and the Rise of "Smart" Systems
To understand Smart Liquidity, we need to see where it came from:
Stage 1: Traditional Liquidity
In early stock and commodity markets, liquidity came from human market makers standing on a trading floor.
Orders were matched manually, with spreads (difference between bid and ask) providing profits for liquidity providers.
Large trades could easily move markets due to limited depth.
Stage 2: Electronic Liquidity
Electronic trading platforms and ECNs (Electronic Communication Networks) emerged in the 1990s.
Automated order matching allowed for faster execution, reduced spreads, and global access.
Liquidity started being measured by order book depth and trade volume.
Stage 3: Algorithmic & Smart Liquidity
With algorithmic trading in the 2000s, liquidity became a programmable resource.
Smart order routing systems appeared — scanning multiple exchanges, finding the best price, splitting orders across venues to minimize slippage.
High-frequency traders began exploiting micro-second inefficiencies in liquidity distribution.
Stage 4: DeFi and Blockchain Liquidity
The launch of Uniswap in 2018 introduced Automated Market Makers (AMMs) — smart contracts that provide constant liquidity without order books.
“Smart liquidity” in DeFi meant dynamic pool balancing, cross-chain liquidity aggregation, and automated yield optimization.
3. Core Principles of Smart Liquidity
Regardless of whether it’s in traditional finance (TradFi) or decentralized finance (DeFi), smart liquidity relies on three pillars:
a) Liquidity Intelligence
Identifying where liquidity resides — in limit order books, dark pools, or DeFi pools.
Recognizing liquidity pockets — price zones where many orders are clustered.
Using real-time analytics to adapt execution.
b) Liquidity Optimization
Deciding how much liquidity to tap without creating excessive slippage.
In DeFi, this might mean adjusting pool ratios or routing trades via multiple pools.
In TradFi, it involves breaking large orders into smaller pieces and executing over time.
c) Adaptive Liquidity Provision
Proactively supplying liquidity when markets are imbalanced to earn incentives.
In DeFi, this involves providing assets to liquidity pools and earning fees.
In market-making, it means adjusting bid-ask spreads based on volatility.
4. Smart Liquidity in Traditional Finance (TradFi)
In stock, forex, and futures markets, smart liquidity is often linked to institutional-grade execution systems.
Key Mechanisms:
Smart Order Routing (SOR)
Monitors multiple trading venues in real time.
Routes portions of an order to where the best liquidity and prices exist.
Example: A bank buying 10M shares might split the order into dozens of smaller trades across NYSE, NASDAQ, and dark pools.
Liquidity Seeking Algorithms
Designed to detect where large orders are hiding.
They “ping” the market with small trades to reveal liquidity.
Often used in dark pools to minimize market impact.
Iceberg Orders
Large orders hidden behind smaller visible ones.
Helps avoid revealing full trading intent.
VWAP/TWAP Execution
VWAP (Volume Weighted Average Price) spreads execution over a time frame.
TWAP (Time Weighted Average Price) executes evenly over time.
Example in Action:
If a hedge fund wants to buy 1 million shares of a stock without pushing up the price:
Smart liquidity algorithms might send 2,000–5,000 share orders every few seconds.
Orders are routed to venues with low spreads and high liquidity.
Some orders might go to dark pools to avoid public visibility.
5. Smart Liquidity in DeFi (Decentralized Finance)
In DeFi, “smart liquidity” often refers to dynamic, automated liquidity provisioning using blockchain technology.
Key Components:
Automated Market Makers (AMMs)
Smart contracts replace traditional order books.
Prices are set algorithmically using formulas like x × y = k (Uniswap model).
Smart liquidity adjusts incentives for liquidity providers (LPs) to keep pools balanced.
Liquidity Aggregators
Protocols like 1inch, Matcha, Paraswap scan multiple AMMs for the best rates.
Splits trades across multiple pools for optimal execution.
Dynamic Fee Adjustments
Platforms like Curve Finance adjust trading fees based on volatility and pool balance.
Impermanent Loss Mitigation
Smart liquidity protocols use hedging strategies to reduce LP losses.
Cross-Chain Liquidity
Bridges and protocols enable liquidity flow between blockchains.
6. Smart Liquidity Concepts in Price Action Trading
In Smart Money Concepts (SMC) — a form of advanced price action analysis — “liquidity” refers to clusters of stop-loss orders and pending orders that can be targeted by large players.
How It Works:
Liquidity Zones: Price areas where many traders have stop-loss orders (above swing highs, below swing lows).
Liquidity Grabs: Institutions push price into these zones to trigger stops, collecting liquidity for their own positions.
Order Blocks: Consolidation areas where large orders were placed, often becoming liquidity magnets.
7. Benefits of Smart Liquidity
Better Execution
Reduces slippage and improves fill prices.
Market Efficiency
Balances order flow across venues.
Accessibility
DeFi smart liquidity allows anyone to be a liquidity provider.
Risk Management
Algorithms can avoid volatile, illiquid conditions.
Profit Potential
Market makers and LPs earn fees.
8. Risks and Challenges
In TradFi
Information Leakage: Poorly executed algorithms can reveal trading intent.
Latency Arbitrage: High-frequency traders exploit small delays.
In DeFi
Impermanent Loss for LPs.
Smart Contract Risk (hacks, bugs).
Liquidity Fragmentation across multiple blockchains.
For Retail Traders
Misunderstanding liquidity zones can lead to stop-outs.
Algorithms are often controlled by institutions, making it hard for small traders to compete.
9. Real-World Examples
TradFi Example: Goldman Sachs’ Sigma X dark pool using smart order routing to match institutional buyers and sellers.
DeFi Example: Uniswap v3’s concentrated liquidity, letting LPs choose specific price ranges to deploy capital efficiently.
SMC Example: A forex trader spotting liquidity above a recent high, predicting a stop hunt before price reverses.
10. The Future of Smart Liquidity
AI-Powered Liquidity Routing: Machine learning models predicting where liquidity will emerge.
On-Chain Order Books: Combining centralized exchange depth with decentralized transparency.
Cross-Chain Smart Liquidity Networks: Seamless asset swaps across multiple blockchains.
Regulatory Clarity: More standardized rules for liquidity provision in crypto and TradFi.
11. Conclusion
Smart Liquidity is not just about having a lot of liquidity — it’s about using it wisely.
In traditional finance, it means algorithmically accessing and managing liquidity across multiple venues without tipping your hand.
In DeFi, it’s about automated, dynamic, and permissionless liquidity provisioning that adapts to market conditions.
In price action trading, it’s about understanding where liquidity lies on the chart and how big players use it.
In short:
Smart Liquidity = Intelligent liquidity discovery + efficient liquidity usage + adaptive liquidity provision.
It’s a fusion of market microstructure knowledge, advanced algorithms, and behavioral finance — making it one of the most powerful concepts in modern trading.

Zero-Day Options Trading 1. Introduction
In recent years, one segment of the options market has gone from a niche tool for sophisticated traders to one of the hottest topics in global finance — Zero-Day-to-Expiration (0DTE) options. These contracts are bought and sold on the same day they expire, creating ultra-short-term opportunities for traders who want to profit from intraday price swings.
Unlike traditional options, where you might have days, weeks, or months until expiration, 0DTE options give you mere hours or even minutes to make your move.
Think of it like speed chess versus a long tournament game — fast, intense, and unforgiving.
2. What Are 0DTE Options?
2.1 Definition
A Zero-Day Option is an option contract that expires on the same trading day you buy or sell it. It can be:
Call option – gives the right to buy the underlying asset at a set price before the market closes.
Put option – gives the right to sell the underlying asset at a set price before the market closes.
Once the closing bell rings, the contract either:
Expires worthless (if out-of-the-money), or
Is settled for intrinsic value (if in-the-money).
2.2 Where They Trade
0DTE options are most common in:
Index options – S&P 500 (SPX), Nasdaq-100 (NDX), Russell 2000 (RUT)
ETF options – SPY (S&P 500 ETF), QQQ (Nasdaq ETF), IWM (Russell ETF)
Single stock options – on earnings days, when volatility is high.
The SPX index options have daily expirations — meaning every day is potentially a 0DTE day.
3. Why 0DTE Has Exploded in Popularity
3.1 More Expiration Dates
Until recently, most options expired monthly or weekly. Exchanges introduced daily expirations in SPX, then in other major indexes, giving traders constant opportunities.
3.2 Intraday Volatility
Markets have become more headline-driven. Inflation numbers, Fed announcements, or geopolitical events can move indexes significantly within hours — perfect for 0DTE traders.
3.3 Low Capital Requirement
Since 0DTE options have almost no time value, they are cheap to buy (sometimes under $1 per contract), making them attractive for small traders.
3.4 High Leverage Potential
A small intraday move in the index can turn a $50 position into $500 within minutes — but the reverse is also true.
4. How 0DTE Options Work – The Mechanics
4.1 The Time Decay Factor
The biggest difference between 0DTE and normal options is Theta decay.
Theta measures how fast an option loses value with time. In 0DTE, time decay isn’t a slow leak — it’s a freefall.
Example:
SPX is at 4500 at 10:00 AM.
You buy a 4510 call for $3.00.
By 3:00 PM, if SPX is still at 4500, that call is worth zero.
4.2 Greeks in 0DTE
Delta – Measures how much the option price changes with a $1 move in the underlying.
In 0DTE, Delta can shift rapidly from 0.1 to 0.9 in minutes.
Gamma – Measures how fast Delta changes. Gamma is highest on expiration day, making 0DTE explosive.
Theta – Extremely high in 0DTE. The clock is your biggest enemy if you’re a buyer.
Vega – Low in absolute terms (since time is short), but implied volatility changes can still swing prices.
4.3 Settlement
Index options (SPX) are cash-settled — no shares change hands, you just get the difference in cash.
ETF & stock options are physically settled — you might end up buying or selling shares if you don’t close the position.
5. Who Trades 0DTE Options
Day Traders – Use them for quick speculative bets.
Scalpers – Aim for tiny, rapid profits.
Institutional Hedgers – Adjust market exposure for a single day.
Algorithmic Traders – Exploit micro-movements using high-frequency models.
Income Traders – Sell premium in 0DTE options to profit from rapid decay.
6. Key Strategies for 0DTE Trading
6.1 Buying Calls or Puts (Directional Bet)
When to Use: Expect a big move in one direction (Fed announcement, CPI release).
Example: Buy SPY 0DTE 440 Call for $1.50. If SPY jumps to 443, it might be worth $3–$5.
Pros: High reward potential.
Cons: Time decay kills you fast if wrong.
6.2 Vertical Spreads
Buy one option and sell another at a different strike, same expiry.
Purpose: Lower cost, limit risk.
Example: Buy SPX 4500 Call, Sell SPX 4510 Call.
6.3 Iron Condors
Sell both a call spread and a put spread far from current price.
Purpose: Profit from market staying in a range.
Advantage: Time decay works for you.
Risk: Big loss if market breaks out sharply.
6.4 Credit Spreads
Sell options near the money and buy protection further away.
Many traders sell 0DTE credit spreads for high win rates (but lower profit per trade).
6.5 Straddles & Strangles
Buy both calls and puts to bet on big volatility without picking direction.
Great for days with scheduled news events.
6.6 Scalping Premium
Sell expensive options early in the day, buy back cheaper later as time decay kicks in.
7. Risks of 0DTE Options
7.1 Total Loss Probability
If buying, it’s common for 0DTE options to expire worthless.
7.2 High Emotional Stress
Minutes can mean thousands gained or lost — not ideal for undisciplined traders.
7.3 Liquidity & Spreads
Bid-ask spreads can be wide, especially in less popular strikes.
7.4 Gamma Risk for Sellers
If you sell near-the-money options, a sudden move can cause large losses quickly.
8. Risk Management in 0DTE Trading
Position Sizing – Risk a small % of account per trade.
Pre-defined Stop Loss – Use mental or hard stops.
Take Partial Profits – Scale out when gains come fast.
Avoid Revenge Trading – Losses are part of the game.
Avoid Holding to Close – Volatility near the close can be chaotic.
9. Example Trade Walkthrough
Let’s say it’s Wednesday, 10:00 AM and SPX is at 4500.
You expect the market to rally after the Fed announcement at 2:00 PM.
You buy the SPX 4510 Call (0DTE) for $2.50.
2:15 PM: SPX jumps to 4525 — your option is worth $15.
You sell for a 500% gain.
If instead SPX had stayed at 4500, by 4:00 PM that option would be worth $0.
10. Impact of 0DTE on the Market
10.1 Increased Intraday Volatility
Large option hedging flows can push markets around.
10.2 Dealer Positioning
Dealers selling options must hedge rapidly (gamma hedging), which can amplify moves.
10.3 “Crash Insurance”
Institutions can quickly hedge portfolios without buying long-term options.
Conclusion
0DTE options are the Formula 1 racing of trading — fast, high-stakes, and not for everyone. For those with discipline, strategy, and risk control, they can be a powerful tool. For the unprepared, they can be a rapid drain on capital.
They reward precision and timing more than any other options strategy. If you step into the 0DTE arena, do so with respect for the speed and risk involved.

Part1 Ride The Big MovesTypes of Option Traders
1. Speculators
They aim to profit from market direction using options. Their goal is capital gain.
2. Hedgers
They use options to protect investments from unfavorable price movements.
3. Income Traders
They sell options to earn premium income.
Option Trading Strategies
1. Basic Strategies
A. Buying Calls (Bullish)
Used when you expect the stock to rise.
B. Buying Puts (Bearish)
Used when expecting a stock to fall.
C. Covered Call (Neutral to Bullish)
Own the stock and sell a call option. Earn premium while holding the stock.
D. Protective Put (Insurance)
Own the stock and buy a put option to limit losses.

Part2 Ride The Big MovesIntroduction to Options Trading
Options trading is one of the most powerful tools in financial markets. Unlike traditional stock trading, where you buy and sell shares directly, options give you the right but not the obligation to buy or sell an asset at a predetermined price before a specific date. This flexibility allows traders to hedge risks, generate income, and speculate on price movements with limited capital.
In recent years, options trading has seen a surge in popularity, especially among retail investors. With the growth of online trading platforms and educational resources, more traders are exploring this complex yet rewarding field.
What Is an Option?
An option is a financial derivative contract. It derives its value from an underlying asset—commonly a stock, index, ETF, or commodity.
There are two types of options:
Call Option: Gives the holder the right to buy the asset at a fixed price (strike price) before or on the expiry date.
Put Option: Gives the holder the right to sell the asset at a fixed price before or on the expiry date.
Key Terms to Know:
Strike Price: The price at which the option can be exercised.
Premium: The price paid to purchase the option.
Expiration Date: The last date on which the option can be exercised.
Underlying Asset: The financial instrument (like a stock) the option is based on.
In the Money (ITM): When exercising the option would be profitable.
Out of the Money (OTM): When exercising the option would not be profitable.
At the Money (ATM): When the strike price is equal to the market price.

Part3 Institutuonal Trading Categories of Options Strategies
Directional Strategies – Profit from a clear bullish or bearish bias.
Neutral Strategies – Profit from time decay or volatility drops.
Volatility-Based Strategies – Profit from big moves or volatility increases.
Hedging Strategies – Reduce risk on existing positions.
Directional Strategies
Bullish Strategies
These make money when the underlying price rises.
Long Call
Setup: Buy 1 Call
When to Use: Expect sharp upside.
Risk: Limited to premium paid.
Reward: Unlimited.
Example: Nifty at 22,000, buy 22,200 Call for ₹150. If Nifty rises to 22,500, option might be worth ₹300+, doubling your investment.
Bull Call Spread
Setup: Buy 1 ITM/ATM Call + Sell 1 higher strike Call.
Purpose: Lower cost vs. long call.
Risk: Limited to net premium paid.
Reward: Limited to difference between strikes minus premium.
Example: Buy 22,000 Call for ₹200, Sell 22,500 Call for ₹80 → Net cost ₹120. Max profit ₹380 (if Nifty at or above 22,500).
Bull Put Spread (Credit Spread)
Setup: Sell 1 higher strike Put + Buy 1 lower strike Put.
Purpose: Earn premium in bullish to neutral markets.
Risk: Limited to spread width minus premium.
Example: Sell 22,000 Put ₹200, Buy 21,800 Put ₹100 → Credit ₹100.
