Part3 Institutuonal Trading Categories of Options Strategies
Directional Strategies – Profit from a clear bullish or bearish bias.
Neutral Strategies – Profit from time decay or volatility drops.
Volatility-Based Strategies – Profit from big moves or volatility increases.
Hedging Strategies – Reduce risk on existing positions.
Directional Strategies
Bullish Strategies
These make money when the underlying price rises.
Long Call
Setup: Buy 1 Call
When to Use: Expect sharp upside.
Risk: Limited to premium paid.
Reward: Unlimited.
Example: Nifty at 22,000, buy 22,200 Call for ₹150. If Nifty rises to 22,500, option might be worth ₹300+, doubling your investment.
Bull Call Spread
Setup: Buy 1 ITM/ATM Call + Sell 1 higher strike Call.
Purpose: Lower cost vs. long call.
Risk: Limited to net premium paid.
Reward: Limited to difference between strikes minus premium.
Example: Buy 22,000 Call for ₹200, Sell 22,500 Call for ₹80 → Net cost ₹120. Max profit ₹380 (if Nifty at or above 22,500).
Bull Put Spread (Credit Spread)
Setup: Sell 1 higher strike Put + Buy 1 lower strike Put.
Purpose: Earn premium in bullish to neutral markets.
Risk: Limited to spread width minus premium.
Example: Sell 22,000 Put ₹200, Buy 21,800 Put ₹100 → Credit ₹100.
Tesla

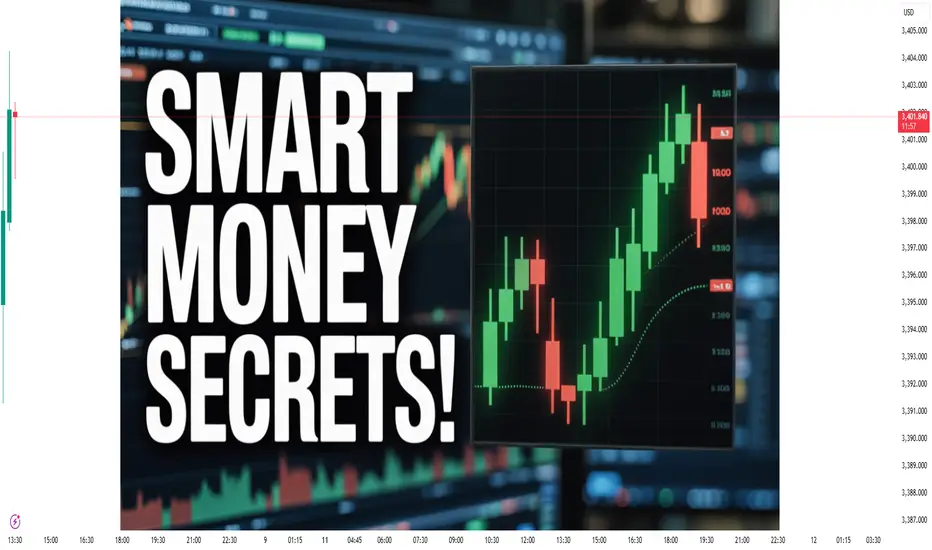
Smart Money Concepts 1. Introduction to Smart Money Concepts
The financial markets aren’t just a free-for-all where everyone has the same chance of winning. If you’ve ever felt like the market moves against you right after you enter a trade, it’s probably not your imagination. This is where Smart Money Concepts come in — the idea that large, professional market participants (banks, hedge funds, institutions) have both the resources and the incentive to move the market in a way that benefits them… and often at the expense of retail traders.
The goal of SMC trading is to stop following the herd and start trading in alignment with the “smart money” — the institutional order flow that truly drives price movement.
2. Who is the Smart Money?
Smart money refers to the participants with:
Large capital (able to move the market)
Market-making power (often acting as liquidity providers)
Insider knowledge (economic data in advance, order book depth)
Advanced tools (algorithms, AI, high-frequency trading systems)
Examples:
Central banks
Commercial banks
Hedge funds
Institutional asset managers
Proprietary trading firms
Market makers
Their advantages:
Access to better information (they see real liquidity and order flow)
Ability to manipulate price to hunt liquidity
Risk management expertise
Patience — they don’t rush into trades, they wait for key liquidity zones.
3. The Core Philosophy of SMC
SMC focuses less on retail-style indicators (like MACD, RSI) and more on:
Market structure
Liquidity
Order blocks
Fair Value Gaps
Breaker blocks
Institutional order flow
Stop hunts (liquidity grabs)
The key principle is:
Price moves from liquidity to liquidity, driven by institutions filling their large orders.
This means:
Market doesn’t move randomly.
Smart money often manipulates price to take out retail stops before moving in the intended direction.
Your job is to identify their footprints.
4. Understanding Market Structure in SMC
Market structure is the skeleton of price movement. In SMC, we read structure to know where we are in the trend and what smart money is doing.
4.1. Types of Structure
Bullish Market Structure
Higher Highs (HH) and Higher Lows (HL)
Smart money accumulates before pushing higher.
Bearish Market Structure
Lower Lows (LL) and Lower Highs (LH)
Smart money distributes before dropping price.
Consolidation
Sideways movement — often accumulation or distribution phases.
4.2. Market Structure Shifts (MSS)
When the trend changes:
In bullish trend: price breaks below the last HL → bearish MSS.
In bearish trend: price breaks above the last LH → bullish MSS.
MSS is often the first sign of a reversal.
5. Liquidity in SMC
Liquidity = resting orders in the market.
Institutions need liquidity to execute large trades without causing excessive slippage.
5.1. Where Liquidity Exists:
Above swing highs (buy stops)
Below swing lows (sell stops)
Round numbers (psychological levels)
Previous day/week highs & lows
Session highs/lows (London, New York)
Imbalance zones
5.2. Liquidity Hunts (Stop Hunts)
Before moving price in their intended direction, smart money will:
Push price above a recent high → triggering buy stops → fill their sell orders.
Push price below a recent low → triggering sell stops → fill their buy orders.
This shakeout removes retail traders and positions institutions in the opposite direction.
6. Order Blocks
An order block is the last bullish or bearish candle before a strong move.
Why they matter:
They represent areas where institutions placed large positions.
Price often returns to these zones to mitigate orders.
Types of Order Blocks:
Bullish Order Block
Last bearish candle before price rises aggressively.
Acts as demand zone.
Bearish Order Block
Last bullish candle before price drops aggressively.
Acts as supply zone.
Rules:
Price should break market structure after forming the order block.
Volume/impulse should confirm institutional involvement.
7. Fair Value Gaps (FVG)
Also called imbalances — when price moves too quickly, leaving inefficiency in the market.
7.1. How to Spot:
On a 3-candle pattern, if candle 1’s high is below candle 3’s low (in a bullish move), a gap exists in the middle.
7.2. Why Important:
Institutions tend to return to fill these gaps before continuing the move.
FVG acts as a magnet for price.
8. Accumulation & Distribution
This is where smart money quietly builds or unloads positions.
8.1. Accumulation
Occurs in ranges after downtrends.
Characterized by liquidity grabs below support.
Goal: institutions buy without alerting retail traders.
8.2. Distribution
Occurs in ranges after uptrends.
Characterized by liquidity grabs above resistance.
Goal: institutions sell to retail buyers before dropping price.
9. The SMC Trading Process
Let’s break down a step-by-step approach:
Identify Bias
Use higher timeframe market structure to determine bullish/bearish bias.
Mark Liquidity Zones
Previous highs/lows, order blocks, FVGs.
Wait for Liquidity Grab
Smart money often sweeps liquidity before the real move.
Look for Market Structure Shift
A break of structure confirms the reversal or continuation.
Find Entry at Key Level
Often inside order block or FVG after MSS.
Set Stop Loss
Below/above liquidity sweep.
Target Opposite Liquidity Pool
Price moves from one liquidity area to another.
10. Example Trade
Scenario:
EURUSD is in bullish higher timeframe trend.
On 1H chart: price sweeps previous day’s low (grabbing sell-side liquidity).
MSS occurs → break above minor high.
Price returns to bullish order block.
Entry placed, SL below OB, TP at previous high (buy-side liquidity).
Options Trading Strategies 1. Introduction to Options Trading Strategies
Options are like the “Swiss army knife” of the financial markets — flexible tools that can be shaped to fit bullish, bearish, neutral, or volatile market views. They’re contracts that give you the right, but not the obligation, to buy or sell an asset at a specific price (strike) on or before a certain date (expiry).
While most beginners think options are just for making huge leveraged bets, seasoned traders use strategies — combinations of buying and selling calls and puts — to control risk, generate income, or hedge portfolios.
2. Why Use Strategies Instead of Simple Buy/Sell?
Risk Management: You can cap your losses while keeping upside potential.
Income Generation: Strategies like covered calls and credit spreads generate consistent cash flow.
Direction Neutrality: You can profit even when the market moves sideways.
Volatility Play: You can design trades to profit from expected volatility spikes or drops.
Hedging: Protect stock holdings against adverse moves.
3. The Four Building Blocks of All Strategies
Every complex strategy is built using these four basic positions:
Type Action View Risk Reward
Long Call Buy Bullish Premium Unlimited
Short Call Sell Bearish Unlimited Premium
Long Put Buy Bearish Premium High (to zero)
Short Put Sell Bullish High (to zero) Premium
Once you understand these, combining them is like mixing ingredients to cook different recipes.
4. Categories of Options Strategies
Directional Strategies – Profit from a clear bullish or bearish bias.
Neutral Strategies – Profit from time decay or volatility drops.
Volatility-Based Strategies – Profit from big moves or volatility increases.
Hedging Strategies – Reduce risk on existing positions.
5. Directional Strategies
5.1. Bullish Strategies
These make money when the underlying price rises.
5.1.1 Long Call
Setup: Buy 1 Call
When to Use: Expect sharp upside.
Risk: Limited to premium paid.
Reward: Unlimited.
Example: Nifty at 22,000, buy 22,200 Call for ₹150. If Nifty rises to 22,500, option might be worth ₹300+, doubling your investment.
5.1.2 Bull Call Spread
Setup: Buy 1 ITM/ATM Call + Sell 1 higher strike Call.
Purpose: Lower cost vs. long call.
Risk: Limited to net premium paid.
Reward: Limited to difference between strikes minus premium.
Example: Buy 22,000 Call for ₹200, Sell 22,500 Call for ₹80 → Net cost ₹120. Max profit ₹380 (if Nifty at or above 22,500).
5.1.3 Bull Put Spread (Credit Spread)
Setup: Sell 1 higher strike Put + Buy 1 lower strike Put.
Purpose: Earn premium in bullish to neutral markets.
Risk: Limited to spread width minus premium.
Example: Sell 22,000 Put ₹200, Buy 21,800 Put ₹100 → Credit ₹100.
5.2 Bearish Strategies
These make money when the underlying price falls.
5.2.1 Long Put
Setup: Buy 1 Put.
When to Use: Expect sharp downside.
Risk: Limited to premium paid.
Reward: Large, until stock hits zero.
5.2.2 Bear Put Spread
Setup: Buy 1 higher strike Put + Sell 1 lower strike Put.
Purpose: Cheaper than long put, defined profit range.
Example: Buy 22,000 Put ₹180, Sell 21,800 Put ₹90 → Cost ₹90, Max profit ₹110.
5.2.3 Bear Call Spread
Setup: Sell 1 lower strike Call + Buy 1 higher strike Call.
Purpose: Profit from flat or falling markets.
Example: Sell 22,000 Call ₹250, Buy 22,200 Call ₹150 → Credit ₹100.
6. Neutral Strategies (Time Decay Focus)
These aim to profit if the underlying price stays within a range.
6.1 Iron Condor
Setup: Combine bull put spread and bear call spread.
Goal: Earn premium in range-bound market.
Example: Nifty 22,000 — Sell 21,800 Put, Buy 21,600 Put, Sell 22,200 Call, Buy 22,400 Call.
6.2 Iron Butterfly
Setup: Sell ATM call & put, buy OTM call & put.
Goal: Higher reward, but smaller profit range.
6.3 Short Straddle
Setup: Sell ATM call & put.
Goal: Collect max premium if price stays at strike.
Risk: Unlimited both sides.
6.4 Short Strangle
Setup: Sell OTM call & put.
Goal: Lower premium but wider safety zone.
7. Volatility-Based Strategies
These profit from big moves or volatility changes.
7.1 Long Straddle
Setup: Buy ATM call & put.
Goal: Profit if price moves big in either direction.
When to Use: Pre-event (earnings, budget).
Risk: Premium paid.
7.2 Long Strangle
Setup: Buy OTM call & put.
Cheaper than straddle, needs bigger move.
7.3 Calendar Spread
Setup: Sell near-term option, buy longer-term option (same strike).
Goal: Profit from time decay in short leg & volatility rise.
7.4 Ratio Spreads
Setup: Buy one option, sell more of same type further OTM.
Goal: Take advantage of moderate moves.
8. Hedging Strategies
These protect existing positions.
8.1 Protective Put
Hold stock + Buy Put.
Acts like insurance against downside.
8.2 Covered Call
Hold stock + Sell Call.
Generate income while capping upside.
8.3 Collar
Hold stock + Buy Put + Sell Call.
Limits both upside and downside.
Conclusion
Options trading strategies are not about gambling — they are risk engineering tools. Whether you aim to hedge, speculate, or earn income, you can design a strategy tailored to market conditions. The key is understanding your market view, volatility environment, and risk appetite — and then matching it with the right combination of calls and puts.
Mastering them is like mastering chess: the rules are simple, but winning requires foresight, discipline, and adaptability.
Part12 Trading Masterclass1. Introduction to Options Trading
Options trading is one of the most powerful tools in financial markets. Unlike traditional stock trading, where you buy and sell shares directly, options give you the right but not the obligation to buy or sell an asset at a predetermined price before a specific date. This flexibility allows traders to hedge risks, generate income, and speculate on price movements with limited capital.
In recent years, options trading has seen a surge in popularity, especially among retail investors. With the growth of online trading platforms and educational resources, more traders are exploring this complex yet rewarding field.
2. What Is an Option?
An option is a financial derivative contract. It derives its value from an underlying asset—commonly a stock, index, ETF, or commodity.
There are two types of options:
Call Option: Gives the holder the right to buy the asset at a fixed price (strike price) before or on the expiry date.
Put Option: Gives the holder the right to sell the asset at a fixed price before or on the expiry date.
Key Terms to Know:
Strike Price: The price at which the option can be exercised.
Premium: The price paid to purchase the option.
Expiration Date: The last date on which the option can be exercised.
Underlying Asset: The financial instrument (like a stock) the option is based on.
In the Money (ITM): When exercising the option would be profitable.
Out of the Money (OTM): When exercising the option would not be profitable.
At the Money (ATM): When the strike price is equal to the market price.

Part8 Trading MasterclassOption Trading in India (NSE)
Popular Instruments:
Nifty 50 Options
Bank Nifty Options
Stock Options (like Reliance, HDFC Bank, Infosys)
FINNIFTY, MIDCPNIFTY
Lot Sizes:
Each option contract has a fixed lot size. For example, Nifty has a lot size of 50.
Margins:
If you buy options, you pay only the premium. But selling options requires high margins (due to unlimited risk).
Risks in Options Trading
While options are powerful, they carry specific risks:
1. Time Decay (Theta)
OTM options lose value fast as expiry nears.
2. Volatility Crush
A sudden drop in volatility (like post-earnings) can cause option premiums to collapse.
3. Illiquidity
Some stock options may have low volumes, making them harder to exit.
4. Assignment Risk
If you’ve sold options, especially ITM, you may be assigned early (in American-style options).
5. Unlimited Loss for Sellers
Option writers (sellers) face potentially unlimited loss (especially naked calls or puts).

Part3 Institutional TradingThe Greeks: Measuring Risk
Options prices are sensitive to many factors. The "Greeks" are key metrics to assess these risks.
1. Delta
Measures the change in option price with respect to the underlying asset’s price.
Call delta ranges from 0 to 1.
Put delta ranges from -1 to 0.
2. Gamma
Measures the rate of change of delta. Important for managing large price swings.
3. Theta
Measures time decay. As expiry approaches, the option loses value (especially OTM options).
4. Vega
Measures sensitivity to volatility. Higher volatility = higher premium.
5. Rho
Measures sensitivity to interest rate changes.
Options Expiry & Settlement
In Indian markets (like NSE), stock options are European-style, meaning they can only be exercised on the expiration date. Index options are cash-settled.
Options expire on the last Thursday of every month (weekly options on Thursday each week). After expiry, worthless options are removed from your account.

Part12 Trading MasterclassIntroduction to Options Trading
Options trading is one of the most powerful tools in financial markets. Unlike traditional stock trading, where you buy and sell shares directly, options give you the right but not the obligation to buy or sell an asset at a predetermined price before a specific date. This flexibility allows traders to hedge risks, generate income, and speculate on price movements with limited capital.
In recent years, options trading has seen a surge in popularity, especially among retail investors. With the growth of online trading platforms and educational resources, more traders are exploring this complex yet rewarding field.
What Is an Option?
An option is a financial derivative contract. It derives its value from an underlying asset—commonly a stock, index, ETF, or commodity.
There are two types of options:
Call Option: Gives the holder the right to buy the asset at a fixed price (strike price) before or on the expiry date.
Put Option: Gives the holder the right to sell the asset at a fixed price before or on the expiry date.
Key Terms to Know:
Strike Price: The price at which the option can be exercised.
Premium: The price paid to purchase the option.
Expiration Date: The last date on which the option can be exercised.
Underlying Asset: The financial instrument (like a stock) the option is based on.
In the Money (ITM): When exercising the option would be profitable.
Out of the Money (OTM): When exercising the option would not be profitable.
At the Money (ATM): When the strike price is equal to the market price.

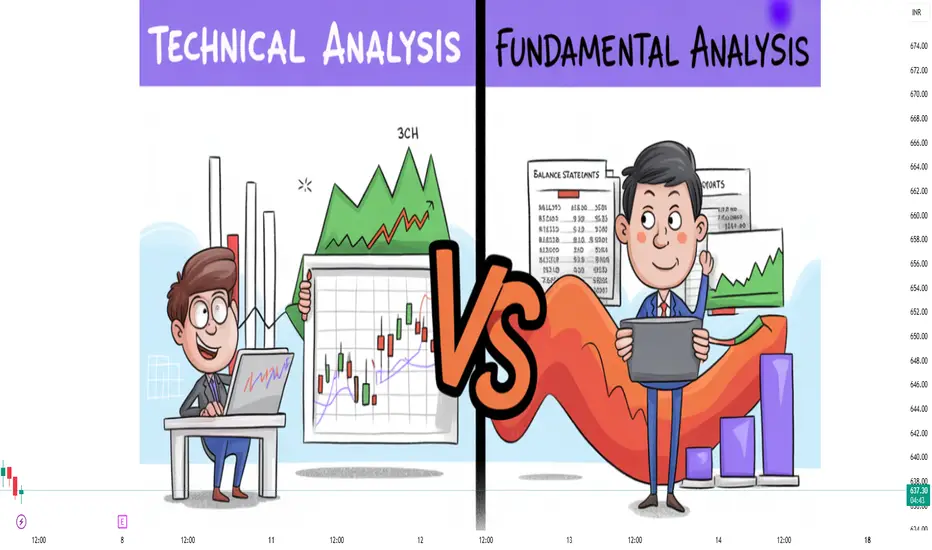
Technical Analysis vs Fundamental AnalysisIntroduction
In the world of trading and investing, two dominant schools of thought guide decision-making: technical analysis and fundamental analysis. Both methodologies aim to forecast future price movements, but they differ significantly in philosophy, approach, tools, and time horizons.
This detailed article offers a side-by-side comparison of technical and fundamental analysis, exploring their foundations, tools, advantages, limitations, and how modern traders often use a hybrid approach to gain an edge in the markets.
1. Definition and Core Philosophy
Technical Analysis (TA)
Definition: Technical analysis is the study of past market data—primarily price and volume—to forecast future price movements.
Philosophy:
All known information is already reflected in the price.
Prices move in trends.
History tends to repeat itself.
TA focuses on identifying patterns and signals within charts and market data to predict price action, independent of the company’s fundamentals.
Fundamental Analysis (FA)
Definition: Fundamental analysis involves evaluating a security's intrinsic value by examining related economic, financial, and qualitative factors.
Philosophy:
Every asset has an inherent (fair) value.
Market prices may deviate from intrinsic value in the short term but will eventually correct.
Long-term returns are driven by the health and performance of the underlying asset.
FA dives into financial statements, management quality, industry dynamics, macroeconomic factors, and more to decide if a security is overvalued or undervalued.
2. Key Objectives
Aspect Technical Analysis Fundamental Analysis
Primary Goal Predict short-to-medium term price moves Assess long-term value and growth potential
Trader Focus Entry and exit timing Business quality, profitability
Time Horizon Short-term (minutes to weeks) Medium to long-term (months to years)
3. Tools and Techniques
Technical Analysis Tools
Price Charts: Line, bar, and candlestick charts
Indicators & Oscillators:
Moving Averages (MA)
Relative Strength Index (RSI)
MACD (Moving Average Convergence Divergence)
Bollinger Bands
Stochastic Oscillator
Chart Patterns:
Head and Shoulders
Double Top/Bottom
Triangles (ascending, descending)
Flags and Pennants
Volume Analysis: Analyzing the strength of price movements
Support and Resistance Levels
Trend Lines and Channels
Price Action & Candlestick Patterns:
Doji
Hammer
Engulfing patterns
Fundamental Analysis Tools
Financial Statements:
Income Statement
Balance Sheet
Cash Flow Statement
Financial Ratios:
P/E (Price to Earnings)
P/B (Price to Book)
ROE (Return on Equity)
Current Ratio
Debt to Equity
Earnings Reports
Economic Indicators:
GDP growth
Inflation
Interest rates
Employment data
Industry & Competitive Analysis
Management Evaluation
Valuation Models:
Discounted Cash Flow (DCF)
Dividend Discount Model (DDM)
Residual Income Model
4. Approach to Market Behavior
Technical Analysts Believe:
Market psychology drives price patterns.
Prices reflect supply and demand, fear and greed.
“The trend is your friend.”
Fundamental Analysts Believe:
Markets are inefficient in the short run.
Understanding business fundamentals offers a long-term edge.
“Buy undervalued assets and wait for the market to realize their value.”
5. Advantages and Strengths
Advantages of Technical Analysis:
Effective for short-term trading.
Useful across all markets: stocks, forex, crypto, commodities.
Provides clear entry/exit points.
Applicable even when fundamental data is limited or irrelevant (e.g., cryptocurrencies).
Can be automated (quant systems, bots, algo-trading).
Advantages of Fundamental Analysis:
Helps identify long-term investment opportunities.
Backed by real data and financial metrics.
Focus on intrinsic value, reducing speculative risk.
Allows understanding of economic cycles, company health, and competitive advantage.
Strong foundation for value investing and dividend strategies.
6. Limitations and Criticisms
Limitations of Technical Analysis:
Can produce false signals in choppy markets.
Heavily reliant on pattern recognition, which can be subjective.
Assumes past price behavior repeats, which may not always hold.
May lead to overtrading.
Less effective in fundamentally driven markets (e.g., news-based volatility).
Limitations of Fundamental Analysis:
Time-consuming and data-intensive.
Less effective for timing entries/exits.
Assumptions in valuation models can be inaccurate.
Markets can remain irrational longer than a trader can remain solvent.
Difficult to apply in short-term trading scenarios.
7. Use in Different Market Conditions
Market Condition Technical Analysis Fundamental Analysis
Trending Market Very effective (trend following) May be slow to react
Sideways Market Can be misleading (whipsaws) Waits for fundamental triggers
News-Driven Volatilit Less reliable; news invalidates patterns Analyzes long-term implications of the news
Earnings Season High volatility useful for trades Critical time to revalue investments
8. Real-World Examples
Technical Analysis Example:
A trader observes a bullish flag on Reliance Industries’ chart. They enter a long trade expecting a breakout with a defined stop loss below the flag's support. No attention is paid to quarterly results or business updates.
Fundamental Analysis Example:
An investor evaluates Infosys’ fundamentals. Despite a recent dip in price due to market panic, the investor buys after analyzing strong balance sheets, healthy cash flow, and consistent dividends.
9. Types of Traders and Investors
Type Likely to Use
Scalper Purely technical analysis
Day Trader Mostly technical analysis
Swing Trader Technical with some fundamental awareness
Position Trader Blend of both
Investor Mostly fundamental analysis
Quant Trader TA-based systems, machine learning models
10. Integration: The Hybrid Approach
In the modern market landscape, many traders and investors adopt a hybrid approach, combining the strengths of both TA and FA. This dual strategy provides:
Better timing for fundamentally driven trades.
Deeper conviction in technically identified setups.
Risk reduction by filtering out weak stocks fundamentally.
Example: A swing trader scans for technically strong patterns in fundamentally sound stocks. They avoid penny stocks or overly leveraged companies, no matter how bullish the chart looks.
Part1 Ride The Big Moves1. Introduction to Options Trading
Options trading is a powerful financial strategy that allows traders to speculate on or hedge against the future price movements of assets such as stocks, indices, or commodities. Unlike traditional investing, where you buy or sell the asset itself, options give you the right, but not the obligation, to buy or sell the asset at a specific price before a specified date.
Options are widely used by retail traders, institutional investors, and hedge funds for various purposes—ranging from hedging risk, generating income, or leveraging small amounts of capital for high returns.
2. Basics of Options
What is an Option?
An option is a derivative contract whose value is based on the price of an underlying asset. It comes in two forms:
Call Option: Gives the holder the right to buy the underlying asset.
Put Option: Gives the holder the right to sell the underlying asset.
Key Terms
Strike Price: The price at which the option can be exercised.
Premium: The price paid to buy the option.
Expiry Date: The last date the option can be exercised.
In-the-Money (ITM): Option has intrinsic value.
Out-of-the-Money (OTM): Option has no intrinsic value.
At-the-Money (ATM): Strike price is equal or close to the current market price.

Inflation NightmareIntroduction
Inflation—defined as the general rise in prices of goods and services over time—is a double-edged sword in any economy. When moderate, it can stimulate spending and investment. But when inflation spirals out of control, it becomes an economic nightmare that can erode savings, destroy purchasing power, disrupt businesses, and destabilize entire nations. An inflation nightmare is not merely about rising costs—it is a systemic, psychological, and financial breakdown that touches every layer of society.
This 3000-word exploration of the "Inflation Nightmare" will take you through its root causes, real-world examples, economic consequences, societal impact, central bank responses, and lessons for investors, policymakers, and citizens.
1. What Is Inflation?
Inflation is measured by tracking price increases across a basket of essential goods and services, usually using indices such as the Consumer Price Index (CPI) or Wholesale Price Index (WPI). A modest inflation rate (2–3% annually) is often considered healthy for economic growth. However, inflation turns into a nightmare when it exceeds manageable levels—either due to demand-pull factors (too much money chasing too few goods), cost-push dynamics (rising production costs), or monetary mismanagement.
Types of Inflation:
Creeping Inflation – Slow and steady; manageable.
Walking Inflation – Moderate; begins to affect spending and investment.
Galloping Inflation – High inflation (10%+ annually); dangerous.
Hyperinflation – Extreme, uncontrolled inflation (50%+ monthly); catastrophic.
2. Causes of an Inflation Nightmare
a. Monetary Policy Failure
Central banks print money to boost economic activity. But excessive money printing without corresponding growth in goods and services leads to inflation. When governments run large fiscal deficits and monetize debt, it can fuel this process.
Example: Zimbabwe in the 2000s printed massive amounts of currency, leading to hyperinflation of over 79.6 billion percent.
b. Supply Chain Disruptions
Events like wars, pandemics, or natural disasters disrupt supply chains, causing shortages. When supply drops but demand remains the same or increases, prices rise steeply.
Example: COVID-19 caused global supply shocks, while stimulus packages increased demand—fueling inflation globally.
c. Commodity Price Shocks
Inflation can also result from surging prices of vital commodities like oil, food, or metals. Since these are inputs to many industries, cost increases ripple throughout the economy.
Example: The 1973 oil embargo quadrupled oil prices, leading to stagflation (high inflation + stagnation).
d. Wage-Price Spiral
As prices rise, workers demand higher wages. Businesses pass increased labor costs onto consumers, creating a self-reinforcing cycle that’s hard to break.
3. The Mechanics of the Nightmare
a. Currency Devaluation
When inflation surges, a nation’s currency loses value—both domestically and internationally. Imports become expensive, debt burdens grow, and investor confidence drops.
b. Collapse of Savings and Pensions
As purchasing power erodes, fixed income sources like pensions become inadequate. Retirement savings lose value unless indexed to inflation.
c. Middle-Class Erosion
The middle class bears the brunt of inflation. Their incomes don’t rise as fast as prices, while the wealthy shift assets into inflation-protected investments, widening inequality.
d. Business Disruptions
Price instability affects inventory, planning, contracts, and wages. Businesses may delay investments, leading to job losses and reduced output.
e. Social Unrest
Food and fuel inflation can trigger protests, strikes, and even revolutions. The Arab Spring began with rising bread prices.
4. Historical Inflation Nightmares
a. Germany – Weimar Republic (1921–1923)
War reparations and excessive printing led to hyperinflation.
Prices doubled every few days; people used wheelbarrows to carry money.
Middle class lost their wealth, leading to political radicalization.
b. Zimbabwe (2000–2009)
Land reforms destroyed agricultural productivity.
The government printed money to cover expenses.
Monthly inflation reached 89.7 sextillion percent.
A loaf of bread cost Z$10 billion.
c. Venezuela (2010–Present)
Oil dependence, corruption, and mismanagement.
Currency collapsed; citizens rely on barter or foreign currency.
Basic items like toilet paper and flour became luxuries.
5. The Psychological Toll
An inflation nightmare is not just economic—it alters behavior, perception, and trust.
a. Hoarding Behavior
Fear of future price hikes makes people stockpile essentials. This worsens shortages and further fuels inflation.
b. Loss of Trust in Currency
When money loses value daily, it ceases to serve as a store of value. People seek hard assets like gold, real estate, or foreign currency.
c. Dollarization
In some countries, people abandon local currency altogether. In Zimbabwe and Venezuela, U.S. dollars and cryptocurrencies replaced the national currency in everyday use.
6. Central Bank Dilemma
Fighting inflation is a central bank's primary task. But during an inflation nightmare, tools become limited and the stakes higher.
a. Raising Interest Rates
Higher rates reduce borrowing and spending, cooling demand. However, excessive rate hikes can cause a recession or debt crisis.
b. Quantitative Tightening
Reversing previous monetary expansion helps control money supply, but may reduce market liquidity and risk financial instability.
c. Policy Credibility
Central banks must act decisively and maintain public confidence. Any delay or miscommunication can worsen the situation.
Example: The U.S. Federal Reserve’s delayed response in the 1970s led to persistent inflation. Paul Volcker's sharp rate hikes in the 1980s finally broke the cycle—at the cost of a deep recession.
Modern Inflation Risks (2020s and Beyond)
a. Global De-Dollarization
If global confidence in the U.S. dollar weakens due to debt and deficits, it could create worldwide inflation pressure.
b. Deglobalization
Protectionism, reshoring, and geopolitical tensions raise production costs globally.
c. Climate Change and ESG
Carbon taxes, green transitions, and resource scarcity may contribute to structural inflation.
d. Digital Inflation
Digital goods seem deflationary, but tech monopolies and algorithmic pricing may create price opacity and hidden inflation.
Conclusion
The "Inflation Nightmare" is not just about rising prices—it's about loss of control, confidence, and continuity. It reflects systemic cracks in policy, governance, production, and social structure. Whether triggered by reckless monetary policy, geopolitical shocks, or mismanagement, once inflation spirals beyond a threshold, it unleashes chaos across all sectors.
Understanding the anatomy of an inflation nightmare is essential for policymakers, investors, businesses, and citizens. While inflation is a natural economic phenomenon, preventing it from becoming a catastrophe requires foresight, discipline, and global coordination.
The past has shown us how devastating uncontrolled inflation can be. Let us not sleepwalk into another nightmare.
Super Cycle Outlook1. Introduction
The global economy is entering a phase of profound transformation. Geopolitical shifts, technological revolutions, climate mandates, and monetary policy overhauls are laying the foundation for a potential super cycle — a long-term structural uptrend that reshapes asset classes across the board. The 2025–2030 period is shaping up as the convergence point of these forces, presenting opportunities and risks for investors, governments, and institutions.
This essay dissects the components of the upcoming super cycle, focusing on commodities, equities, cryptocurrencies, and macroeconomic dynamics. We analyze historical precedents, current catalysts, sectoral drivers, and likely winners and losers in this emerging landscape.
2. Understanding a Super Cycle
A super cycle refers to a prolonged period — typically a decade or more — of sustained growth or contraction in demand and prices across key sectors or asset classes. Unlike short-term cyclical movements, super cycles are driven by structural forces such as:
Demographics
Technological disruption
Resource scarcity or abundance
Policy shifts
Global industrialization waves (e.g., China’s rise in early 2000s)
Historical Super Cycles
Period Key Drivers Beneficiaries
1945–1965 Post-War Rebuilding, Baby Boom Equities, Infrastructure, Energy
2000–2011 China’s Industrialization Commodities (metals, oil)
2011–2020 Central Bank Liquidity, Tech Growth US Tech Stocks, Bonds
We are now on the cusp of a multi-dimensional super cycle, with key battlegrounds in energy, digital finance, AI, and geopolitics.
3. Commodities Super Cycle
The commodity market is often the first to reflect structural economic shifts. In 2025–2030, a renewed commodities super cycle is expected, triggered by:
3.1 Energy Transition Metals
The green energy transition demands vast quantities of lithium, copper, nickel, cobalt, and rare earths. Global EV adoption, solar panel deployment, and wind infrastructure expansion will fuel massive resource needs.
Copper
Demand: Grid electrification, EVs, semiconductors.
Supply constraint: Few new copper mines in development.
Outlook: Bullish, $12,000–$15,000/ton possible by 2030.
Lithium
Essential for EV batteries.
Supply bottlenecks in refining (mostly in China).
Lithium carbonate prices expected to trend upwards post-2025 as demand outpaces new supply.
3.2 Oil & Gas
Despite the green push, oil and gas are seeing a mini-cycle resurgence:
OPEC+ production controls.
Underinvestment in new exploration.
Short-term geopolitical supply shocks (Russia, Middle East tensions).
Oil may see spikes above $100/barrel periodically until renewable infrastructure matures.
3.3 Agriculture
Climate change is tightening global food supply:
Droughts, floods, and extreme weather affecting yields.
Shift toward biofuels also increasing demand.
Crops like wheat, corn, soybeans, and fertilizers are entering bullish territory.
4. Equities Super Cycle
While commodity-based super cycles are tangible and resource-driven, equity super cycles are powered by innovation, capital flows, and structural economic shifts.
4.1 AI and Digital Infrastructure
AI is the most transformative force since the internet. Between 2025–2030, expect:
AI integration into enterprise and manufacturing.
Soaring demand for GPUs, cloud computing, edge devices.
Dominance of firms like Nvidia, AMD, Microsoft, Google, and OpenAI-backed platforms.
Secondary beneficiaries: Data centers, cybersecurity, robotics.
4.2 Green Industrialization
Green energy firms — solar, wind, hydrogen, and battery storage — are in a multi-decade growth runway. Governments are subsidizing clean energy infrastructure, creating a boom similar to the early dot-com era.
4.3 Emerging Markets Renaissance
Many emerging economies are:
De-dollarizing trade.
Boosting infrastructure.
Benefiting from China+1 strategies (India, Vietnam, Mexico).
India, in particular, is poised to be a super cycle leader in equities driven by:
Capex revival.
Digital financial infrastructure (UPI, ONDC).
Demographic dividend.
5. Cryptocurrency Super Cycle
Crypto assets are entering a new legitimacy phase, marked by:
Institutional adoption (ETFs, sovereign wealth funds).
Regulation clarity in the US, Europe, and Asia.
Blockchain integration into traditional finance.
5.1 Bitcoin as Digital Gold
Bitcoin is evolving into a macro hedge:
Scarcity (21 million cap).
Store-of-value during monetary debasement.
Institutional inflows via spot ETFs (e.g., BlackRock, Fidelity).
Outlook: $150,000–$250,000 possible in the cycle peak (2026–2027).
5.2 Ethereum and Smart Contract Platforms
Ethereum and Layer 2s (Polygon, Optimism) are powering:
DeFi
NFT infrastructure
Tokenized real-world assets
With scalability solutions improving, Ethereum may reclaim dominance over alternative L1s.
5.3 Real-World Assets (RWA) Tokenization
Traditional assets like bonds, stocks, and real estate are being tokenized:
Improves liquidity.
Reduces settlement time.
Enables fractional ownership.
This trend may explode in the 2025–2030 period, creating new capital markets.
6. Macro Tailwinds & Risks
6.1 De-Dollarization & BRICS+
The push to reduce global dependence on the US dollar is accelerating:
China, Russia, Brazil settling trades in local currencies.
BRICS+ potentially launching a commodity-backed currency.
This could reshape:
FX reserves allocation.
Gold demand.
Global inflation dynamics.
6.2 Interest Rate & Inflation Regime Shift
The era of near-zero interest rates is over. Between 2025–2030:
Rates may stabilize around 3–5% in developed markets.
Inflation will be structurally higher due to:
Deglobalization
Energy transition costs
Fiscal dominance
Investors must adapt to a new macro regime — one that favors real assets, dividend-paying equities, and inflation hedges.
Conclusion
The 2025–2030 period marks a convergence of transformative forces:
Technological revolutions (AI, blockchain).
Green industrialization.
Shifts in global power and trade structures.
A reawakening of commodity markets.
This super cycle is not just about asset appreciation — it's about capital regime change. Navigating it requires structural thinking, macro awareness, and adaptability.
Long-term winners will be those who understand the drivers, diversify wisely, and adapt to volatility while staying grounded in megatrend analysis.
Part1 Ride The Big MovesOption Trading Tools & Platforms
Key tools for effective options trading:
Option Chain Analysis Tools (NSE, Sensibull, Opstra, etc.)
Payoff Diagram Simulators
Greeks Calculators
Strategy Builders
Volatility Charts (IV, HV)
Successful Option Trader’s Mindset
The best option traders are not gamblers. They:
Focus on risk management (position sizing, stop loss)
Use strategies, not guesses
Understand Greeks and volatility
Prefer probability over prediction
Learn from every trade
The Future of Options Trading
With tech-driven innovations, we are seeing:
Zero Day Expiry Options (0DTE) gaining popularity
AI-driven options strategies
Increased retail participation through mobile apps
Automated trading using APIs and bots
Micro contracts for better accessibility

Part8 Trading Masterclass Introduction to Options Trading
Options trading is a fascinating and powerful segment of the financial markets. Unlike buying stocks directly, options offer flexibility, leverage, and a wide variety of strategic choices. But with that power comes complexity and risk.
What Are Options?
An option is a contract that gives the buyer the right (but not the obligation) to buy or sell an underlying asset (like a stock, index, or ETF) at a specific price (strike price) before or on a specific date (expiry date).
Two Types of Options:
Call Option – Right to Buy
Put Option – Right to Sell
The Key Components of an Option Contract
Before diving into strategies and profits, let’s break down the essential parts of any option:
Component Description
Underlying Asset The stock, index, or commodity the option is based on
Strike Price The pre-defined price at which the buyer can exercise the option
Expiry Date The date on which the option contract expires
Premium The price paid by the buyer to purchase the option
Option Style Either European (exercised only at expiry) or American (anytime before expiry)

Retail Trading vs Institutional TradingIntroduction
The financial markets are a dynamic ecosystem composed of diverse participants ranging from individual investors to large financial institutions. These participants can be broadly categorized into retail traders and institutional traders. While both aim to generate profits from the markets, they operate on fundamentally different scales, use different strategies, and face varying levels of regulation and risk exposure.
This article explores the essential differences between retail and institutional trading, comparing their objectives, tools, advantages, limitations, and market impact. Understanding this distinction is crucial for traders, investors, and market analysts alike.
1. What is Retail Trading?
Retail trading refers to the buying and selling of securities by individual investors who manage their own money. These traders typically use brokerage platforms such as Zerodha, Upstox, Robinhood, or Interactive Brokers to place trades in stocks, bonds, derivatives, mutual funds, and ETFs.
Key Characteristics of Retail Traders:
Trade using personal funds
Use online trading platforms
Typically trade in small volumes
Limited access to advanced tools and research
Often influenced by market sentiment and news
Operate independently
Common Participants:
Individual investors
Self-directed traders
Hobbyists and part-time traders
Beginner investors using mobile apps
2. What is Institutional Trading?
Institutional trading is conducted by large organizations that manage vast amounts of capital on behalf of clients or stakeholders. These include mutual funds, hedge funds, insurance companies, pension funds, investment banks, and proprietary trading firms.
Key Characteristics of Institutional Traders:
Trade large volumes of securities
Use proprietary algorithms and data analytics
Employ teams of analysts, economists, and quants
Can influence market trends due to trade size
Often get better pricing (e.g., lower spreads, negotiated commissions)
Subject to stricter regulatory requirements
Common Participants:
Mutual funds
Hedge funds
Pension funds
Insurance companies
Sovereign wealth funds
Family offices
Asset management firms
3. Core Differences Between Retail and Institutional Trading
Aspect Retail Trading Institutional Trading
Capital Size Small (thousands to lakhs) Large (crores to billions)
Tools & Technology Basic to moderate tools High-end proprietary tools & infrastructure
Access to Information Public and delayed data Real-time data, deep analytics, and research
Trading Costs Higher relative commissions Lower commissions due to bulk discounts
Market Impact Minimal Significant due to trade size
Investment Horizon Short-term to medium-term Varies—can be short, medium, or long-term
Speed & Execution Slower execution High-speed execution using smart order routing
Risk Management Often basic or emotional Systematic with hedging and quantitative models
Regulatory Compliance Limited oversight Extensive regulations and audits
Leverage Availability Limited Significant leverage (with risk controls)
4. Tools & Technologies
Retail Traders:
Trading apps (e.g., Zerodha Kite, Robinhood)
Charting platforms (e.g., TradingView)
Technical indicators (MACD, RSI, Bollinger Bands)
Social media and forums for sentiment analysis
Institutional Traders:
Direct Market Access (DMA)
High-Frequency Trading (HFT) infrastructure
Bloomberg Terminal and Reuters Eikon
Algorithmic trading engines
Risk Management Systems (RMS)
Machine Learning & AI models for prediction
5. Strategies Used
Retail Trading Strategies:
Day Trading: Buying and selling within the same day
Swing Trading: Capturing price swings over a few days
Position Trading: Holding for weeks or months
Momentum Trading: Riding price momentum
Technical Analysis: Relying on chart patterns and indicators
Institutional Trading Strategies:
Arbitrage: Exploiting price differences across markets
Quantitative Models: Using mathematical models to trade
High-Frequency Trading (HFT): Executing thousands of trades per second
Long/Short Equity: Simultaneously buying undervalued and shorting overvalued stocks
Portfolio Hedging: Using options and futures to manage risk
Dark Pool Trading: Executing large trades without impacting the market
6. Advantages & Disadvantages
Retail Trading Advantages:
Flexibility: Can enter and exit positions quickly
No Mandates: No pressure to follow institutional mandates
Wide Choices: Can explore niche assets (e.g., penny stocks, crypto)
Learning Curve: Great platform to learn and experiment
Retail Trading Disadvantages:
Lack of Access: No early access to IPOs or insider pricing
Emotional Decisions: Prone to fear and greed
Higher Costs: Commissions and spreads are relatively higher
Limited Research: Often rely on social media or basic tools
Institutional Trading Advantages:
Deep Research: Backed by teams of analysts and economists
Negotiated Costs: Lower execution costs
Market Access: Access to IPO allocations, block deals, dark pools
Risk Management: Strong systems and frameworks in place
Institutional Trading Disadvantages:
Slower Flexibility: Large trades require strategic execution
Regulatory Burden: Heavily regulated and audited
Crowded Trades: Many institutions follow similar models, leading to herd behavior
7. Regulatory Landscape
Retail Traders:
Must comply with basic market regulations set by authorities like SEBI (India), SEC (USA), or FCA (UK)
Brokers manage KYC/AML compliance
Retail participation is encouraged for market democratization
Institutional Traders:
Face heavy scrutiny and reporting requirements
Subject to detailed disclosures, audits, and risk controls
Must adhere to fund mandates, client transparency norms, and regulatory caps
8. Market Influence
Retail Impact:
Retail traders often move smaller-cap stocks due to low liquidity. However, when acting in mass (e.g., during meme stock frenzies like GameStop in 2021), they can disrupt even large-cap stocks temporarily.
Institutional Impact:
Institutions shape long-term trends. Their decisions impact indices, bond yields, sectoral allocations, and global flows. For example, when FIIs (Foreign Institutional Investors) sell off Indian equities, the market often sees sharp corrections.
9. Case Studies
GameStop (2021) – Retail Power:
A short squeeze initiated by Reddit's r/WallStreetBets community caused GameStop shares to skyrocket, hurting hedge funds and proving that coordinated retail action can temporarily disrupt institutional strategies.
LIC IPO (India 2022) – Institutional Influence:
India’s largest-ever IPO saw massive institutional participation, shaping investor confidence and price discovery even before listing.
10. Risk Profiles
Retail Risks:
Lack of diversification
Overtrading or using excessive leverage
Chasing trends without research
Emotional bias
Institutional Risks:
Portfolio concentration in similar assets
Black swan events affecting large positions
Regulatory or compliance breaches
Liquidity mismatches in stressed times
Conclusion
Retail and institutional trading represent two ends of the financial market spectrum. While institutions control the majority of market volume and influence, retail traders are growing rapidly in number, especially in emerging markets like India.
Each has its strengths and weaknesses. Retail traders enjoy flexibility and personal control but lack the tools and scale of institutions. On the other hand, institutions command influence and resources but face regulatory and structural limitations.
Technical Analysis vs Fundamental Analysis 1. What is Technical Analysis?
Technical Analysis is the study of past market data, primarily price and volume, to forecast future price movements. TA assumes that all known information is already factored into prices, and that patterns in trading activity can reveal potential market moves.
Core Assumptions of Technical Analysis:
The market discounts everything: Prices reflect all available information—economic, political, social, and psychological.
Prices move in trends: Assets tend to move in identifiable patterns or trends that persist until reversed.
History repeats itself: Price movements are cyclical and patterns tend to repeat due to investor psychology.
2. What is Fundamental Analysis?
Fundamental Analysis involves evaluating a company’s intrinsic value by examining related economic, financial, and qualitative factors. This includes studying balance sheets, income statements, industry health, and broader economic conditions.
Core Assumptions of Fundamental Analysis:
Markets are not always efficient: Assets can be overvalued or undervalued in the short term.
Intrinsic value matters: A security has a true value, which may differ from its market price.
Over time, price converges to value: Eventually, the market will recognize the true value of a security.
3. Tools and Techniques
Technical Analysis Tools:
Tool Description
Charts Line, Bar, Candlestick
Indicators RSI, MACD, Moving Averages, Bollinger Bands
Patterns Head & Shoulders, Flags, Triangles
Volume Analysis On-Balance Volume (OBV), Volume Profile
Trendlines & Channels Support/Resistance, Fibonacci retracement
Price Action Candlestick formations (e.g., Doji, Engulfing)
Fundamental Analysis Tools:
Tool Description
Financial Statements Income Statement, Balance Sheet, Cash Flow
Ratios P/E, PEG, ROE, Debt-to-Equity
Macro Indicators GDP, Inflation, Interest Rates
Industry Analysis Competitive positioning, market size
Management Evaluation Leadership quality, business vision
Valuation Models DCF, Dividend Discount Model, Relative Valuation
4. Time Horizons and Suitability
Category Technical Analysis Fundamental Analysis
Ideal For Traders (day/swing/short-term) Investors (long-term)
Time Horizon Minutes to weeks Months to years
Use Cases Timing entry/exit, momentum plays Value investing, portfolio building
Focus Market behavior Business performance
5. Pros and Cons
Advantages of Technical Analysis:
Speed: Immediate and responsive to market movements.
Entry/Exit timing: Ideal for short-term trading.
Visual clarity: Charts simplify complex data.
Works across markets: Applies to forex, stocks, crypto, etc.
Limitations of Technical Analysis:
Noise: Prone to false signals and whipsaws.
Subjectivity: Interpretation of patterns varies.
Lagging indicators: Most tools are reactive, not predictive.
No value focus: Ignores intrinsic worth.
Advantages of Fundamental Analysis:
Long-term perspective: Helps identify high-quality businesses.
True valuation: Invest based on what a company is really worth.
Strategic investing: Focuses on big picture, less market noise.
Supports conviction: Encourages holding through volatility.
Limitations of Fundamental Analysis:
Slow to react: Misses short-term opportunities.
Time-consuming: Requires deep research and modeling.
Subject to bias: Forecasting future growth is speculative.
Can lag market moves: Prices may remain irrational longer than expected.
6. Key Differences Table
Factor Technical Analysis Fundamental Analysis
Primary Focus Price and volume Financial health and economic data
Data Used Historical charts and indicators Company reports, economic data
Objective Predict short-term price moves Determine intrinsic value
Timeframe Short to medium-term Medium to long-term
Approach Quantitative & statistical Qualitative & quantitative
Output Buy/sell signals Valuation and growth potential
Market Sentiment Integral Secondary
Tools Indicators, chart patterns Ratios, models, reports
7. Practical Application in Real Markets
Scenario 1: Day Trading a Stock
Technical Analyst uses a 5-minute candlestick chart, waits for a bullish flag pattern, and confirms with RSI divergence before entering a trade.
Fundamental Analyst might not even participate in intraday action, deeming it noise unless there's a major earnings release or corporate announcement.
Scenario 2: Long-Term Investing in a Blue Chip
Fundamental Analyst evaluates the company’s ROE, debt levels, sector growth, and intrinsic valuation using a DCF model.
Technical Analyst might use weekly or monthly charts to time the entry based on breakout patterns or long-term moving averages.
Scenario 3: Reaction to an Earnings Report
Fundamental Analyst reads the earnings transcript, compares EPS vs. estimates, and revises target valuation accordingly.
Technical Analyst watches how the stock reacts on the chart—gap up/down, volume spike, reversal candles, etc.—to trade short-term volatility.
8. Can They Be Combined?
Yes—many professionals blend both for a hybrid strategy known as “techno-fundamental analysis.”
Why Combine Them?
Fundamentals provide the “why” (reason to invest).
Technicals provide the “when” (timing to enter or exit).
For example, you may select a fundamentally strong stock and wait for a bullish technical setup to enter. This approach reduces risk and improves returns.
9. Use by Institutions vs Retail Traders
User Preferred Analysis
Retail Day Traders Mainly technical
Swing Traders Technical with some fundamental filters
Long-Term Investors Mainly fundamental
Mutual Funds/Pension Funds Heavily fundamental
Hedge Funds/Algo Firms Both (quant models)
FIIs/DIIs Deep macro + company-level fundamentals
10. Impact of Market Conditions
Market Phase Technical Analysis Fundamental Analysis
Bull Market Momentum strategies work well Fundamentals often justify upward revisions
Bear Market Short-selling via technical signals Good for finding value stocks
Sideways Market Range-bound strategies Fewer opportunities; hold and accumulate
Volatile Markets Technicals give faster signals Fundamentals may lag real-time moves
Conclusion
Both Technical Analysis and Fundamental Analysis serve crucial roles in financial decision-making. They’re not rivals but complementary disciplines. While technicals help you understand market behavior and improve timing, fundamentals reveal the true worth of an asset.
Traders benefit from real-time TA signals and price action tools.
Investors build conviction through FA, focusing on business quality and valuation.
In today's complex and fast-moving markets, the best strategies often incorporate both approaches. Whether you're aiming to trade daily momentum or invest in long-term value, understanding both perspectives enhances your edge in navigating the markets wisely.
Options Trading Strategies Introduction to Options Trading
Options are powerful financial derivatives that provide traders with flexibility, leverage, and the ability to profit in any market direction—up, down, or sideways. However, trading options without a strategy is like sailing without a compass. A well-thought-out options trading strategy can improve your success rate, minimize losses, and boost returns.
Options trading strategies are designed to exploit different market conditions—bullish, bearish, neutral, and volatile. Whether you're an income investor or a speculative trader, there's an options strategy tailored for your goals.
📌 Part 1: The Basics of Options
🧩 What is an Option?
An option is a contract that gives the buyer the right (but not the obligation) to buy or sell an underlying asset (usually a stock or index) at a specific price (strike price) before a specific date (expiration).
There are two types of options:
Call Option: Right to buy the asset.
Put Option: Right to sell the asset.
📈 Key Terms
Strike Price: Price at which the option can be exercised.
Premium: Cost to buy the option.
Expiry Date: Last date to exercise the option.
ITM (In the Money): Option has intrinsic value.
ATM (At the Money): Strike price = market price.
OTM (Out of the Money): Option has no intrinsic value.
📊 Part 2: Factors Influencing Options Prices
Underlying Stock Price
Time to Expiry
Volatility (Implied and Historical)
Interest Rates
Dividends
Understanding these "Greeks" helps manage strategies:
Delta: Sensitivity to price changes.
Theta: Time decay.
Gamma: Rate of change of delta.
Vega: Sensitivity to volatility.
🚀 Part 3: Core Options Trading Strategies
🟢 A. Bullish Strategies
1. Long Call
Goal: Profit from rising prices.
How it works:
Buy a call option on a stock you expect to go up.
Risk is limited to the premium paid.
Unlimited upside potential.
Example:
Stock: ₹100
Buy 1 call option with ₹105 strike, ₹2 premium
Breakeven: ₹107
Max Loss: ₹2 per share
2. Bull Call Spread
Goal: Cheaper bullish bet with limited risk.
How it works:
Buy 1 call at lower strike
Sell 1 call at higher strike
Example:
Buy ₹100 call for ₹4
Sell ₹110 call for ₹2
Net cost: ₹2
Max profit: ₹8
3. Cash-Secured Put
Goal: Buy stock at a lower price.
How it works:
Sell a put option on a stock you’re willing to own.
Collect premium upfront.
If exercised, you buy the stock at strike price.
🔴 B. Bearish Strategies
4. Long Put
Goal: Profit from falling prices.
How it works:
Buy a put option.
Risk is limited to the premium.
High upside if stock falls sharply.
5. Bear Put Spread
Goal: Controlled bearish bet.
How it works:
Buy a higher strike put.
Sell a lower strike put.
Example:
Buy ₹100 put for ₹5
Sell ₹90 put for ₹2
Max profit: ₹8, Max loss: ₹2
6. Covered Call
Goal: Earn income on held stock.
How it works:
Own the stock.
Sell a call option above current price.
Generate premium but cap upside.
⚫ C. Neutral Strategies
7. Iron Condor
Goal: Profit in range-bound market.
How it works:
Sell OTM put and call.
Buy further OTM put and call to protect.
Example:
Stock at ₹100
Sell ₹90 put and ₹110 call
Buy ₹85 put and ₹115 call
Profit if stock stays between ₹90–₹110
8. Iron Butterfly
Goal: Profit from very low volatility.
How it works:
Sell ATM call and put
Buy OTM call and put
Higher reward if stock closes near the strike price.
9. Straddle
Goal: Profit from big move (direction unknown).
How it works:
Buy 1 ATM call and 1 ATM put.
High cost, but unlimited profit if stock moves significantly.
10. Strangle
Cheaper version of Straddle.
Buy OTM call and OTM put.
Requires bigger move to be profitable.
Options Tools & Platforms
To trade options effectively, leverage:
Option Chain Analysis
Open Interest (OI) and Volume
Implied Volatility (IV) Trends
Greeks Analysis
Payoff Diagrams
Popular platforms in India:
Zerodha Sensibull
Upstox
Angel One SmartAPI
ICICI Direct, Kotak Neo
TradingView (for charts)
Advanced Strategies & Adjustments
As you grow, explore:
Ratio spreads
Backspreads
Box spreads
Rolling strategies for adjustments
Hedging portfolios using protective puts/calls
Options in Indian Markets
Indian traders should be aware of:
Weekly expiry (especially Nifty & Bank Nifty)
Liquidity differences in strikes
SEBI margin rules
Physical settlement for stock options
Zero-Day Options Trading (ZEDO): Gaining traction in India for same-day expiry trades.
🧾 Conclusion
Options trading is a blend of art, science, and psychology. Whether you're looking to hedge, speculate, or earn income, there's an options strategy suited for your outlook and risk appetite. But mastering them takes time, practice, and discipline.
Always test your strategies in a paper trading environment, understand the risks involved, and continuously educate yourself. The world of options is deep—but when mastered, it opens the door to flexible and profitable trading.
Super Cycle Outlook Introduction
The period from 2025 to 2030 is poised to be one of the most dynamic in recent financial history. As global economies undergo seismic transformations driven by deglobalization, technological revolutions, climate change imperatives, and shifting monetary policies, investors are increasingly turning to the idea of a “super cycle.” A super cycle represents a prolonged period—often years or even decades—of expansion or contraction across key asset classes like commodities, cryptocurrencies, and equities.
This outlook explores the macroeconomic themes, technological catalysts, geopolitical realignments, and behavioral finance trends that may drive super cycles in three major domains: commodities, crypto, and equity markets.
1. The Macro Framework of Super Cycles
1.1 Defining Super Cycles
A super cycle is not just a long bull or bear market—it reflects a multi-year structural change in demand and supply fundamentals, often aligned with massive shifts in economic, demographic, or geopolitical paradigms. Previous super cycles include:
The post-WWII industrial boom (1950s–1970s)
The emerging market commodity boom (2000s)
The tech-driven equity surge (2010s–2021)
1.2 Forces Shaping the 2025–2030 Period
Decentralization of global supply chains
Aging Western demographics vs. rising Global South demand
AI and automation
Climate change and ESG investing
Geopolitical fragmentation (e.g., BRICS+ vs. G7)
De-dollarization and rise of digital currencies
Post-pandemic economic recalibrations
2. Commodities: Green Metals, Energy, and Food Security
2.1 Green Super Cycle
The green energy transition is creating a new demand wave for critical metals, triggering a likely commodity super cycle.
Key Beneficiaries:
Lithium, cobalt, nickel: EV batteries
Copper: Electrification, solar panels, and grid infrastructure
Rare earths: Wind turbines, semiconductors, defense tech
Outlook:
Copper demand could double by 2030.
Lithium demand may grow 3x to 5x due to EV adoption.
Supply shortages are likely due to underinvestment in mining.
2.2 Traditional Energy Resilience
Despite decarbonization trends, fossil fuels are not fading away. Oil, gas, and even coal are experiencing a surprising second wind.
Factors Driving Oil & Gas Resurgence:
Delay in green infrastructure readiness
Increased energy nationalism
Supply disruptions due to geopolitical tensions (Russia, Middle East)
Outlook:
Oil prices may remain elevated, with Brent crude averaging $90–110 between 2025–2028.
Natural gas (LNG) exports from the US and Australia will grow as Europe and Asia diversify supply.
2.3 Agricultural Commodities & Food Security
Climate volatility and geopolitical shocks (like the Ukraine war) have exposed food system vulnerabilities.
Trends to Watch:
Demand for wheat, corn, soybeans to stay high
Water scarcity affecting yields
Shift to precision agriculture and agri-tech
Outlook:
Inflation-linked gains in food prices may spur investment in agricultural ETFs, farmland, and water rights.
3. Crypto: From Hype to Institutionalization
3.1 The End of the “Wild West” Era
The 2010s and early 2020s were the age of speculative crypto booms and rug-pulls. From 2025 onward, crypto is entering a more mature phase, shaped by regulation, stablecoins, and digital identity systems.
3.2 Bitcoin: Digital Gold 2.0
Bitcoin’s scarcity narrative remains intact post multiple halving cycles.
Institutional adoption is accelerating via ETFs, pension funds, and sovereign wealth funds.
Emerging markets like Argentina, Nigeria, and Turkey are turning to BTC amid currency instability.
Outlook:
Bitcoin price may reach $150,000–$250,000 by 2030.
Will increasingly be seen as a macro hedge against fiat depreciation.
3.3 Ethereum and the Tokenized Economy
Ethereum is morphing into the settlement layer of the internet, supporting DeFi, NFTs, tokenized RWAs (real-world assets), and CBDCs.
“Ethereum killers” (e.g., Solana, Cardano, Avalanche) continue to innovate, but Ethereum’s brand and scale give it staying power.
Outlook:
Ethereum to play a key role in institutional DeFi, supporting trillions in tokenized assets.
Use cases in trade finance, insurance, and securities settlement to explode.
3.4 Stablecoins, CBDCs & Regulation
USDC, USDT, and CBDCs will dominate cross-border payments.
Expect full crypto regulations globally by 2026–2027.
A regulated crypto ecosystem may become Wall Street 2.0.
Outlook:
Real-world asset tokenization may become a $20–30 trillion market by 2030.
Central banks will push programmable money tied to national objectives (e.g., carbon credits, subsidies).
4. Equities: Fragmentation, Innovation, and Sector Shifts
4.1 AI & Deep Tech Boom
The next equity super cycle may revolve around AI, robotics, biotech, and space tech.
Key Drivers:
AI automation revolution across industries
Massive computing power requirements (data centers, semiconductors)
Biotech breakthroughs (CRISPR, gene editing, synthetic biology)
Space economy growth (satellite internet, lunar exploration)
Outlook:
AI stocks may mirror the dot-com boom (and bust) pattern.
NVIDIA-type valuations may become common in AI infrastructure players.
US-China tech decoupling may create dual innovation ecosystems.
4.2 Emerging Market Renaissance
While developed market equities may face slowing growth due to saturation and demographics, EM equities may rise as the next growth frontier.
Key Growth Engines:
India (demographics, digital rails, manufacturing)
Indonesia, Vietnam, Philippines (China+1 strategy)
Africa (youth, mobile-first economies)
Outlook:
MSCI Emerging Markets Index could outperform S&P 500 in CAGR terms.
Retail investor participation in India and ASEAN may create massive capital inflows.
4.3 Sectoral Rotation: From Growth to Value?
Rising rates and sticky inflation have led to renewed interest in value stocks—industrial, banking, energy.
Yet, growth stocks in AI and clean tech will still attract long-term capital.
Outlook:
Expect sector rotations every 12–18 months.
Long-term investors may favor a barbell strategy—combining defensives with disruptive innovators.
4.4 ESG and Impact Investing
ESG is transitioning from narrative to performance metrics.
Climate funds, carbon markets, and sustainability indices will drive flows.
Outlook:
Green and blue bonds, ESG ETFs may capture trillions in AUM.
Investors will demand proof of impact, not just greenwashing.
5. Risks & Disruptors
5.1 Inflation & Interest Rate Cycles
Sticky inflation due to wage pressures and commodity bottlenecks
Potential for multiple rate hike cycles across major economies
Equity valuations may remain volatile in a higher-for-longer regime
5.2 Geopolitical Flashpoints
Taiwan Strait, Middle East, and Russia-Ukraine tensions
Cyberwarfare, AI militarization, and space conflict risks
US-China Cold Tech War intensifying
5.3 Climate Shocks
Rising frequency of natural disasters affecting agriculture, insurance, and infrastructure
Policy responses (carbon taxes, border adjustments) could reshape supply chains
5.4 Black Swans
AI alignment failures
Massive sovereign debt crisis (Japan, Italy, US?)
Central bank digital currencies undermining fiat trust
Pandemic 2.0 scenarios
6. Strategic Allocation in a Super Cycle Era
6.1 Multi-Asset Portfolio Themes (2025–2030)
Asset Class Role in Portfolio Super Cycle Tailwind
Commodities Inflation hedge Green energy, food security
Crypto Risk/return kicker De-dollarization, digital economy
Equities (AI, EM) Growth engine Innovation, demographic dividends
Bonds (short-term) Stability Selective in rising rate scenario
Real Assets (REITs, Farmland) Store of value Climate-proof, income generation
6.2 Thematic Investing Strategies
Green metals ETFs
AI/robotics funds
Digital asset infrastructure (crypto exchanges, DeFi protocols)
Water and farmland investments
Emerging market consumer ETFs
6.3 Trading vs. Investing in Super Cycles
Super cycles reward long-term thematic investing.
But short-term corrections within the cycle are inevitable.
Blend of core-satellite strategy recommended:
Core: Passive diversified holdings
Satellite: Thematic/high-beta plays
Conclusion
The 2025–2030 period may usher in a once-in-a-generation realignment of global asset classes. The rise of green technologies, the maturation of crypto, and the evolution of equity markets will define how capital flows across borders and sectors. These super cycles are not just financial stories—they are reflections of deeper transformations in technology, geopolitics, and human behavior.
Investors who can anticipate themes, allocate smartly, and adapt quickly will not only survive but thrive in this new era. While volatility is certain, so too is opportunity—for those with the foresight to ride the next super cycle.
Sector Rotation Strategies1. Introduction
Volatile markets can strike fear into the hearts of even the most seasoned investors. However, amidst the chaos, opportunities emerge. One of the most effective strategies to navigate turbulence is sector rotation—the practice of shifting capital among different sectors of the economy to capture relative strength and minimize downside risk.
In this comprehensive guide, we’ll explore how to apply sector rotation during volatile markets, backed by historical data, theoretical insights, and practical strategies.
2. Understanding Sector Rotation
Sector rotation involves allocating capital across different sectors of the market—like technology, healthcare, energy, and financials—based on their performance potential relative to macroeconomic conditions and investor sentiment.
The market is broadly divided into cyclical sectors (e.g., consumer discretionary, industrials, financials) and defensive sectors (e.g., utilities, healthcare, consumer staples). Understanding the relative performance of these sectors under different market conditions is the essence of sector rotation.
3. Volatile Markets: Definition and Characteristics
Volatility refers to sharp price movements, both up and down, often measured by the VIX (Volatility Index). Characteristics of volatile markets include:
Sudden news shocks (geopolitical events, policy changes)
Uncertainty in interest rates or inflation
Declining investor confidence
High trading volumes
Sector-specific panic or exuberance
Volatility isn't always bad—it often precedes major directional moves and creates sector divergences.
4. The Core Logic Behind Sector Rotation
At its heart, sector rotation assumes that no sector outperforms all the time. Each sector has a unique set of sensitivities—interest rates, inflation, earnings cycles, regulatory changes.
Key principles include:
Economic Sensitivity: Cyclical sectors outperform during economic expansions, while defensive sectors do better during contractions.
Rate Sensitivity: Financials thrive when interest rates rise, but rate-sensitive sectors like real estate may struggle.
Inflation Hedge: Energy and materials often perform well when inflation expectations are high.
Understanding these principles helps investors rotate in sync with macroeconomic tides.
5. Business Cycle and Sector Performance
The sector rotation strategy aligns closely with the economic/business cycle, which includes the following phases:
Cycle Phase Leading Sectors
Early Recovery Financials, Consumer Discretionary, Industrials
Mid Expansion Tech, Materials
Late Expansion Energy, Commodities
Recession/Contraction Utilities, Healthcare, Consumer Staples
In volatile markets, identifying which phase the economy is in becomes vital. Often, volatility spikes during transitions between phases.
6. Indicators to Watch for Sector Rotation
To effectively execute sector rotation strategies, traders rely on a mix of technical, fundamental, and macro indicators:
Relative Strength (RS) of sectors vs. the S&P 500
Intermarket Analysis (e.g., bond yields vs. equities)
Yield Curve Movement
Purchasing Managers’ Index (PMI)
Consumer Confidence Index
Fed statements and rate changes
Sector ETFs Volume Analysis
In volatile markets, intermarket correlations often break, making it essential to monitor sector-specific momentum shifts more frequently.
7. Sector Rotation During Volatility: A Strategic Blueprint
Here’s a step-by-step method to implement sector rotation in turbulent markets:
Step 1: Assess the Macro Landscape
Identify triggers: inflation fears, war, rate hikes, global slowdown.
Use the VIX to gauge sentiment.
Read macro reports (GDP, CPI, FOMC statements).
Step 2: Identify Strong and Weak Sectors
Use RS charts and sector ETF performance.
Compare sector momentum on weekly vs daily charts.
Look at earnings revision trends across sectors.
Step 3: Allocate Capital Accordingly
Rotate into defensive sectors during extreme volatility.
Shift into cyclicals if signs of stabilization appear.
Reduce allocation to laggards or sectors facing earnings downgrades.
Step 4: Monitor and Adjust
Set trailing stop-losses.
Review sector performance weekly.
Be flexible—volatility often leads to false breakouts and sector whipsaws.
8. Quantitative vs. Discretionary Approaches
Quantitative Rotation strategies rely on algorithms using:
Momentum factors
Volatility filters
Moving averages (e.g., 20/50/200 DMA crossovers)
Mean reversion models
Discretionary Rotation is guided by human judgment—based on:
Economic interpretation
Technical chart patterns
News analysis
In volatile markets, combining both approaches (a hybrid model) often yields the best results.
9. Case Studies: Sector Rotations in Historical Volatile Periods
a) COVID Crash (Mar 2020)
Initial rotation into healthcare, consumer staples, and tech (WFH themes).
Energy, industrials, and financials lagged.
b) Russia-Ukraine War (2022)
Energy and defense stocks surged.
Growth sectors like tech underperformed.
Commodities and fertilizers saw capital inflows.
c) US Banking Crisis (Mar 2023)
Financials tanked.
Gold, utilities, and large-cap tech gained as safe havens.
Studying these rotations helps understand how volatility realigns capital.
10. Tools and Platforms for Sector Analysis
TradingView: Relative strength, custom indicators, overlay comparisons.
Finviz: Sector heatmaps, ETF flows.
StockCharts: RRG charts (Relative Rotation Graphs).
Thinkorswim / Zerodha Kite / Upstox Pro: Built-in sector performance analytics.
Morningstar / Bloomberg Terminal (for professionals): Deep sectoral earnings insights.
11. Common Mistakes in Sector Rotation
Overtrading: Rotating too frequently in choppy markets.
Late Entries: Chasing a sector after it’s already made big moves.
Ignoring Fundamentals: Rotation without checking macro alignment.
Single-Sector Bias: Getting stuck in “favorite” sectors despite data.
Timing Errors: Misjudging transitions between market phases.
12. Risk Management Strategies
Diversify across 2–4 sectors, not just one.
Use position sizing and sector allocation limits.
Set sector-specific stop-losses (based on volatility).
Avoid leveraged sector ETFs unless experienced.
Rebalance monthly or quarterly to lock in rotation gains.
13. Real-World Examples (Post-COVID, War, Recession Fears)
Post-COVID Recovery (2021)
Rotation from defensive to cyclicals.
Travel, hospitality, financials, and industrial stocks saw massive gains.
Inflation + War (2022)
Energy stocks (XLE), defense (RTX, LMT), and materials (XLB) surged.
Investors fled from growth (ARKK-style) to value sectors.
Recession & Rate Cuts Expectations (2024–2025)
Healthcare and staples outperformed.
Market started pricing in rate cuts, leading to a mini tech revival.
These patterns show that volatility leads to sector rotation, not blanket sell-offs.
14. Sector ETFs & Mutual Funds for Rotation
To implement rotation passively or semi-actively, investors can use:
Popular Sector ETFs (India/Global)
ETF Sector Exchange
XLF Financials NYSE
XLV Healthcare NYSE
XLU Utilities NYSE
XLE Energy NYSE
QQQ Tech-heavy NASDAQ
Nippon India ETF Consumption Consumer NSE
ICICI Prudential PSU Bank ETF Banking NSE
These tools help execute rotations cost-effectively and with liquidity.
15. Conclusion
Sector rotation in volatile markets is not about predicting, but adapting. It’s a dynamic, responsive approach that relies on:
Understanding macro trends
Analyzing sector performance
Staying agile with capital
In high-volatility environments, some sectors become capital magnets while others bleed out. A disciplined rotation strategy, backed by data and supported by risk management, can turn volatility from a threat into a powerful ally.
AI-Powered Algorithmic Trading Introduction
Algorithmic trading—once a secret weapon of elite hedge funds—has evolved dramatically over the past decade. The new frontier in this space is AI-powered algorithmic trading, where artificial intelligence, machine learning (ML), and deep learning algorithms are reshaping how markets are analyzed, trades are executed, and profits are optimized.
As financial markets become increasingly data-driven, traders are now leveraging AI to process billions of data points in real time, uncover hidden patterns, and make faster, more precise decisions. The rise of AI in trading isn’t just evolution—it’s a full-scale revolution.
This article explores the depths of AI-powered algorithmic trading, its core mechanisms, real-world applications, benefits, challenges, and its role in shaping the future of financial markets.
1. Understanding Algorithmic Trading
Algorithmic trading, also known as algo-trading or automated trading, uses computer programs to execute trades based on pre-defined instructions such as timing, price, volume, or other mathematical models.
Traditionally, these rules were hard-coded and relied on historical data and technical indicators. The goal? Eliminate human emotion, speed up execution, and exploit even the smallest market inefficiencies.
Key Benefits:
Faster trade execution
Reduced transaction costs
Improved accuracy and consistency
Lower human intervention
While algorithmic trading alone brought efficiency, adding AI takes it to a new level by making the system adaptive, predictive, and context-aware.
2. What Is AI-Powered Algorithmic Trading?
AI-powered algorithmic trading refers to the integration of artificial intelligence, machine learning, and natural language processing (NLP) into the trading algorithm’s decision-making process.
What Makes It Different?
Self-learning: AI systems can learn from data and adapt their models.
Real-time processing: Ability to handle massive data streams instantly.
Non-linear modeling: Understand complex relationships traditional algorithms can’t capture.
Rather than merely following pre-programmed rules, AI algorithms can observe, learn, and evolve, making them far superior in today’s volatile and complex markets.
3. How AI Transforms Trading Strategies
AI enhances every stage of the trading lifecycle:
a. Data Analysis
Structured data: Price, volume, technical indicators
Unstructured data: News articles, social media sentiment, earnings calls
AI can process these varied data types, allowing traders to identify signals that would otherwise remain hidden.
b. Signal Generation
Using ML models such as:
Decision Trees
Random Forest
Support Vector Machines (SVM)
Neural Networks
These models detect patterns and forecast potential price movements with high precision.
c. Trade Execution
AI algorithms optimize order routing using reinforcement learning. They adapt to changing liquidity, volatility, and bid-ask spreads to minimize slippage and transaction costs.
d. Risk Management
AI models assess risk dynamically, adjusting portfolio positions in real time based on:
VaR (Value at Risk)
Tail risk
Black swan events
Correlations across asset classes
4. Machine Learning Models in Trading
AI trading models typically rely on supervised, unsupervised, and reinforcement learning techniques.
a. Supervised Learning
Trained on labeled historical data to predict future outcomes:
Linear regression for price prediction
Classification models to label bullish or bearish signals
b. Unsupervised Learning
Used for anomaly detection, pattern discovery, and clustering:
Detecting fraud or irregular trading behavior
Grouping stocks with similar behavior (sector rotation)
c. Reinforcement Learning
The model learns through trial and error. It’s particularly useful in:
Trade execution strategies
Portfolio optimization
Dynamic hedging
Notably, reinforcement learning has been central to deep reinforcement learning bots—like those used by top quant hedge funds.
5. Natural Language Processing (NLP) in Trading
NLP is revolutionizing sentiment analysis and event-driven trading. AI systems can now:
Analyze financial news and extract sentiment
Scan Twitter feeds for market-moving chatter
Interpret central bank statements or earnings reports
Example:
A sentiment score can be assigned to a company based on news, which can then influence trade decisions. If positive sentiment coincides with technical strength, the system may go long.
6. Real-World Applications
AI-powered algorithmic trading is already used by:
a. Hedge Funds & Institutions
Firms like Renaissance Technologies, Two Sigma, Citadel, and Bridgewater use AI for market prediction and automated trading across equities, forex, and commodities.
b. Retail Trading Platforms
Platforms like QuantConnect, Kavout, and Trade Ideas offer AI-backed strategy builders for individual traders.
c. High-Frequency Trading (HFT)
AI reduces latency, improves arbitrage, and enhances quote-matching in microseconds.
d. Robo-Advisors
While not trading-focused, robo-advisors like Wealthfront or Betterment use AI for portfolio management, rebalancing, and tax-loss harvesting.
7. Case Studies: AI in Action
Case Study 1: JPMorgan’s LOXM
JPMorgan launched LOXM, an AI-powered trading engine, designed for high-speed execution of large equity trades in Europe. LOXM uses historical and real-time data to minimize market impact and improve execution quality.
Case Study 2: BlackRock’s Aladdin
BlackRock’s Aladdin platform uses AI to manage trillions in assets. It helps in portfolio risk assessment, trade execution, and compliance—all using AI-driven analytics.
Case Study 3: Sentiment-Based Trading at Bloomberg
Bloomberg terminals offer NLP-based sentiment scores derived from news headlines. These scores can be integrated into algorithmic models for smarter trade triggers.
8. Benefits of AI-Powered Trading
✅ Speed & Efficiency
AI can make trading decisions in milliseconds, faster than any human or traditional algorithm.
✅ Accuracy
AI improves signal-to-noise ratio by filtering out irrelevant data and focusing on predictive patterns.
✅ Emotion-Free Trading
AI doesn’t panic, overtrade, or get greedy. It sticks to statistical logic, improving consistency.
✅ Scalability
An AI model can be deployed across multiple assets, strategies, and geographies with minimal incremental cost.
✅ Adaptive Learning
AI continues to improve itself over time—something rule-based models can't do.
9. Challenges and Risks
Despite its promise, AI-powered trading faces several challenges:
❌ Black Box Problem
AI models, especially deep learning ones, lack transparency. Traders may not fully understand why a decision was made, which creates risk in highly regulated environments.
❌ Overfitting
AI can sometimes memorize historical patterns rather than generalize them, leading to poor real-world performance.
❌ Data Bias
Garbage in, garbage out. If the training data is flawed or biased, the model will inherit those flaws.
❌ Flash Crashes & Cascading Failures
AI systems can amplify volatility when multiple bots react simultaneously to the same signal, triggering flash crashes.
❌ Regulatory Scrutiny
Regulators are still catching up. The opacity and complexity of AI models raise concerns around market manipulation and unfair advantages.
10. The Future of AI in Trading
a. Explainable AI (XAI)
Future models will be more transparent and interpretable, helping traders understand decision-making and comply with regulations.
b. Quantum Computing Integration
Quantum algorithms may further accelerate AI model training, enabling real-time analysis of massive datasets.
c. AI-Powered ESG Trading
Traders are increasingly factoring in environmental, social, and governance (ESG) metrics. AI can analyze non-financial data like sustainability reports or social sentiment.
d. Democratization of AI Tools
No longer exclusive to hedge funds, AI trading platforms are being made accessible to retail traders, thanks to cloud computing and open-source frameworks.
e. Collaborative AI Models
Swarm AI or hybrid models combining human intuition with machine precision will likely define the next generation of trading.
Conclusion: The Future Is Now
AI-powered algorithmic trading is not a futuristic dream—it’s today’s reality. From institutional behemoths to nimble retail traders, those who embrace AI are gaining a decisive edge in markets that reward speed, insight, and adaptability.
But success doesn’t come just from deploying fancy models. It requires a deep understanding of both markets and machine learning, a robust data infrastructure, ethical practices, and a sharp eye for evolving risks.
GIFT Nifty & India's Global India is rapidly evolving into a financial powerhouse. A key player in this transformation is the Gujarat International Finance Tec-City (GIFT City)—India's first International Financial Services Centre (IFSC). At the heart of this strategic vision is GIFT Nifty, a rebranded and relocated version of the SGX Nifty (now moved from Singapore to India), aiming to establish India as a global hub for derivatives trading.
The significance of GIFT Nifty lies not just in its economic promise, but in its strategic importance. It’s India’s bold move to reclaim trading volumes, assert regulatory control, and attract global capital.
In this 3000-word comprehensive guide, we’ll explore:
What is GIFT Nifty?
GIFT City and IFSC explained
Why SGX Nifty moved to GIFT
Strategic benefits for India
Global derivatives market overview
GIFT Nifty’s trading ecosystem
Implications for investors and brokers
The road ahead: ambitions, hurdles, and potential
1. What is GIFT Nifty?
GIFT Nifty refers to the suite of derivative contracts based on the Nifty 50 index, now traded from GIFT City under NSE IX (NSE International Exchange). Previously, offshore investors traded these futures on the Singapore Exchange (SGX). But with a 2023 migration agreement, this liquidity pool has moved to India.
Key Features:
Launched on: July 3, 2023
Location: NSE IX, GIFT City, Gujarat
Instruments Traded: Nifty 50 Futures, Nifty Bank Futures, Nifty Financial Services Futures
Trading Hours: 21 hours a day (6:30 am to 2:45 am IST next day)
Settlement: In USD
This extended trading window allows global traders—especially in Europe and the US—to participate in Indian markets across time zones.
2. GIFT City and IFSC: A Quick Overview
GIFT City is a planned business district near Gandhinagar, Gujarat. It houses India’s only IFSC, designed to bring international financial services to India under relaxed regulatory and tax norms.
Objectives of GIFT IFSC:
Attract global banks, asset managers, and exchanges
Bring offshore trading volumes back to India
Create employment in high-skilled finance sectors
Develop India’s status as a global financial hub
Key Institutions Operating in GIFT IFSC:
NSE International Exchange (NSE IX)
BSE International Exchange (India INX)
Banks like HSBC, Barclays, Standard Chartered
Asset management firms and fintech companies
3. Why SGX Nifty Moved to GIFT City
The SGX Nifty was historically used by foreign investors to trade Indian equity futures outside of India. However, this led to a significant loss of volumes for Indian exchanges, limiting SEBI and RBI’s control over offshore derivatives.
Timeline of the Transition:
2018: NSE terminated licensing with SGX to curb offshore Nifty derivatives
2020: Legal battles led to regulatory interventions and negotiations
2022: SGX and NSE agree on a joint model under “Connect”
2023: Trading successfully migrates to GIFT City as GIFT Nifty
Strategic Benefits of Relocation:
Repatriates trading volumes to India
Strengthens SEBI’s oversight
Generates tax and trading revenue for India
Provides direct market access to global traders under Indian regulation
This shift marks a historic realignment in India’s financial architecture.
4. Strategic Benefits for India
GIFT Nifty and the broader IFSC model provide multiple strategic, financial, and geopolitical advantages.
A. Financial Sovereignty
India no longer needs to rely on foreign exchanges to price its key index futures. GIFT City allows regulatory oversight by Indian bodies like IFSC Authority (IFSCA).
B. Tax Incentives
Entities in GIFT IFSC enjoy:
Zero GST on services
No STT (Securities Transaction Tax)
No Long-Term Capital Gains tax
100% income tax exemption for 10 years out of 15
This makes GIFT extremely competitive with Singapore, Dubai, or London.
C. Boost to Employment and Infrastructure
GIFT aims to create over 1 million jobs in the long run in finance, IT, and services. The city is planned with smart infrastructure and green architecture to attract global institutions.
D. Geo-Financial Influence
By hosting global derivatives trading domestically, India is:
Asserting its place in global capital markets
Reducing reliance on foreign jurisdictions
Offering an India-centric platform to foreign funds, hedge funds, and prop desks
5. Global Derivatives Market Context
To understand GIFT Nifty’s ambition, one must grasp the global derivatives landscape.
Global Stats (as of 2024):
Total global derivatives notional value: $700+ trillion
Top venues: CME (USA), Eurex (Germany), ICE (UK/US), HKEX (Hong Kong), SGX (Singapore)
Growing trend: Regional exchanges developing local liquidity pools (e.g., Saudi Tadawul, Shanghai FTZ)
India’s Challenge:
Before GIFT Nifty, ~80-85% of Nifty futures trading volume was offshore, mainly on SGX. This weakened India’s price discovery and revenue generation.
With GIFT Nifty, India can finally "onshore the offshore".
6. GIFT Nifty’s Trading Ecosystem
Key Participants:
Proprietary trading firms
Foreign Portfolio Investors (FPIs)
Market makers & HFT firms
Domestic brokers with IFSC arms
Custodians & clearing corporations
Trading Advantages:
USD-denominated contracts – removes INR volatility risk
Cross-margining – reduces capital requirements
Interoperable clearing via ICCL
Low latency infrastructure – critical for HFTs
International settlement rules – aligned with global practices
Products Available:
Product Ticker Lot Size Contract Cycle
Nifty 50 Futures GIFT Nifty 20 3 months rolling
Nifty Bank Futures GIFT Bank 15 3 months
Nifty Financial Services GIFT Fin 40 3 months
Trading Hours:
Session 1: 06:30 am – 03:40 pm IST
Session 2: 04:35 pm – 02:45 am IST next day
This 21-hour window overlaps with Asia, Europe, and US markets, ensuring broad participation.
7. Implications for Investors and Brokers
For Indian Brokers:
Can set up subsidiaries in GIFT IFSC
Access foreign investors who previously traded via SGX
Build relationships with global prop desks and hedge funds
For Foreign Investors:
One-stop access to Indian derivatives
Trade in USD, with regulatory clarity
Lower costs due to tax exemptions
Seamless arbitrage with Indian domestic Nifty futures
For Indian Institutions:
Repatriated liquidity boosts domestic confidence
Arbitrage opportunities between NSE and NSE IX
Greater transparency in pricing and volume data
8. The Road Ahead: Ambitions, Hurdles & Potential
India’s Bigger Vision:
GIFT City is more than just about Nifty futures. It aims to:
Be a full-spectrum international finance hub
Host offshore bonds, forex markets, fund management
Create an Indian version of Wall Street
Upcoming Developments:
Launch of Single Stock Derivatives
Listing of Indian Depository Receipts (IDRs)
Increased participation from global custodians and asset managers
Development of AI-powered trading, fintech sandboxes, and tokenized securities
Challenges Ahead:
Liquidity Migration: While SGX traders are slowly shifting to GIFT, full adoption will take time.
Infrastructure Maturity: Competing with global giants like CME or Eurex requires top-tier speed, uptime, and reliability.
Global Trust: Foreign investors must feel secure trading under Indian regulations.
Talent Pool: India needs more skilled professionals trained in global finance standards.
Geopolitical Opportunity:
As global capital moves away from politically uncertain geographies (e.g., Hong Kong, China), GIFT can position itself as:
A neutral, democratic, regulated hub
A bridge between East and West
Conclusion: India’s GIFT to the World
GIFT Nifty is not merely a product—it’s a symbol of India’s global financial ambition. From being a passive participant in offshore derivatives trading, India is now setting the stage to lead. GIFT City is the vehicle, and GIFT Nifty is the spearhead.
This strategic convergence of regulatory reform, infrastructure investment, and global ambition puts India in the league of emerging financial centers like Dubai, Hong Kong, and Singapore.

AI-Powered Algorithmic TradingIntroduction
Financial markets are evolving faster than ever. Amidst volatile price action, split-second decisions, and the growing complexity of data, AI-powered algorithmic trading has emerged as a game-changer. No longer limited to Wall Street giants, this technology is now reshaping how institutions, hedge funds, and even retail traders operate.
In this article, we’ll take a deep dive into what AI-powered algorithmic trading is, how it works, the technologies behind it, its benefits and risks, and what the future holds for this rapidly growing field.
1. What is AI-Powered Algorithmic Trading?
Algorithmic trading, also known as algo trading, refers to the use of pre-programmed instructions or algorithms to execute trades. These algorithms are based on various parameters such as price, volume, timing, or other mathematical models.
When combined with Artificial Intelligence (AI) and Machine Learning (ML), these trading systems evolve to become smarter and more adaptive. They can analyze vast datasets, learn from past patterns, adapt to changing market dynamics, and make autonomous trading decisions without human intervention.
In simple terms: AI-powered trading doesn’t just follow rules—it learns, adapts, and evolves.
2. Core Components of AI-Powered Algo Trading
To understand how AI-powered trading works, let’s break down its key components:
a. Algorithms
These are step-by-step instructions for performing trading tasks. They include strategies like mean reversion, trend following, momentum, arbitrage, etc.
b. Artificial Intelligence (AI)
AI allows the system to "think" like a human trader. It can make decisions based on real-time and historical data, even in uncertain or volatile conditions.
c. Machine Learning (ML)
ML models analyze historical data to identify patterns. These models improve over time through training and backtesting.
d. Natural Language Processing (NLP)
Used to analyze news articles, earnings calls, tweets, and other textual content to gauge market sentiment.
e. Big Data & Alternative Data
AI systems process both traditional data (price, volume) and alternative data (social media, satellite images, weather data, etc.) to gain a competitive edge.
3. How AI Algo Trading Works
Let’s walk through the typical process:
Step 1: Data Collection
Market data (price, volume, order book)
Fundamental data (financial statements, earnings)
Alternative data (news, social media, weather)
Step 2: Data Preprocessing
Cleaning and normalizing data to remove noise.
Feature engineering to identify key indicators or patterns.
Step 3: Model Training
Using ML algorithms like decision trees, neural networks, or reinforcement learning.
Backtesting against historical data to test the strategy’s performance.
Step 4: Strategy Deployment
The AI model goes live and starts executing trades.
Models adjust dynamically to new market conditions.
Step 5: Performance Monitoring & Optimization
Regularly track metrics like Sharpe ratio, win rate, drawdown, etc.
Continuously retrain the model with new data.
4. Key AI Techniques Used in Trading
a. Supervised Learning
Algorithms learn from labeled historical data.
Used for predicting price movements, stock returns, etc.
b. Unsupervised Learning
Detects hidden patterns or clusters in data.
Used for anomaly detection, regime shifts, market segmentation.
c. Reinforcement Learning
The AI "agent" learns by interacting with the environment.
Used for optimal order execution and dynamic strategy selection.
d. Deep Learning
Involves neural networks with multiple layers.
Can recognize complex, nonlinear relationships in price action.
5. Common AI Trading Strategies
1. Sentiment-Based Trading
Uses NLP to analyze news headlines, social media, analyst reports.
Determines whether the overall sentiment is bullish or bearish.
2. Statistical Arbitrage
Finds pricing inefficiencies between correlated assets using AI.
AI can execute thousands of trades per second to capture micro profits.
3. Momentum & Trend Following
AI models detect sustained price trends and ride the momentum.
Often used with technical indicators like moving averages or RSI.
4. High-Frequency Trading (HFT)
Involves extremely fast trades using AI-powered systems.
Profits are made on minuscule price changes across thousands of trades.
5. Mean Reversion
AI identifies assets that deviate from historical norms and expects a reversion.
Works well in range-bound markets.
6. Advantages of AI in Algorithmic Trading
✅ Speed and Efficiency
AI systems can analyze millions of data points in seconds and execute trades faster than humans can blink.
✅ Emotionless Trading
AI removes human biases like fear, greed, and overconfidence. It sticks to the strategy with discipline.
✅ Scalability
AI can manage hundreds of trading strategies and thousands of assets simultaneously across global markets.
✅ Adaptive Learning
Unlike static models, AI-based systems adapt to new market regimes, breaking news, and evolving trends.
✅ Backtesting and Risk Management
AI can simulate thousands of market scenarios to stress test strategies and optimize risk-reward profiles.
The Future of AI in Trading
Here’s what the future likely holds:
🔮 Real-Time AI Decision-Making
AI will increasingly be used not just for execution but for strategy generation in real time.
🔮 Explainable AI (XAI)
Efforts are underway to make AI decision-making more transparent and interpretable to regulators and users alike.
🔮 Quantum AI Trading
As quantum computing matures, it could take algorithmic trading to a whole new level—analyzing vast datasets in milliseconds.
🔮 AI in Decentralized Finance (DeFi)
AI is now being explored in crypto and DeFi ecosystems to enhance automated trading, risk assessment, and portfolio balancing.
Getting Started: Tools for Aspiring AI Traders
If you're interested in building your own AI trading system, here are some tools and platforms:
👨💻 Programming Languages
Python (most popular)
R
C++ (for high-speed systems)
🧠 AI Libraries
TensorFlow, PyTorch, Scikit-learn, Keras
📊 Backtesting Platforms
QuantConnect
Backtrader
Zipline
📈 Data Providers
Alpaca, Polygon.io, Yahoo Finance, Quandl
Conclusion
AI-powered algorithmic trading is no longer a futuristic concept—it’s the present and rapidly becoming the norm in financial markets. From hedge funds to retail traders, those who leverage AI effectively are gaining a decisive edge.
However, it's not a magic wand. While AI brings speed, efficiency, and adaptability, it also introduces complexity, risk, and ethical questions.
Volume Profile & Market Structure AnalysisIntroduction
In the dynamic world of financial markets, traders constantly seek tools and methodologies that provide an edge. Two powerful and complementary concepts in technical analysis are Volume Profile and Market Structure Analysis. Together, they offer a multi-dimensional view of market behavior, revealing where market participants are most active and how price reacts at key levels.
This guide dives deep into both tools, explaining their principles, interrelation, and how traders can practically apply them to enhance trade decisions.
Part 1: Understanding Volume Profile
What Is Volume Profile?
Volume Profile is an advanced charting study that shows trading activity over a specified time period at specified price levels. Unlike traditional volume indicators that display volume by time (per bar), Volume Profile displays volume by price.
It helps traders understand:
Where the majority of trading volume occurred
Which prices attracted the most attention
Potential support and resistance zones
Key Components of Volume Profile
Point of Control (POC):
The price level with the highest traded volume during the selected period. It indicates the fairest price—where buyers and sellers agreed the most.
High Volume Nodes (HVN):
Areas where volume spikes significantly. These zones often act as magnets for price.
Low Volume Nodes (LVN):
Areas with little trading activity. Price tends to reject these zones or move through them quickly due to lack of interest.
Value Area (VA):
The price range within which 70% of volume was traded. It gives a sense of where the market believes value lies.
Volume Profile Shapes:
D-shape (Balanced Market): Even distribution around the POC. Expect range-bound behavior.
P-shape (Bullish Profile): Indicates short covering or accumulation.
b-shape (Bearish Profile): Reflects long liquidation or distribution.
Benefits of Volume Profile
Highlights institutional activity zones
Defines precise entry/exit areas
Identifies strong support/resistance
Filters out low-probability trades
Part 2: Understanding Market Structure Analysis
What Is Market Structure?
Market Structure is the framework of how price moves—trending, consolidating, breaking out, or reversing. It defines the pattern of highs and lows and helps determine the overall direction of the market.
Key Elements of Market Structure
Swing Highs and Lows:
Higher Highs (HH) and Higher Lows (HL): Uptrend
Lower Highs (LH) and Lower Lows (LL): Downtrend
Break of Structure (BoS):
A significant break of a previous swing high or low, signaling trend continuation or change.
Change of Character (ChoCh):
The first signal that a trend may reverse. For example, in an uptrend, if the price fails to make a higher high and drops below the last higher low.
Liquidity Zones:
Areas where stop-loss orders are commonly placed. These can become targets for price.
Order Blocks:
Last bullish/bearish candle before a strong move. These are often zones of institutional entries.
Market Phases:
Accumulation: Range-bound price action at the bottom.
Markup: Uptrend begins.
Distribution: Price consolidates near the top.
Markdown: Downtrend follows.
Part 3: Combining Volume Profile with Market Structure
Why Combine Both?
Used together, Volume Profile and Market Structure offer a layered understanding of price action. While market structure defines the direction and nature of price moves, Volume Profile identifies the strength and conviction behind those moves.
Synergistic Insights
Validating Breakouts with Volume:
A break of market structure (BoS) with high volume at the breakout level (confirmed by Volume Profile) is more reliable.
Refining Entry/Exit:
Use order blocks and structure points to define trade direction; Volume Profile helps fine-tune entry within these zones.
Avoiding False Moves:
Price may appear to break a structure but returns if there’s no volume support—Volume Profile helps filter these traps.
Identifying Smart Money Activity:
Institutions often build positions at HVNs and manipulate price around LVNs. Structure helps spot their intent; volume confirms their footprints.
Part 4: Practical Trading Applications
1. Trading Reversals
Strategy:
Identify a ChoCh (change of character)
Validate with low volume at new highs/lows (showing exhaustion)
Look for entry at the order block aligned with the Value Area Low (VAL) or High (VAH)
Example:
In an uptrend, a lower high forms and breaks the prior higher low. Volume Profile shows declining volume at new highs → Confirm reversal.
2. Trading Breakouts
Strategy:
Wait for price to break a consolidation zone
Ensure breakout happens through LVN (low resistance)
Confirm increasing volume above POC
Entry:
Retest of broken zone aligned with order block or POC.
3. Trend Continuation (Pullback Entries)
Strategy:
Identify trending market using HH/HL or LL/LH
Wait for pullback to HVN or Value Area
Look for confluence with bullish/bearish order block
Confirmation:
Rejection candle with volume absorption at the node.
4. Scalping in Ranges
Strategy:
Use intraday Volume Profile to define value area
Fade moves from VAH to VAL (range-bound play)
Confirm with microstructure shifts (e.g., lower time frame ChoCh)
Part 5: Advanced Concepts
1. Volume Profile Timeframes
Daily/Weekly Profiles: Best for swing trades.
Intraday (15m/30m): Best for day trading and scalping.
2. Volume Profile vs TPO Profile
TPO (Time Price Opportunity) adds time dimension (Market Profile)
Volume Profile is volume-focused—better for spotting real order flow
3. Liquidity Sweeps and Smart Money
Price often sweeps above a swing high to trigger stops, then reverses
Volume Profile helps spot whether the sweep was real (high volume) or a fakeout (low volume)
4. Auction Market Theory
Market is an auction: buyers and sellers find value via volume
Imbalance leads to trend, balance leads to consolidation
Part 6: Tools & Platforms for Volume Profile & Market Structure
Popular Platforms
TradingView: Has built-in volume profile tools (fixed range, visible range)
Sierra Chart & NinjaTrader: Advanced volume analysis
ThinkOrSwim: Offers Volume Profile and Market Profile
Bookmap: For real-time order flow + volume bubbles
Recommended Indicators
Volume Profile (fixed/visible)
Session Volume (for intraday)
Market Structure tools (e.g., Swing High/Low auto-detection)
Order Block indicators (custom or manual markups)
Conclusion
Volume Profile and Market Structure Analysis are individually powerful but together form a holistic trading approach that aligns price, volume, and institutional behavior. Mastering these tools allows traders to:
Identify high-probability trade zones
Detect institutional footprints
Avoid false breakouts
Time entries and exits with greater precision
As with any strategy, the key is practice, backtesting, and developing a system that fits your risk tolerance and trading style. Combined, these tools offer a potent framework for navigating modern markets with clarity and confidence.

Part4 Institution Trading Types of Options
American vs. European Options
American Options: Can be exercised anytime before expiry.
European Options: Can only be exercised at expiry.
Index Options vs. Stock Options
Stock Options: Based on individual stocks (e.g., Reliance, Infosys).
Index Options: Based on indices (e.g., Nifty, Bank Nifty).
Weekly vs. Monthly Options
Weekly Options: Expire every Thursday (India).
Monthly Options: Expire on the last Thursday of the month.
