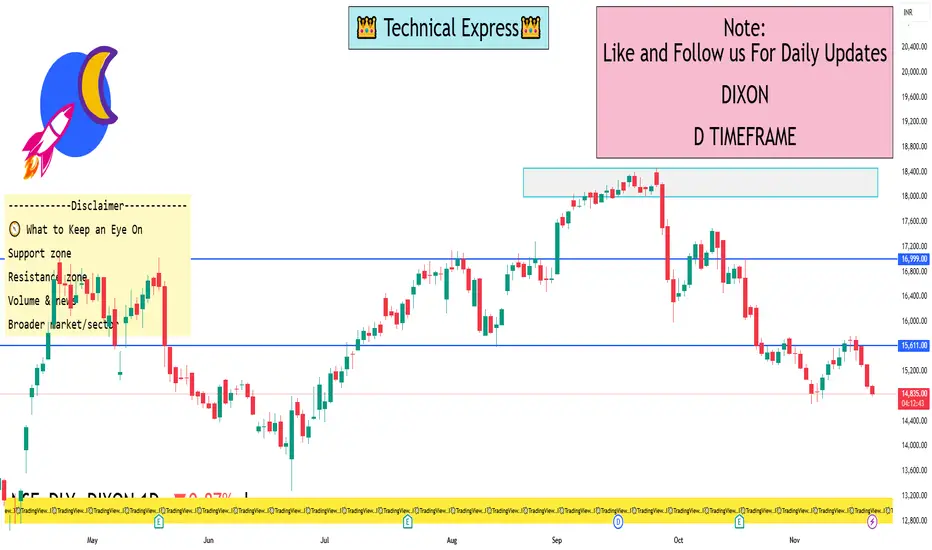
DIXON 1 Day Time Frame 🔍 Price & Pivot Levels to Watch
1. Latest live price: ~ ₹14,825 (as of intraday in India) from Groww.
2. Pivot levels (classic) for the day (based on Moneycontrol data):
Pivot ~ ₹15,065
S1 ~ ₹14,820
R1 ~ ₹15,209
3. Key moving-average resistances:
50-day SMA ~ ₹15,578 (price is below)
200-day SMA ~ ~₹15,738 – ~₹15,789 range (price is well below).
🧭 What to Keep an Eye On
Support zone: Near the S1 pivot (~₹14,820) and possibly the intra-day low zone (~₹14,700-14,800)
Resistance zone: The pivot (~₹15,065) and then R1 (~₹15,209) and the nearby moving averages (~₹15,500-15,600)
Volume & news: A sharp uptick in volume or a positive corporate/catalyst event could change the short-term dynamic.
Broader market/sector: Since Dixon is in electronics manufacturing, macro sentiment, export incentives, and input cost changes matter.
Teslamotors
Part 8 Trading Master ClassIntroduction to Options
Financial markets provide several instruments to trade and invest. Among equities, futures, commodities, and currencies, options trading has gained significant popularity worldwide, including India. Options are not just speculative tools; they are also powerful instruments for hedging, income generation, and risk management.
An option is essentially a derivative contract—its value is derived from an underlying asset like a stock, index, commodity, or currency. Unlike direct stock ownership, an option gives the buyer rights but not obligations. This unique feature makes them versatile but also complex for beginners.
To truly master options, one must understand not only the basic definitions but also pricing, market psychology, and strategies.
Basic Terminology
Before diving deeper, let’s go through the essential terms:
Option Contract: Agreement between buyer and seller based on an underlying asset.
Underlying Asset: Stock, index, commodity, or currency.
Strike Price: Pre-decided price at which the option can be exercised.
Expiry Date: The last date on which the option can be exercised.
Premium: Price paid by the buyer to acquire the option.
Lot Size: Minimum quantity for which an option can be traded.
European vs. American Options: European can be exercised only on expiry; American anytime before expiry.
Call & Put Options Explained
At the heart of option trading are two instruments: Calls and Puts.
Call Option: Gives the buyer the right (not obligation) to buy the asset at the strike price.
Buyers expect prices to rise.
Sellers (writers) expect prices to stay flat or fall.
Put Option: Gives the buyer the right (not obligation) to sell the asset at the strike price.
Buyers expect prices to fall.
Sellers expect prices to stay flat or rise.
📌 Example:
If Reliance stock trades at ₹2500:
A ₹2600 call may cost ₹50 premium. If the stock rises to ₹2700, profit = (2700-2600-50) = ₹50 per share.
A ₹2400 put may cost ₹40. If stock falls to ₹2200, profit = (2400-2200-40) = ₹160 per share.

Impact of Rupee-Dollar Exchange Rate on Indian StocksIntroduction
The stock market is a complex system where numerous factors—both domestic and global—interact to determine price movements. One such crucial factor is the exchange rate between the Indian Rupee (INR) and the US Dollar (USD). The Rupee-Dollar exchange rate plays a vital role because the US Dollar is the world’s reserve currency, the primary medium of global trade, and a benchmark for financial transactions worldwide.
In India, the economy is deeply interconnected with global trade, capital flows, and financial markets. Any change in the value of the Rupee against the Dollar has wide-ranging implications on businesses, investors, and the stock market. Companies that import raw materials or export finished goods, sectors like Information Technology (IT), Pharmaceuticals, Oil & Gas, Banking, Aviation, and even Foreign Institutional Investors (FIIs), are directly influenced by these fluctuations.
This essay explores in detail how the Rupee-Dollar exchange rate impacts Indian stocks, covering the theoretical background, sectoral influences, investor behavior, macroeconomic effects, and real-world case studies.
Understanding the Rupee-Dollar Exchange Rate
The exchange rate refers to how much one unit of a currency is worth in terms of another. In India, the exchange rate most closely tracked by investors is INR/USD—the number of Rupees required to buy one US Dollar.
If 1 USD = ₹80, it means that importing something worth $1 will cost ₹80 in India.
If the Rupee depreciates (falls in value), say 1 USD = ₹85, imports become more expensive, but exporters receive more Rupees for the same Dollar earnings.
If the Rupee appreciates (gains in value), say 1 USD = ₹75, imports become cheaper, but exporters earn fewer Rupees per Dollar.
This constant push-and-pull directly influences corporate profitability and, in turn, the stock market.
Why Does the Rupee Move Against the Dollar?
The exchange rate fluctuates due to a combination of domestic and global factors:
Demand & Supply of Dollars – If India imports more than it exports, demand for Dollars rises, weakening the Rupee.
Foreign Institutional Investment (FII) Flows – When FIIs invest in Indian equities, they bring in Dollars, strengthening the Rupee. Conversely, when they pull out, the Rupee weakens.
Interest Rate Differentials – Higher interest rates in the US attract global investors, increasing demand for Dollars.
Crude Oil Prices – India is heavily dependent on crude imports. Rising oil prices increase Dollar demand, weakening the Rupee.
Geopolitical Events – Wars, sanctions, and global economic slowdowns push investors toward the Dollar as a "safe haven."
Inflation & Growth Rates – Higher inflation in India compared to the US reduces the Rupee’s purchasing power.
These factors cause daily volatility in the Rupee-Dollar exchange rate, impacting stock prices.
The Link Between Exchange Rate and Stock Market
The Rupee-Dollar relationship influences stocks in three broad ways:
Corporate Earnings Impact – Companies that earn or spend in Dollars see changes in profitability.
Foreign Investor Behavior – FIIs track currency stability before investing in emerging markets like India.
Macroeconomic Sentiment – A stable Rupee improves confidence, while sharp depreciation raises concerns about inflation, current account deficit, and fiscal health.
Sector-Wise Impact of Rupee-Dollar Exchange Rate
1. Information Technology (IT) Sector
Indian IT companies like TCS, Infosys, Wipro, and HCL earn the majority of their revenue in Dollars by exporting software services to the US and Europe.
A weak Rupee is positive for IT stocks since they earn more Rupees for the same Dollar revenue.
Example: If Infosys earns $1 billion, at ₹80/USD revenue = ₹80,000 crore. If Rupee falls to ₹85/USD, revenue = ₹85,000 crore (without increasing actual Dollar earnings).
Impact: Rupee depreciation → IT stocks rally. Rupee appreciation → IT stocks face margin pressure.
2. Pharmaceutical Sector
Similar to IT, Pharma companies like Sun Pharma, Dr. Reddy’s, and Cipla export a large share of medicines to the US.
A weak Rupee boosts export revenues, but import costs (like Active Pharmaceutical Ingredients from China) may rise.
Impact: Net positive for export-oriented pharma firms, but mixed for those heavily dependent on imports.
3. Oil & Gas Sector
India imports over 80% of its crude oil needs, priced in Dollars.
A weak Rupee makes oil imports costlier, increasing input costs for companies like IOC, BPCL, HPCL.
This also impacts sectors like aviation, paints, fertilizers, and chemicals, which rely on crude derivatives.
Impact: Rupee depreciation hurts oil & gas and related sectors.
4. Aviation Industry
Airlines like IndiGo, SpiceJet, and Air India earn revenue in Rupees but pay for aircraft leases, maintenance, and fuel in Dollars.
A weak Rupee increases costs significantly, leading to lower margins.
Impact: Rupee depreciation is negative for aviation stocks.
5. Banking & Financial Services
Banks with significant foreign borrowings may face higher repayment costs when the Rupee falls.
However, if they hold Dollar assets, they benefit.
Investor sentiment in the financial sector often mirrors overall macroeconomic stability tied to currency movements.
6. Import-Oriented Companies
Sectors like electronics, automobiles, FMCG (raw materials), and chemicals rely on imports.
A weaker Rupee raises raw material costs, compressing margins unless passed on to consumers.
7. Export-Oriented Manufacturing
Sectors like textiles, gems & jewelry, and leather benefit from a weaker Rupee as global buyers pay in Dollars.
However, if raw materials are imported, the benefits get diluted.
Impact on Foreign Investors
Foreign Institutional Investors (FIIs) are among the biggest drivers of the Indian stock market.
Stable Rupee: Encourages FIIs to invest since currency risk is lower.
Weakening Rupee: Even if stock returns are strong, FIIs may lose money when converting Rupees back to Dollars.
Example: If Nifty rises 10% but the Rupee falls 8% against the Dollar, FIIs net only ~2% returns.
Sudden depreciation often triggers FII outflows, leading to stock market corrections.
Thus, exchange rate stability is as important as stock fundamentals in attracting foreign capital.
Macroeconomic Effects on Stock Market
Inflation: A weak Rupee increases import costs (oil, electronics, machinery), leading to inflation. High inflation reduces corporate margins and consumer demand, pressuring stocks.
Current Account Deficit (CAD): Higher import bills widen CAD, weakening investor confidence.
Government Fiscal Position: Subsidy burdens (fertilizers, fuel) rise with Dollar appreciation, impacting fiscal deficit and bond yields, indirectly affecting equities.
Monetary Policy: RBI may raise interest rates to defend the Rupee, impacting borrowing costs and stock valuations.
The Way Forward
India’s growing integration into the global economy ensures that the Rupee-Dollar dynamic will continue to influence stocks. Key trends to watch:
US Federal Reserve policies – Dollar movements globally.
Energy Transition – Reducing oil imports will lower currency vulnerability.
Boosting Exports – Government initiatives like PLI schemes strengthen export-led sectors.
RBI Interventions – Maintaining stability via forex reserves.
Conclusion
The Rupee-Dollar exchange rate is more than just a number—it’s a reflection of India’s economic health, trade balance, and global investor confidence. Its impact on the stock market is far-reaching:
Exporters like IT and Pharma gain from Rupee weakness.
Import-heavy sectors like oil, aviation, and FMCG suffer.
Investors—both domestic and foreign—adjust portfolios based on currency trends.
Macroeconomic stability is closely linked to exchange rate dynamics.
For stock market participants, understanding this relationship provides an edge in making informed investment decisions. In the long run, India’s structural reforms, increasing exports, and growing financial depth may reduce vulnerability to Rupee-Dollar volatility. Until then, every swing in the currency will continue to ripple across Dalal Street.
Emerging Sectors in India1. Information Technology & Digital Economy
India’s IT sector has been the backbone of its global image for decades. But the story is evolving. It’s no longer just about outsourcing or call centers; today, India is building entire digital ecosystems. Cloud computing, SaaS (Software as a Service), big data analytics, and cybersecurity are driving a new phase of IT growth.
The adoption of 5G, Artificial Intelligence (AI), and Internet of Things (IoT) is expanding opportunities for IT firms. With global businesses increasingly looking for digital transformation partners, Indian IT companies like Infosys, TCS, Wipro, and HCL are evolving from service providers into strategic partners.
Moreover, India’s digital economy is expected to reach $1 trillion by 2030, with growth driven by digital payments, e-commerce, and digital infrastructure.
2. Fintech & Digital Payments
India has become a global leader in digital payments. The success of UPI (Unified Payments Interface) is a case study for the world, processing billions of transactions every month. Startups like PhonePe, Paytm, BharatPe, and Razorpay are revolutionizing how money moves across the economy.
Beyond payments, fintech innovation includes:
Digital lending platforms
Insurtech solutions
WealthTech & robo-advisory
Blockchain-based financial services
Government initiatives like Jan Dhan Yojana, Digital India, and financial inclusion policies have enabled fintech adoption even in rural India. By 2030, India’s fintech industry could surpass $200 billion in revenues.
3. E-commerce & Online Marketplaces
E-commerce is one of the fastest-growing consumer-facing sectors. With the world’s largest youth population and rising internet penetration, platforms like Amazon, Flipkart, Meesho, and Nykaa are driving a retail revolution.
Key drivers:
Growing middle-class consumption
Rapid adoption of online grocery & fashion retail
Expansion of logistics and supply chain tech
Rise of social commerce & direct-to-consumer (D2C) brands
By 2030, India’s e-commerce market is projected to reach $350–400 billion, making it the third-largest in the world after China and the US.
4. Electric Vehicles (EVs) & Green Mobility
India’s transportation sector is undergoing a green transformation. With rising pollution levels and energy dependence on oil imports, electric mobility has become a national priority.
Key developments:
Government subsidies under FAME (Faster Adoption and Manufacturing of Hybrid and Electric Vehicles)
PLI scheme for EV batteries
Entry of global players like Tesla (expected)
Domestic innovation by Ola Electric, Ather Energy, and Tata Motors
EV adoption in two-wheelers, buses, and delivery fleets is picking up faster than passenger cars, given India’s cost-sensitive market. By 2030, EVs could form 30% of all vehicle sales in India.
5. Renewable Energy & Clean Tech
India is one of the world’s largest consumers of energy. To reduce fossil fuel dependency, the government has set ambitious renewable energy targets: 500 GW of renewable capacity by 2030.
Solar and wind power dominate, but new areas like green hydrogen, battery storage, and waste-to-energy are gaining attention. Companies like Adani Green, ReNew Power, and NTPC are spearheading massive renewable projects.
With global ESG (Environmental, Social, Governance) investments rising, India’s renewable energy sector could attract trillions in foreign investment over the next two decades.
6. Biotechnology & Healthcare Innovation
India’s pharmaceutical industry is already known as the “pharmacy of the world”, but biotechnology and healthcare innovation are expanding the sector further.
Emerging areas:
Gene therapy and personalized medicine
Biotechnology in agriculture and food security
Telemedicine and digital health platforms
Medical devices and diagnostics
Startups in health-tech (Practo, 1mg, PharmEasy) are bridging gaps in healthcare access. With rising health awareness and global demand, India’s biotech industry could reach $150 billion by 2025.
7. EdTech (Education Technology)
India has one of the largest student populations in the world, creating huge demand for quality education. EdTech platforms like Byju’s, Unacademy, Vedantu, and PhysicsWallah are transforming how students learn.
Key innovations:
Live online classes
AI-based personalized learning
Skill development & upskilling platforms
AR/VR-based immersive education
Though growth slowed after the pandemic boom, long-term demand for hybrid and skill-focused education will keep EdTech a strong emerging sector.
8. Agritech & Food Processing
Agriculture still employs 40% of India’s workforce, but productivity is low. Agritech startups are using AI, IoT, blockchain, and drones to modernize farming.
Examples:
DeHaat, Ninjacart (farm-to-market supply chains)
Stellapps (dairy tech)
AgroStar (input advisory & marketplace)
Meanwhile, food processing is gaining momentum, with India moving from raw produce to value-added exports. This sector could generate millions of jobs and boost farmers’ income significantly.
9. Space Technology & Satellite Services
India’s space sector, led by ISRO, is opening up to private players. With the success of Chandrayaan-3 and Aditya-L1, global attention is on India’s space tech.
Private startups like Skyroot, Agnikul Cosmos, and Pixxel are innovating in satellite launch services, earth observation, and space-based applications.
The government’s IN-SPACe policy and privatization efforts could turn India into a global hub for affordable space technology.
10. Artificial Intelligence, Robotics & Automation
AI and automation are transforming multiple industries, from finance to healthcare to manufacturing. India’s AI market is expected to reach $17 billion by 2027.
Applications include:
AI in customer service (chatbots, voice assistants)
Robotics in manufacturing and logistics
AI-driven medical imaging
Smart cities and predictive governance
Indian IT and startups are actively adopting AI tools, with government initiatives supporting skill development in this field.
Conclusion
India stands at a historic crossroads. The emerging sectors described above are not just industries – they represent the aspirations of a young, ambitious nation aiming for global leadership. With strong policy support, rapid digital adoption, and entrepreneurial energy, India is building the foundations of a $5–10 trillion economy.
While challenges remain, the direction is clear: India’s growth story will be powered by emerging sectors that combine innovation, sustainability, and inclusivity.

Bond & Fixed Income Trading1. Understanding Bonds and Fixed Income Instruments
1.1 What is a Bond?
A bond is a debt security issued by an entity to raise capital. When you buy a bond, you are lending money to the issuer in exchange for:
Coupon Payments: Fixed or floating interest paid periodically (semiannual, annual, or quarterly).
Principal Repayment: The face value (par value) paid back at maturity.
Example: A government issues a 10-year bond with a face value of $1,000 and a coupon rate of 5%. Investors will receive $50 annually for 10 years, and then $1,000 back at maturity.
1.2 Key Features of Bonds
Issuer: Government, municipality, or corporation.
Maturity: The time until the bondholder is repaid (short-term, medium-term, or long-term).
Coupon Rate: Interest rate, which can be fixed or floating.
Yield: Effective return on the bond based on price, coupon, and time to maturity.
Credit Rating: Issuer’s creditworthiness (AAA to junk).
1.3 Types of Fixed Income Securities
Government Bonds – Issued by national governments (e.g., U.S. Treasuries, Indian G-Secs).
Municipal Bonds – Issued by states or local governments.
Corporate Bonds – Issued by companies to finance projects or operations.
Zero-Coupon Bonds – Sold at discount, pay no interest, only face value at maturity.
Floating Rate Bonds – Coupons tied to a benchmark (like LIBOR, SOFR, or repo rate).
Inflation-Linked Bonds – Adjust coupons or principal with inflation (e.g., U.S. TIPS).
High-Yield (Junk) Bonds – Higher risk, lower credit quality, higher yields.
Convertible Bonds – Can be converted into equity shares.
Sovereign Bonds (Global) – Issued by foreign governments, sometimes in hard currencies like USD or EUR.
2. The Bond Market Structure
2.1 Primary Market
Issuers sell new bonds directly to investors through auctions, syndications, or private placements.
Governments usually conduct auctions.
Corporates issue via investment banks underwriting the debt.
2.2 Secondary Market
Once issued, bonds are traded among investors. Unlike stocks, most bond trading occurs over-the-counter (OTC) rather than centralized exchanges. Dealers, brokers, and electronic platforms facilitate these trades.
2.3 Market Participants
Issuers: Governments, municipalities, corporations.
Investors: Retail investors, pension funds, mutual funds, hedge funds, insurance companies.
Dealers & Brokers: Market makers providing liquidity.
Credit Rating Agencies: Provide credit ratings (Moody’s, S&P, Fitch).
Regulators: Ensure transparency (e.g., SEC in the U.S., SEBI in India).
3. Bond Pricing and Valuation
Bond trading revolves around pricing and yield analysis.
3.1 Bond Pricing Formula
Price = Present Value of Coupons + Present Value of Principal
The discount rate used is based on prevailing interest rates and risk premium.
3.2 Yield Measures
Current Yield = Annual Coupon / Current Price
Yield to Maturity (YTM): Return if bond held till maturity.
Yield to Call (YTC): Return if bond is called before maturity.
Yield Spread: Difference in yields between two bonds (e.g., corporate vs government).
3.3 Inverse Relationship between Price & Yield
When interest rates rise, bond prices fall (yields go up).
When interest rates fall, bond prices rise (yields go down).
This fundamental rule drives trading opportunities.
4. Strategies in Bond & Fixed Income Trading
4.1 Passive Strategies
Buy and Hold: Investors hold bonds until maturity for predictable returns.
Laddering: Staggering maturities to manage reinvestment risk.
Barbell Strategy: Combining short- and long-term bonds.
4.2 Active Strategies
Yield Curve Trading: Betting on changes in the shape of the yield curve (steepening, flattening).
Duration Management: Adjusting portfolio sensitivity to interest rates.
Credit Spread Trading: Exploiting differences between government and corporate yields.
Relative Value Trading: Arbitrage between similar bonds mispriced in the market.
Event-Driven Trading: Taking positions before/after policy changes, credit rating upgrades/downgrades.
4.3 Advanced Strategies
Bond Futures & Options: Derivatives to hedge or speculate.
Credit Default Swaps (CDS): Insurance against default, tradable contracts.
Interest Rate Swaps: Exchanging fixed-rate payments for floating-rate ones.
5. Risks in Bond & Fixed Income Trading
Interest Rate Risk: Prices fall when rates rise.
Credit Risk: Issuer defaults on payments.
Reinvestment Risk: Coupons may have to be reinvested at lower rates.
Liquidity Risk: Some bonds are hard to trade.
Inflation Risk: Rising inflation erodes real returns.
Currency Risk: For foreign bonds, exchange rate volatility matters.
Call & Prepayment Risk: Issuer may redeem bonds early when rates drop.
6. The Role of Central Banks and Monetary Policy
Bond markets are deeply tied to monetary policy:
Central banks control benchmark interest rates.
Through open market operations (OMO), they buy/sell government securities to regulate liquidity.
Quantitative easing (QE): Large-scale bond buying lowers yields.
Tightening cycles: Selling bonds or raising rates pushes yields higher.
Bond traders watch central bank meetings (like U.S. Fed, ECB, RBI) closely since even minor shifts in policy guidance can move bond yields globally.
7. Global Bond Markets
7.1 U.S. Treasury Market
The largest, most liquid bond market globally. Treasuries are considered the world’s risk-free benchmark.
7.2 European Bond Market
Includes German Bunds (safe-haven) and bonds from Italy, Spain, Greece (riskier spreads).
7.3 Asian Markets
Japan’s Government Bonds (JGBs) dominate, often with near-zero or negative yields.
India’s G-Sec market is growing rapidly, with RBI auctions being a key driver.
7.4 Emerging Markets
Sovereign bonds from Brazil, Turkey, South Africa, etc. These offer higher yields but come with higher risk.
8. Technology & Evolution of Fixed Income Trading
Electronic Trading Platforms (MarketAxess, Tradeweb, Bloomberg) are transforming bond markets from dealer-driven to electronic order books.
Algorithmic Trading & AI help in pricing, liquidity detection, and risk management.
Blockchain & Tokenization are being explored for faster settlement and transparency.
9. Case Studies
Case 1: 2008 Financial Crisis
The crisis originated partly from securitized debt instruments (mortgage-backed securities). Credit risk was underestimated, and defaults triggered global turmoil.
Case 2: COVID-19 Pandemic (2020)
Global bond yields crashed as investors rushed into safe-haven Treasuries. Central banks intervened with QE programs, leading to record low yields.
Case 3: Inflation Surge (2021–2023)
Bond yields spiked worldwide as central banks aggressively hiked rates to control inflation. Bond traders faced sharp volatility, especially in long-duration bonds.
10. Why Investors Trade Bonds
Stability & Income: Bonds provide predictable interest income.
Diversification: Balances equity-heavy portfolios.
Safe-Haven: Government bonds perform well in crises.
Speculation: Traders bet on interest rate moves and credit spreads.
Hedging: Bonds hedge against stock market volatility.
11. Future of Bond & Fixed Income Trading
Sustainable Bonds: Green bonds and ESG-linked instruments are growing.
Digital Transformation: Greater adoption of electronic trading and blockchain settlement.
Integration with Global Policies: Climate financing, infrastructure projects.
AI-Powered Analytics: Predictive modeling for yield curve and credit spreads.
Retail Participation: Platforms are increasingly making bonds accessible to individuals.
Conclusion
Bond and fixed income trading is a cornerstone of global finance, connecting governments, corporations, and investors. Unlike equities, where growth and dividends are uncertain, bonds promise fixed cash flows, making them critical for conservative investors as well as aggressive traders.
The dynamics of interest rates, credit risk, monetary policy, and macroeconomics make the bond market both a stabilizer and a source of opportunity. With rapid technological change and growing investor demand for stability, the fixed income market will continue to expand and evolve.
Ultimately, successful bond trading requires deep understanding of interest rate cycles, credit analysis, and market structure, along with disciplined risk management.

Trading Journals & Performance Optimization1. What is a Trading Journal?
A trading journal is a systematic log where traders document every trade they make, along with the reasoning, conditions, and outcomes. Think of it as a diary—but instead of personal feelings alone, it captures data, analysis, strategy execution, and emotions related to trading decisions.
Key elements in a trading journal include:
Date and time of entry/exit
Asset traded (stocks, forex, commodities, crypto, etc.)
Position size and direction (long/short)
Entry and exit price levels
Stop-loss and take-profit levels
Rationale for taking the trade (technical, fundamental, sentiment-based)
Market conditions at the time (volatility, news, trends)
Emotional state during the trade (fear, greed, confidence, hesitation)
Outcome (profit/loss, percentage gain/loss, risk-to-reward ratio)
Unlike a broker statement, which only shows numerical results, a trading journal captures the story behind the trade—the reasoning, discipline, and psychology.
2. Importance of a Trading Journal
2.1 Accountability
Keeping a journal enforces responsibility. Every trade has a reason documented, which prevents impulsive or random entries. Traders cannot later excuse a loss as “bad luck”—they must revisit their decision-making process.
2.2 Pattern Recognition
Over time, journals reveal recurring mistakes or strengths. For example, a trader might realize they consistently lose money trading during low-volume sessions or when trading against the trend.
2.3 Emotional Control
By noting psychological states, traders begin to recognize how fear, greed, or overconfidence influence outcomes. This self-awareness is crucial in performance optimization.
2.4 Strategy Development
A journal helps test strategies by providing feedback. If a setup yields positive results over dozens of trades, it proves statistical viability. Conversely, poor results may suggest refinement or abandonment.
2.5 Performance Measurement
Beyond profit and loss, a journal allows tracking of metrics like win rate, risk/reward ratios, maximum drawdown, and expectancy. These indicators give a holistic view of trading effectiveness.
3. Designing an Effective Trading Journal
A trading journal must be structured, detailed, and easy to review. Traders can use simple spreadsheets, physical notebooks, or specialized trading journal software.
3.1 Core Data Fields
Date/Time: Helps track market conditions across different sessions.
Asset: Identifies which instruments are more profitable.
Position Size: Essential for risk management analysis.
Entry & Exit Prices: Core for profit/loss calculation.
Stop-Loss & Take-Profit: Tracks adherence to risk-reward planning.
Strategy Used: Notes whether the trade was based on trend-following, breakout, mean reversion, etc.
Market Conditions: Volatility, news events, earnings reports, macroeconomic announcements.
Emotional State: Helps connect psychology with execution quality.
Outcome: Profit/loss in absolute and percentage terms.
3.2 Additional Advanced Fields
Risk-Reward Ratio (RRR): Ratio between potential profit and risked loss.
Expected Value (EV): Calculated as (Win rate × Average win) – (Loss rate × Average loss).
Trade Grade: A subjective score (A, B, C) based on setup quality and discipline.
Screenshot/Chart: A visual reference for entry/exit to spot technical mistakes.
Improvement Notes: Lessons learned for future trades.
4. Types of Trading Journals
4.1 Manual Journals
Notebook or Spreadsheet
Best for beginners and discretionary traders
Provides flexibility but requires discipline
4.2 Digital Journals
Excel/Google Sheets
Can automate calculations like win rate, expectancy, and P/L
Easy to filter and analyze
4.3 Specialized Software
Examples: Tradervue, Edgewonk, Trademetria
Offers automated imports from brokers
Includes advanced analytics and visualizations
Tracks psychology and journaling in detail
4.4 Hybrid Journals
Combination of digital logs and handwritten notes (often for psychology tracking).
5. Metrics for Performance Optimization
5.1 Win Rate
Percentage of winning trades out of total trades. A high win rate does not guarantee profitability unless risk/reward ratios are managed.
5.2 Risk-to-Reward Ratio
The relationship between potential loss and potential gain. Even with a 40% win rate, a trader can be profitable if risk/reward is favorable (e.g., 1:3).
5.3 Expectancy
Measures the average amount a trader can expect to win or lose per trade. Formula:
E = (Win% × Avg Win) – (Loss% × Avg Loss)
5.4 Maximum Drawdown
The largest peak-to-trough decline in capital. Important for psychological endurance and capital preservation.
5.5 Sharpe Ratio
Performance adjusted for volatility. Higher Sharpe ratios indicate better risk-adjusted returns.
5.6 Consistency Score
Measures whether profits are concentrated in a few trades or evenly distributed.
6. Psychology and Emotional Tracking
A journal is not just about numbers—it’s about human behavior.
Fear: Leads to premature exits.
Greed: Causes overtrading and oversized positions.
Revenge Trading: Emotional retaliation after losses.
Overconfidence: Following winning streaks, leading to rule-breaking.
By tracking emotions alongside trades, traders identify behavioral biases that sabotage results. For example, noting “entered trade out of boredom” highlights non-strategic activity that must be eliminated.
7. The Feedback Loop: Journals as a Learning Tool
The journal enables continuous improvement through the feedback loop:
Plan – Define strategy and risk rules.
Execute – Place trades based on setup.
Record – Log data and emotions.
Review – Analyze performance, strengths, and weaknesses.
Adjust – Refine strategies, risk, and mindset.
Repeat – Apply lessons to the next set of trades.
Over time, this iterative cycle compounds into significant skill development.
8. Performance Optimization Techniques
8.1 Strategy Refinement
Using journal insights, traders identify which setups deliver the highest expectancy. Weak strategies can be discarded, while strong ones are scaled.
8.2 Risk Management Enhancement
Journals reveal over-leveraging, poor stop-loss placement, or frequent rule violations. Adjusting position sizes and risk exposure enhances long-term survivability.
8.3 Time Optimization
By tracking trades by time of day, traders discover when they perform best. For example, some excel during market open volatility, while others perform better in calmer sessions.
8.4 Market Condition Matching
Some strategies work best in trending markets, others in ranges. Journals help align tactics with conditions.
8.5 Eliminating Emotional Bias
Performance optimization is impossible without emotional discipline. Journaling makes psychological pitfalls visible, allowing traders to develop corrective actions like meditation, rule-based systems, or automation.
9. Advanced Applications of Trading Journals
9.1 Algorithmic Journals
Quantitative traders often integrate API-driven journals that automatically track trades, calculate advanced metrics, and analyze performance under different simulations.
9.2 Machine Learning Insights
Some modern platforms use ML to suggest improvements—e.g., alerting a trader that they perform poorly on Mondays or during high volatility.
9.3 Risk-of-Ruin Analysis
Helps determine the probability of account blow-up based on historical data and money management practices.
9.4 Peer Review
Professional prop traders often share journals with mentors or managers for external feedback. This increases accountability and learning speed.
10. Common Mistakes in Trading Journals
Incomplete entries – Logging only wins or skipping bad trades undermines honesty.
Too much complexity – Overloading with unnecessary details can make journaling tedious.
Not reviewing – A journal without regular review is just wasted effort.
Bias in notes – Rationalizing mistakes instead of admitting them.
Lack of consistency – Sporadic journaling fails to build meaningful data.
Conclusion
A trading journal is far more than a logbook—it is the mirror of a trader’s mind and methods. By capturing not just numbers but also psychology and context, it provides the raw material for meaningful self-improvement. Performance optimization is the natural outcome of this practice: refining strategies, managing risk, mastering emotions, and building consistency.
The path to successful trading is not about avoiding mistakes but about learning from them systematically. A journal transforms errors into lessons, and lessons into profits. Whether a beginner documenting first trades or a seasoned professional optimizing algorithms, the trading journal is an indispensable tool for sustained success in global markets.

Option Trading How Options are Priced
One of the trickiest aspects of options is pricing. Unlike stocks (where price is direct), option prices are influenced by multiple variables.
Components of Option Pricing
Intrinsic Value – The real value if exercised today.
Call = Spot Price – Strike Price
Put = Strike Price – Spot Price
Time Value – Extra premium traders pay for the possibility that the option may gain value before expiry.
The Greeks
Options traders rely on “Greeks” to understand how different factors impact prices:
Delta: Sensitivity to price changes of underlying.
Gamma: Rate of change of Delta.
Theta: Time decay of the option’s value.
Vega: Sensitivity to volatility changes.
Rho: Sensitivity to interest rates.
Volatility
Volatility plays a huge role. Higher volatility = higher premiums. There are two types:
Historical Volatility – Past market movement.
Implied Volatility (IV) – Market’s expectation of future volatility.
Black-Scholes Model
Developed in 1973, it uses mathematical formulas to calculate fair value of options considering spot price, strike price, time to expiry, volatility, and interest rates.

Part 2 Candlestick PatternBasics of Options Contracts
To truly understand options, let’s break down the core components.
What is an Option?
An option is a contract that gives the buyer the right, but not the obligation, to buy or sell an underlying asset at a predetermined price (strike price) on or before a specified date (expiry date).
The buyer of the option pays a price called the premium.
The seller (or writer) of the option receives this premium and takes on the obligation.
Types of Options
Call Option – Gives the buyer the right to buy the underlying asset at the strike price.
Example: You buy a call on Reliance at ₹2500 strike price. If Reliance moves to ₹2700 before expiry, you can buy at ₹2500 and profit.
Put Option – Gives the buyer the right to sell the underlying asset at the strike price.
Example: You buy a put on Infosys at ₹1500. If Infosys falls to ₹1400, you can sell at ₹1500 and profit.
Key Terms in Options
Strike Price: The price at which the option can be exercised.
Premium: The cost of the option (paid by buyer, received by seller).
Expiry Date: The date when the option contract ends.
Lot Size: Options are traded in lots, not single units. For example, one NIFTY option lot = 50 units.
Moneyness:
In the Money (ITM): Option has intrinsic value.
At the Money (ATM): Strike price = current price.
Out of the Money (OTM): Option has no intrinsic value.
American vs European Options
American Options: Can be exercised any time before expiry.
European Options: Can be exercised only on expiry.
(India primarily uses European-style options.)

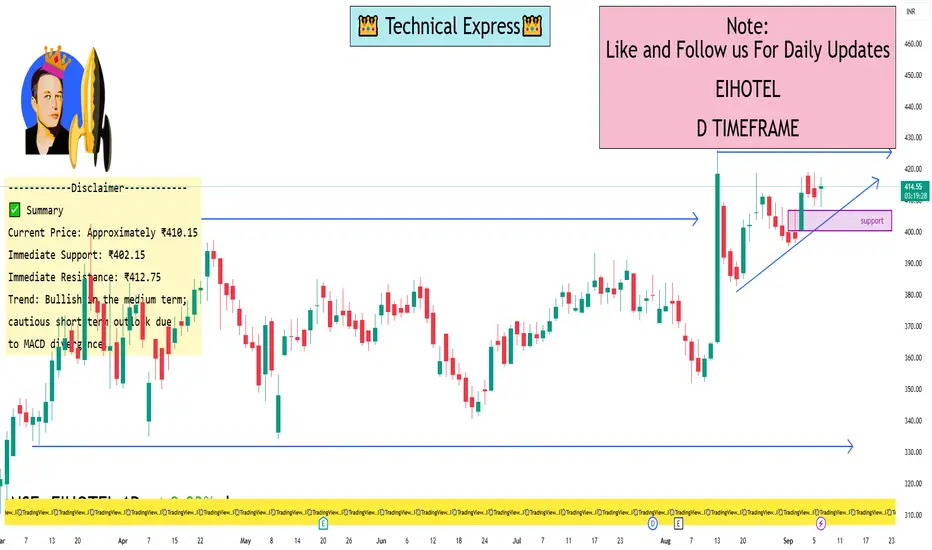
EIHOTEL 1 Day View📈 Daily Support & Resistance Levels
Based on recent data, here are the critical levels:
Support Levels:
S1: ₹402.15
S2: ₹396.05
S3: ₹388.93
Resistance Levels:
R1: ₹412.75
R2: ₹417.25
R3: ₹423.35
These levels are derived from standard pivot point calculations and provide insight into potential price reversal zones.
🔍 Technical Indicators Overview
RSI (14-day): 55.79 – Neutral, indicating neither overbought nor oversold conditions.
MACD: 7.41 – Suggests a bearish trend, as the MACD line is above the signal line.
Moving Averages:
5-day EMA: ₹399.37 – Slightly below the current price, indicating a short-term bearish trend.
20-day EMA: ₹391.96 – Above the current price, suggesting medium-term bullish momentum.
50-day EMA: ₹381.97 – Above the current price, reinforcing the medium-term bullish outlook.
🧭 Trend Analysis
The stock is trading above its 20-day and 50-day EMAs, which typically indicates a bullish trend. However, the MACD suggests a potential short-term bearish phase. Traders should monitor the support and resistance levels closely for potential breakout or breakdown opportunities.
Risk Management & Position Sizing1. Introduction
Trading and investing are not just about finding opportunities; they are about surviving long enough to capitalize on those opportunities. Many traders focus solely on strategies, indicators, or news but fail to recognize that risk management and position sizing are the backbone of long-term success.
It doesn’t matter if you have the best strategy in the world—without proper risk control, even a few bad trades can wipe out your account. On the other hand, a mediocre strategy with strict risk management can still keep you profitable over time.
Risk management is about protecting capital, while position sizing is about optimizing growth while keeping risks tolerable. Together, they determine not just whether you survive in the markets but whether you thrive.
2. Understanding Risk in Trading
Before diving into methods, let’s define risk:
Risk is the probability of losing part or all of your investment due to adverse price movements or unforeseen events.
Types of Risk
Market Risk – Prices move against you due to volatility, trends, or sudden news.
Credit Risk – Counterparty default risk (important in derivatives, bonds, and broker dealings).
Liquidity Risk – Inability to exit a position at desired prices due to thin volume.
Operational Risk – Failures in trading platforms, execution errors, or broker malfunctions.
Psychological Risk – Emotional decisions driven by fear, greed, or impatience.
Why Risk Management is Vital
Preserves trading capital to stay in the game.
Reduces emotional stress and impulsive decisions.
Helps achieve consistency in returns.
Shields from black swan events like 2008 crisis or COVID-19 crash.
3. Core Principles of Risk Management
3.1 Preservation of Capital
Your first goal isn’t to make money—it’s to avoid losing money unnecessarily. Even legendary traders say: “Take care of the downside, the upside will take care of itself.”
3.2 Risk vs. Reward
Every trade has a risk/reward ratio. If you risk ₹1,000 and aim to make ₹3,000, your ratio is 1:3. Good traders avoid trades with poor ratios like 2:1 risk/reward in their favor.
3.3 Probability & Expectancy
Trading is a game of probabilities.
Win rate × average win – (loss rate × average loss) = expectancy.
Positive expectancy ensures long-term profitability.
3.4 Diversification
Don’t put all eggs in one basket. Spread risk across assets, sectors, and strategies to reduce portfolio volatility.
4. Position Sizing Explained
What is Position Sizing?
Position sizing is deciding how much capital to allocate to a trade. Too small, and profits don’t matter; too large, and losses can be fatal.
Fixed Lot vs. Variable Lot
Fixed lot: Always trade the same number of shares/contracts.
Variable lot: Adjust size based on risk percentage, volatility, or account growth.
Position Sizing Models
Fixed Dollar Model – Risking a fixed cash amount (e.g., ₹10,000 per trade).
Fixed Percentage Risk Model – Risking 1–2% of account per trade (most popular).
Volatility-Based Model – Larger positions in stable assets, smaller in volatile ones.
Kelly Criterion – Mathematical formula to maximize growth while avoiding ruin.
5. Techniques of Risk Management in Practice
5.1 Stop-Loss Strategies
A stop-loss is a pre-set exit to limit losses.
Percentage Stop: Exit if loss exceeds 2% of capital.
Volatility Stop: Use ATR (Average True Range) to set dynamic stops.
Chart Stop: Place below support or above resistance.
5.2 Trailing Stops
Move stop-loss as trade moves in your favor—locking in profits while letting winners run.
5.3 Hedging
Use derivatives (options/futures) to protect against downside risk. Example: Buy a put to protect long equity.
5.4 Risk/Reward Ratios
Always look for trades where potential reward is at least 2–3x the risk.
6. The Psychology of Risk Management
Fear: Causes premature exits.
Greed: Leads to oversized positions.
Overconfidence: Makes traders ignore risk rules.
Impatience: Pushes traders into random trades.
Discipline, emotional control, and sticking to rules are as important as technical skills.
7. Position Sizing Strategies in Detail
Stocks
Use 2% rule: Never risk more than 2% of capital on a single stock.
Diversify across industries.
Forex
Calculate pip value and lot size using risk per trade.
Adjust for leverage; avoid risking more than 1%–2% of account per trade.
Futures & Options
Higher leverage = higher risk.
Use margin calculations and hedge positions with spreads.
Crypto
Extremely volatile.
Use smaller positions and wider stops.
Only risk what you can afford to lose.
8. Risk Management in Different Trading Styles
Day Trading
Use tight stops and small risk (0.5%–1%).
Trade frequently but with discipline.
Swing Trading
Moderate position sizes.
Wider stops, risk around 1%–2% per trade.
Position Trading
Long-term view, smaller number of trades.
Can risk slightly higher (up to 3%) but diversify more.
Scalping
Extremely small risks (0.1%–0.5%).
High frequency requires strict discipline.
9. Common Mistakes in Risk Management
Risking too much capital in one trade.
Ignoring correlation (e.g., buying multiple tech stocks all exposed to same risk).
Over-leveraging.
Moving stop-loss further away instead of accepting loss.
Trading without a written plan.
10. Building a Personal Risk Management Plan
Define Risk Tolerance – How much are you comfortable losing?
Capital Allocation Rules – Max % per trade, per sector, per asset.
Position Sizing Method – Choose fixed % or volatility-based.
Stop-Loss & Exit Rules – Define before entering trade.
Review & Journal – Track results and refine rules.
Conclusion
Risk management and position sizing are not optional—they are mandatory survival tools. While strategies and market analysis help find opportunities, only proper risk control ensures long-term consistency and growth.
The most successful traders are not the ones with the highest returns, but those who stay in the market longest with steady risk-adjusted growth.
Remember:
Preserve capital first.
Risk small, grow steady.
Size positions wisely.
That’s the ultimate formula for success in trading.
Types of Trading Strategies1. Introduction to Trading Strategies
A trading strategy is a structured approach to trading based on predefined rules and analysis. These rules may rely on:
Technical Analysis (price action, chart patterns, indicators, support/resistance)
Fundamental Analysis (earnings, economic data, news events)
Quantitative/Algorithmic Models (mathematical/statistical methods, automated systems)
Sentiment Analysis (market psychology, news sentiment, order flow)
The primary goal of any strategy is to create a repeatable edge—a probabilistic advantage that can yield consistent profits over time.
2. Broad Classifications of Trading Strategies
Trading strategies can be categorized into several broad groups:
By Time Horizon:
Scalping
Day Trading
Swing Trading
Position Trading
Long-term Investing
By Analytical Approach:
Technical Trading
Fundamental Trading
Quantitative/Algorithmic Trading
Sentiment-based Trading
By Risk Profile:
Conservative
Aggressive
Hedging/Arbitrage
We’ll now dive into each of the most common and popular strategies.
3. Scalping Strategy
Definition:
Scalping is an ultra-short-term trading strategy where traders attempt to profit from very small price movements, often within seconds or minutes.
Key Features:
Trades last from a few seconds to minutes.
Requires high liquidity markets (forex, index futures, large-cap stocks).
Relies heavily on tight spreads and fast execution.
Tools Used:
Level 2 order book data
Tick charts and 1-minute charts
Momentum indicators (MACD, RSI)
High-frequency trading platforms
Advantages:
Quick profits multiple times a day
Limited overnight risk
Works well in volatile markets
Disadvantages:
High transaction costs due to frequent trades
Requires discipline, speed, and focus
Emotionally exhausting
4. Day Trading Strategy
Definition:
Day trading involves buying and selling financial instruments within the same trading day, with no overnight positions held.
Key Features:
Positions last from minutes to hours.
Traders capitalize on intraday volatility.
Requires constant monitoring of the market.
Popular Day Trading Approaches:
Momentum Trading: Entering trades when a stock shows strong price momentum.
Breakout Trading: Buying/selling when price breaks significant levels.
Reversal Trading: Betting on intraday trend reversals.
Advantages:
Avoids overnight risk
Frequent opportunities daily
High liquidity in popular markets
Disadvantages:
Requires time and attention
Psychological stress
Risk of overtrading
5. Swing Trading Strategy
Definition:
Swing trading is a medium-term strategy aiming to capture price “swings” that occur over days or weeks.
Key Features:
Trades last from 2 days to several weeks.
Based on technical setups (patterns, moving averages).
Allows flexibility; not glued to screens all day.
Common Swing Trading Methods:
Trend Following: Riding the ongoing trend until exhaustion.
Counter-Trend Trading: Betting on temporary pullbacks.
Pattern Trading: Using chart patterns like head-and-shoulders, triangles, or flags.
Advantages:
Less stressful than day trading
Combines technical and fundamental analysis
Good risk-reward ratio
Disadvantages:
Exposure to overnight gaps/news
Requires patience
Profits take longer compared to scalping/day trading
6. Position Trading Strategy
Definition:
Position trading is a long-term trading style where trades last from weeks to months, sometimes years, focusing on capturing major trends.
Key Features:
Based on fundamental factors (earnings, economic cycles, interest rates).
Uses weekly/monthly charts for entry and exit.
Minimal day-to-day monitoring.
Advantages:
Lower transaction costs
Less stressful
Captures large market moves
Disadvantages:
High exposure to long-term risks (policy changes, crises)
Requires patience and large capital
Smaller number of trades
7. Trend Following Strategy
Definition:
This strategy seeks to ride sustained market trends, whether bullish or bearish.
Key Tools:
Moving averages (50/200-day crossover)
Trendlines and channels
Momentum indicators
Advantages:
Simple and widely effective
Works in strong trending markets
Captures big moves
Disadvantages:
Fails in choppy/range-bound markets
Requires wide stop-losses
8. Mean Reversion Strategy
Definition:
Based on the principle that prices tend to revert to their mean or average value after significant deviations.
Methods Used:
Bollinger Bands
RSI (overbought/oversold)
Moving average reversion
Advantages:
High probability of small consistent wins
Works in range-bound markets
Disadvantages:
Risk of heavy loss if trend continues
Not effective in strong momentum markets
9. Breakout Trading Strategy
Definition:
Traders enter when price breaks above resistance or below support with high volume.
Indicators Used:
Support & Resistance zones
Volume analysis
Moving average convergence
Advantages:
Captures early stages of big moves
Works well in volatile markets
Disadvantages:
Risk of false breakouts
Requires strict stop-losses
10. Momentum Trading Strategy
Definition:
In momentum trading, traders buy assets showing upward momentum and sell those with downward momentum.
Key Tools:
Relative Strength Index (RSI)
MACD
Price rate-of-change indicators
Advantages:
High potential for profits during trends
Easy to understand
Disadvantages:
Vulnerable to sudden reversals
Requires precise timing
Conclusion
Trading strategies are not “one-size-fits-all.” A strategy that works for one trader may fail for another, depending on discipline, psychology, and adaptability. The most successful traders develop a style that fits their personality and risk profile, and they constantly evolve strategies with changing markets.
From scalping and day trading to algorithmic models and arbitrage, the spectrum of strategies is vast. What remains constant, however, is the need for risk management, consistency, and emotional discipline.
Part 3 Learn Institutional Trading Key Terms You Must Know
Before diving deeper, let’s define some must-know option trading terminology:
Strike Price: The fixed price at which you can buy/sell the asset.
Premium: The cost of the option contract.
Expiry Date: The last day on which the option is valid.
In the Money (ITM): An option that already has intrinsic value.
Out of the Money (OTM): An option with no intrinsic value, only time value.
At the Money (ATM): When the asset’s price is equal to the strike price.
Lot Size: Options are traded in lots, not single shares. Example: Nifty option lots usually contain 50 units.
Writer/Seller: The person who sells the option and receives the premium.
Buyer/Holder: The person who buys the option and pays the premium.
Why Trade Options?
Beginners often ask: “Why not just buy stocks directly?”
Here’s why many traders prefer options:
Leverage: With a small premium, you can control a large quantity of shares.
Limited Risk (for Buyers): Your maximum loss is the premium paid.
Profit from Any Direction: Options let you benefit from rising, falling, or even stagnant markets.
Hedging: Protect your portfolio from adverse price moves. For example, buying puts on Nifty can protect your stock portfolio during market crashes.
Income Generation: By selling options, traders collect premiums regularly (popular among professionals).

Part 1 Ride The Big MovesIntroduction
The world of financial markets offers countless opportunities for investors and traders to grow wealth, hedge risks, and speculate on price movements. Among these opportunities, options trading stands out as both exciting and intimidating. For beginners, the term "options" might sound complex, but once you understand the building blocks, options open the door to powerful strategies that stocks alone cannot provide.
Options trading is not gambling, though many mistake it for that. Instead, it’s a sophisticated tool that—when used wisely—can help traders generate income, protect their portfolios, or profit from both rising and falling markets. In this guide, we’ll walk through every fundamental aspect of options trading, simplifying concepts for beginners while also highlighting practical examples.
By the end of this guide, you’ll know:
What options are and how they work
Key terms every beginner must understand
Why people trade options
The risks and benefits of options
Basic strategies suitable for beginners
Mistakes to avoid in your early journey
A roadmap to becoming a skilled options trader

ETH–USD 2 Hour ViewEthereum vs USD — 2-Hour Timeframe Levels
You asked for key price levels on a 2-hour chart. While I can't generate live 2-hour chart data here, I can share recent technical insights with support and resistance levels, plus your current price context.
⏺ Key Technical Levels (as of early September 2025):
Support Zones:
$4,360 — initial support area
$4,315 — next downside level
Below that: $4,260 and $4,220 are cited as further downside supports
Resistance Zones:
$4,500 — key resistance, blockage for current rally
If surpassed: $4,520 and $4,555 are possible next targets
Extended resistance: up to $4,620, then $4,660 or even $4,720 if momentum builds
Mid-range / Technical Sentiment:
Recent consolidation between $4,350–$4,450, holding above the 100-hour SMA with rebound potential
Daily chart structure remains bullish as long as ETH stays above $4,000; a breakdown below that could weaken structure
Next Steps for You:
Use a charting platform (e.g., TradingView) with a 2-hour timeframe and apply horizontal lines at these zones.
Watch for price action: Does ETH bounce at support? Does it stall or break through resistance? Candlestick patterns and volume around these levels help refine entries/exits.
Play momentum: Watch aggressiveness above $4,500 with targets at $4

Day Trading Secrets1. Understanding Market Structure: The Foundation of Day Trading
A critical secret in day trading is a thorough understanding of market structure. Day traders succeed by identifying trends, reversals, and consolidation patterns in the price action.
1.1 Trends, Ranges, and Volatility
Trending Markets: Prices move in a clear direction (up or down). Trading with the trend increases probability of winning trades. Common tools to identify trends include moving averages (e.g., 20 EMA, 50 EMA) and trendlines.
Ranging Markets: Prices oscillate between support and resistance levels. Here, traders often adopt mean-reversion strategies, buying near support and selling near resistance.
Volatile Markets: Characterized by large intraday swings. High volatility can provide opportunities for quick profits but increases risk. Traders should reduce position size during extreme volatility.
1.2 Support and Resistance
Support and resistance are fundamental in intraday trading. Key secrets include:
Multiple Confluences: Look for levels supported by prior price action, moving averages, and pivot points.
Breakouts vs. Fakeouts: True breakouts are accompanied by strong volume; fakeouts trap traders who enter prematurely.
1.3 Price Action Analysis
Reading price action is a secret skill that most beginners overlook. Candlestick patterns such as engulfing candles, pin bars, and inside bars provide high-probability setups. Intraday traders also pay attention to wick size and rejection patterns, which indicate potential reversals.
2. Risk Management: The Trader’s True Secret Weapon
The most overlooked secret in day trading is disciplined risk management. Without it, even the best strategy will fail.
2.1 Position Sizing
Never risk more than 1-2% of your trading capital on a single trade.
Example: If your capital is ₹1,00,000, maximum risk per trade should be ₹1,000-2,000.
2.2 Stop-Loss Discipline
Always use a stop-loss to limit losses.
Move stops only to reduce risk, not to give trades more room to breathe.
Intraday traders often use volatility-based stops, e.g., ATR (Average True Range) multiples, to adapt to changing market conditions.
2.3 Reward-to-Risk Ratio
Target at least 2:1 or higher.
Example: Risk ₹1,000 to make ₹2,000. This ensures profitability even with a 50% win rate.
2.4 Avoid Overtrading
Trading too frequently increases transaction costs and emotional fatigue.
Stick to high-probability setups and ignore low-confidence trades.
3. Timing the Market: Session Secrets
Day trading isn’t just about picking the right stock or asset; it’s about trading at the right time.
3.1 Market Sessions
Opening Hour: Most volatile. First 30-60 minutes see rapid price movements due to overnight news and order imbalances.
Midday: Lower volatility. Traders often reduce positions or avoid trading.
Closing Hour: The last hour (3:00–3:30 PM in India) often sees trend continuation or reversals, useful for final profit-taking or scalping.
3.2 Economic & News Catalysts
Earnings announcements, RBI rate decisions, and geopolitical news often create predictable intraday volatility.
Secret: Align trades with expected volatility; avoid trading before major news without proper hedging.
4. Technical Tools & Indicators: Using Them Wisely
While no indicator is a secret shortcut, smart day traders use them selectively to increase confidence in trades.
4.1 Volume Analysis
Confirms breakout strength.
High volume during a breakout often signals continuation, while low volume signals potential failure.
4.2 Moving Averages
Short-term MAs (9 EMA, 20 EMA) help spot intraday trend changes.
Long-term MAs (50 EMA, 200 EMA) provide dynamic support/resistance and trend direction.
4.3 VWAP (Volume Weighted Average Price)
VWAP helps determine intraday market value.
Secret: Price above VWAP = bullish bias; price below VWAP = bearish bias.
4.4 RSI & MACD
RSI helps identify overbought/oversold levels, especially in ranging markets.
MACD aids in spotting momentum shifts, but avoid using it in isolation.
5. Psychological Edge: Mastering Emotions
The biggest secret in day trading is controlling your mind. Emotional discipline separates profitable traders from losers.
5.1 Fear and Greed
Fear causes missed opportunities; greed causes overtrading.
Secret: Develop a calm, rule-based approach to reduce emotional interference.
5.2 Patience
Wait for confirmation before entering trades.
Avoid chasing moves or averaging down impulsively.
5.3 Focus on Probabilities
No trade is guaranteed. Focus on high-probability setups and statistical edges, not outcomes.
5.4 Journaling and Reflection
Track every trade: entry, exit, reasoning, emotional state, and result.
Secret: Reviewing mistakes is faster learning than practicing more trades blindly.
6. Advanced Day Trading Secrets
Beyond basic strategies, professional intraday traders employ advanced techniques to gain an edge.
6.1 Order Flow Analysis
Analyzing Level II market data reveals big players’ intentions.
Watching how bid-ask sizes change can indicate potential support/resistance flips.
6.2 Scalping
Involves taking quick, small profits repeatedly.
Requires high focus, fast execution, and low latency platforms.
6.3 Algorithmic Assistance
Some traders use automated strategies to identify setups or execute trades faster than manual execution.
Secret: Automation reduces emotional mistakes and ensures discipline in repetitive strategies.
6.4 Multi-Timeframe Analysis
Secret: Confirm intraday trades using multiple timeframes. For instance, a 5-minute trend aligned with a 15-minute trend increases probability of success.
6.5 Market Sentiment
Track news sentiment, social media trends, and institutional flows.
Secret: Extreme optimism or pessimism often precedes intraday reversals.
7. Common Mistakes and How to Avoid Them
Even seasoned traders fall into traps. Awareness of these common pitfalls is a secret advantage.
Chasing the Market: Entering late after a strong move often leads to losses.
Overleveraging: High leverage increases risk exponentially.
Ignoring Market Context: Technical setups fail if macro conditions are unfavorable.
Lack of Routine: Consistency comes from structured preparation, not luck.
8. Crafting Your Day Trading Blueprint
A practical secret to success is having a routine:
Pre-Market Preparation: Analyze key support/resistance, trending sectors, and news catalysts.
Market Open Strategy: Focus on high-volume setups, avoid impulsive trades.
Intraday Adjustments: Use technical confirmations, maintain strict stop-loss discipline, scale positions cautiously.
Post-Market Review: Analyze trades, document lessons, and adjust strategy.
9. Tools, Platforms, and Resources
Successful day traders rely on the right tools:
Trading Platforms: Fast execution and Level II data are essential.
Charting Software: High-quality charts for price action and indicators.
News Feeds: Real-time news helps anticipate intraday volatility.
Backtesting Tools: Test strategies using historical data to understand edge.
Conclusion
Day trading secrets are not about shortcuts; they are about disciplined habits, market understanding, and continuous improvement. The “secrets” professional traders use include:
Mastering market structure and price action
Strict risk management and position sizing
Timing trades around market sessions and news
Selective use of indicators
Psychological control and journaling
Advanced techniques like order flow analysis and scalping
Consistent profitability comes from following these principles day after day, maintaining discipline, and adapting to market conditions. While there is no guaranteed formula, applying these secrets systematically can give traders a real edge in the highly competitive world of intraday trading.
Algo & Quant Trading in IndiaIntroduction
Financial markets worldwide have witnessed a paradigm shift in the last two decades. Traditional trading, which once relied heavily on manual execution, intuition, and gut feeling, has now given way to sophisticated, technology-driven strategies. In India, this transformation has been especially visible with the rise of Algorithmic (Algo) Trading and Quantitative (Quant) Trading.
Algo trading refers to the use of computer programs that follow a defined set of instructions (algorithms) to place trades automatically. Quant trading, on the other hand, is rooted in mathematical, statistical, and computational models to identify trading opportunities. While the two often overlap, quant strategies form the brain of the model, and algos are the execution engine.
In India, the growth of algo and quant trading is not just a reflection of global trends, but also a product of domestic factors like regulatory changes, increased market participation, rapid digitization, and the rise of fintech. From institutional investors to retail traders, the Indian market is undergoing a revolution that is reshaping how trading is executed.
Evolution of Algo & Quant Trading Globally and in India
Global Origins
Algorithmic trading traces its roots back to the 1970s and 1980s in the US and Europe when exchanges began offering electronic trading systems. By the late 1990s and early 2000s, hedge funds and investment banks began adopting quant-driven models for arbitrage, high-frequency trading (HFT), and risk management. Today, in developed markets, more than 70–80% of trades on exchanges are executed through algos.
Indian Journey
India’s journey began much later but has picked up speed rapidly:
2000 – NSE and BSE adopted electronic trading, paving the way for automation.
2008 – SEBI formally allowed algorithmic trading in India, mainly targeted at institutional traders.
2010–2015 – Introduction of co-location services by exchanges allowed brokers and institutions to place their servers closer to exchange data centers, reducing latency.
2016–2020 – With fintech growth and APIs provided by brokers like Zerodha, Upstox, and Angel One, algo trading reached the retail segment.
2020 onwards – Post-pandemic, massive digitization, cheaper data, and increased retail participation fueled the adoption of quant-based strategies among traders.
Today, algo and quant trading in India account for over 50% of daily turnover on NSE and BSE in derivatives and equities combined.
Understanding Algo Trading
Definition
Algo trading uses predefined rules based on time, price, volume, or mathematical models to execute trades automatically without human intervention.
Key Features
Speed: Orders are executed in milliseconds.
Accuracy: Eliminates human error in order placement.
Discipline: Removes emotional bias.
Backtesting: Strategies can be tested on historical data before going live.
Common Algo Strategies in India
Arbitrage Trading – Exploiting price differences across cash and derivatives or across different exchanges.
Market Making – Providing liquidity by quoting both buy and sell prices.
Trend Following – Using indicators like moving averages, MACD, and momentum.
Mean Reversion – Betting that prices will revert to their historical average.
Scalping / High-Frequency Trading – Very short-term strategies capturing micro-movements.
Execution Algorithms – VWAP (Volume Weighted Average Price), TWAP (Time Weighted Average Price) used by institutions to minimize market impact.
Understanding Quant Trading
Definition
Quant trading involves developing strategies based on quantitative analysis – mathematical models, statistical techniques, and computational algorithms.
Building Blocks of Quant Trading
Data – Price data, fundamental data, alternative data (news sentiment, social media, macro indicators).
Models – Predictive models like regression, machine learning algorithms, time-series analysis.
Risk Management – Position sizing, stop-loss rules, drawdown control.
Execution – Often implemented via algorithms to ensure efficiency.
Popular Quant Strategies in India
Statistical Arbitrage (pairs trading, cointegration).
Factor Investing (momentum, value, quality factors).
Machine Learning Models (neural networks, random forests for pattern detection).
Event-Driven Strategies (earnings announcements, macro data, corporate actions).
Regulatory Framework in India
Algo and quant trading in India operate under the supervision of SEBI (Securities and Exchange Board of India). Key guidelines include:
Direct Market Access (DMA): Institutional traders can place orders directly into exchange systems.
Co-location Facilities: Exchanges provide space near their servers to reduce latency for HFTs.
Risk Controls: SEBI mandates pre-trade risk checks (price band, order value, quantity limits).
Approval for Brokers: Brokers offering algos must get SEBI approval and ensure audits.
Retail Algo Trading (2022 draft): SEBI expressed concerns about unregulated retail algos offered via APIs. Regulations are evolving to protect small investors.
While SEBI encourages innovation, it is equally cautious about market stability and fairness.
Technology Infrastructure Behind Algo & Quant Trading
Essential Components
APIs (Application Programming Interfaces): Provided by brokers to allow programmatic order execution.
Low-Latency Networks: High-speed internet and co-location access for institutional players.
Programming Languages: Python, R, C++, and MATLAB dominate strategy development.
Databases & Cloud Computing: MongoDB, SQL, AWS, and Azure for storing and analyzing data.
Backtesting Platforms: Tools like Amibroker, MetaTrader, and broker-provided backtesters.
Rise of Retail Platforms in India
Zerodha’s Kite Connect API
Upstox API
Angel One SmartAPI
Algo platforms like Tradetron, Streak, AlgoTest
These platforms democratized algo and quant trading, allowing retail traders to build, test, and deploy strategies without deep coding knowledge.
Advantages of Algo & Quant Trading
Speed & Efficiency – Execution in microseconds.
No Human Emotions – Reduces fear, greed, or panic.
Scalability – Strategies can run across multiple stocks simultaneously.
Backtesting Capability – Historical simulations improve reliability.
Liquidity & Market Depth – Enhances overall efficiency of markets.
Challenges and Risks
Technology Costs: Infrastructure for serious HFT/quant models is expensive.
Regulatory Uncertainty: Retail algo rules are still evolving.
Market Risks: Backtested strategies may fail in live conditions.
Overfitting Models: Quant strategies may look perfect on paper but collapse in reality.
Operational Risks: Server downtime, internet issues, or software bugs can lead to losses.
The Rise of Retail Algo Traders in India
Traditionally, algo and quant trading were limited to large institutions, hedge funds, and prop trading firms. However, in India, retail adoption is rapidly increasing:
Young traders with coding skills are building custom strategies.
Platforms like Streak allow no-code algo building.
Social trading and strategy marketplaces let retail traders copy tested models.
This democratization is changing market dynamics, as retail algos now contribute significantly to volumes.
Role of Prop Trading Firms and Hedge Funds
Several proprietary trading firms and domestic hedge funds are aggressively building quant and algo strategies in India. These firms:
Employ mathematicians, statisticians, and programmers.
Focus on arbitrage, high-frequency, and statistical models.
Benefit from co-location and institutional-grade infrastructure.
Examples include Tower Research, Quadeye, iRage, and Dolat Capital.
Impact on Indian Markets
Higher Liquidity: Algo trading has improved depth and bid-ask spreads.
Reduced Costs: Institutional investors save on execution costs.
Efficient Price Discovery: Arbitrage strategies ensure fewer mispricings.
Volatility Concerns: Sudden algorithmic errors can lead to flash crashes.
Retail Empowerment: Access to professional-grade tools has leveled the playing field.
Future of Algo & Quant Trading in India
Artificial Intelligence & Machine Learning: AI-driven algos will dominate pattern recognition.
Alternative Data Usage: News analytics, social sentiment, and satellite data will gain importance.
Expansion to Commodities & Crypto: Once regulatory clarity improves, algo adoption will rise in these markets.
Wider Retail Participation: With APIs and fintech growth, retail algo adoption will skyrocket.
Regulatory Clarity: SEBI will formalize frameworks for retail algo safety.
Case Studies
Case Study 1: Arbitrage in Indian Equities
A quant firm builds a model exploiting price differences between NSE and BSE for highly liquid stocks like Reliance and HDFC Bank. The algo executes hundreds of trades daily, making small but consistent profits with low risk.
Case Study 2: Retail Trader Using Streak
A retail trader builds a moving average crossover strategy on Streak for Nifty options. Backtests show consistent profits, and the algo runs live with automated execution. While returns are smaller than HFT firms, it brings consistency and discipline to retail trading.
Conclusion
Algo and Quant trading in India are no longer niche activities reserved for a few elite institutions. They have become an integral part of the Indian financial ecosystem, transforming how markets function. The synergy of technology, regulation, and retail participation is reshaping trading culture.
While risks remain in terms of technology dependence and regulatory gaps, the benefits – efficiency, transparency, and democratization – far outweigh the challenges. The next decade will likely see India emerge as one of the fastest-growing hubs for algo and quant trading in Asia, supported by its large pool of engineers, coders, and financial talent.
Algo & Quant trading are not just the future of Indian markets – they are the present reality shaping every tick on the screen.

Sector Rotation in Indian MarketsIntroduction
The Indian stock market is one of the most vibrant, dynamic, and rapidly growing markets in the world. Over the last two decades, India has emerged as a global investment hub, attracting both domestic and foreign investors. Within this vast ecosystem, one concept plays a critical role in how investors allocate their money, time their entries and exits, and build long-term wealth: sector rotation.
Sector rotation refers to the process of shifting investments from one sector of the economy to another based on the economic cycle, market trends, and investor expectations. It is not just about identifying which stock will rise but about understanding which sectors will outperform at a given time. In the Indian context, where the economy is influenced by domestic consumption, global trade, commodity cycles, government policies, and demographic shifts, sector rotation becomes an essential strategy for smart investors.
This article will explore sector rotation in Indian markets in detail—its concept, drivers, historical examples, strategies, risks, and its growing relevance in today’s economy.
Understanding Sector Rotation
Sector rotation is based on the idea that different industries perform better during different phases of the economic cycle. For instance, when the economy is expanding, sectors like banking, infrastructure, and real estate often do well. Conversely, in times of slowdown or uncertainty, defensive sectors like pharmaceuticals, FMCG (Fast-Moving Consumer Goods), and utilities tend to outperform.
The economic cycle typically passes through four phases:
Expansion – Rising GDP growth, improving corporate profits, strong demand, and positive investor sentiment.
Peak – High growth but nearing saturation, inflationary pressures, and possible interest rate hikes.
Contraction – Slowing demand, declining profits, falling investment, and weaker market sentiment.
Trough/Recovery – Stabilization, government interventions, lower interest rates, and early signs of revival.
Each of these stages favors specific sectors. Understanding these shifts allows investors to rotate capital accordingly, capturing returns and reducing risks.
Why Sector Rotation Matters in India
India’s economy is unique compared to developed markets. It is domestically driven, powered largely by consumption, but also influenced by global commodity prices, exports, and foreign capital inflows. The following factors make sector rotation particularly important in India:
High Economic Growth Cycles
India has historically grown faster than most developed economies. This creates frequent sectoral shifts as new industries emerge and old ones adapt.
Policy-Driven Economy
Government policies (such as Make in India, PLI schemes, EV push, green energy initiatives) can rapidly change sector dynamics.
Demographics & Consumption
A young population and growing middle class make sectors like FMCG, retail, and technology highly cyclical and demand-driven.
Global Linkages
Export-heavy sectors like IT services, pharmaceuticals, and metals are influenced by global demand and currency movements, requiring careful rotation strategies.
Liquidity Flows
Foreign Institutional Investors (FIIs) and Domestic Institutional Investors (DIIs) often shift large sums between sectors, driving momentum.
Historical Sector Rotation in Indian Markets
Looking at India’s market history helps illustrate how sector rotation plays out in real time.
1. IT Boom (Late 1990s – Early 2000s)
Trigger: The rise of the internet and Y2K opportunities.
Beneficiaries: Infosys, Wipro, TCS became global giants.
Rotation: Capital moved from traditional industries (steel, cement) to technology.
2. Infrastructure & Realty Boom (2003–2008)
Trigger: High GDP growth, easy credit, and government focus on infrastructure.
Beneficiaries: Construction, real estate, power, and banking stocks.
Rotation: IT took a backseat while infra and realty stocks skyrocketed.
3. Defensive Phase (2008–2010)
Trigger: Global financial crisis.
Beneficiaries: FMCG, pharmaceuticals, utilities (seen as safe havens).
Rotation: Money flowed out of cyclicals into defensives.
4. Banking & Consumption Boom (2014–2018)
Trigger: Political stability (Modi government), reforms like GST, rising urban demand.
Beneficiaries: Private banks (HDFC Bank, Kotak), consumer stocks, and autos.
Rotation: From defensives into growth-oriented consumption themes.
5. New-Age Tech & Specialty Chemicals (2020–2023)
Trigger: COVID-19 pandemic, supply chain shifts, digital acceleration.
Beneficiaries: IT services, digital platforms, specialty chemicals, and pharma.
Rotation: From traditional banking/infra into new-age digital & healthcare themes.
Key Drivers of Sector Rotation in India
Several factors dictate how and when money moves between sectors in the Indian stock market:
1. Economic Growth & Cycles
Strong GDP growth boosts cyclicals (banks, autos, infra).
Slowdowns favor defensives (FMCG, healthcare, utilities).
2. Interest Rates & Inflation
Low rates: Boosts real estate, autos, banks.
High inflation: Commodities, energy, and metals gain.
3. Government Policies
PLI schemes push manufacturing and electronics.
Green energy policies drive renewables.
Budget announcements often trigger sector rotations.
4. Global Trends
US tech trends influence Indian IT.
Global oil prices impact energy, paints, and logistics.
Pharma benefits from global health trends.
5. Corporate Earnings & Valuations
Sectors with better earnings momentum attract capital.
Overvalued sectors see outflows into undervalued opportunities.
6. Liquidity & Investor Sentiment
FIIs often chase large liquid sectors like IT and banks.
Retail investors may favor emerging sectors like EVs and small-cap themes.
Sector Rotation Framework for Investors
Investors can adopt a structured approach to benefit from sector rotation:
Step 1: Identify the Economic Cycle
Track GDP growth, inflation, RBI policy, and global trends.
Step 2: Map Sectors to Phases
Expansion: Banks, infra, real estate, autos.
Peak: Commodities, metals, oil & gas.
Contraction: FMCG, healthcare, utilities.
Recovery: IT, capital goods, mid-cap manufacturing.
Step 3: Track Sectoral Indices
Nifty IT, Nifty Bank, Nifty Pharma, Nifty FMCG, etc.
Rotation is visible when one index outperforms while another lags.
Step 4: Monitor Flows
FIIs/DIIs publish sectoral allocation data.
Mutual funds and ETFs provide clues on trends.
Step 5: Adjust Portfolio
Gradually rotate allocation rather than making sudden shifts.
Use sectoral ETFs, index funds, or top sector stocks.
Examples of Sector Rotation in Today’s Market (2025 Outlook)
Banking & Financials – Benefiting from strong credit growth and rising urban demand.
IT & Digital – Facing global slowdown but long-term digitalization remains strong.
Pharma & Healthcare – Steady defensive play with innovation in generics and biotech.
FMCG – Gaining from rural recovery and stable consumption.
Renewables & EVs – Long-term government push making it a high-growth sector.
Metals & Energy – Dependent on global commodity cycles; near-term volatility expected.
Risks of Sector Rotation
While sector rotation can boost returns, it also carries risks:
Timing Risk – Misjudging the economic cycle leads to poor allocation.
Policy Uncertainty – Sudden government changes (e.g., GST, export bans).
Global Shocks – Oil price spikes, geopolitical tensions can derail sectors.
Overvaluation Risk – Entering a sector too late when valuations are inflated.
Liquidity Risk – Some sectors (like SMEs or niche industries) may lack liquidity.
Practical Tips for Investors
Stay Diversified – Never put all money into one sector.
Follow Sector Leaders – Blue-chip companies signal sectoral momentum.
Use Technical Indicators – Relative strength index (RSI), moving averages for sector indices.
Read Policy Signals – Budgets, RBI minutes, global commodity news.
Use Sector ETFs – Easier to rotate compared to picking individual stocks.
Combine Fundamentals & Technicals – Balance both to avoid emotional decisions.
Conclusion
Sector rotation in Indian markets is not just a theory—it is a practical investing strategy that has repeatedly proven effective over decades. From the IT boom of the 2000s to the infra rally of 2003–2008, the defensive plays of 2008–2010, and the digital acceleration post-COVID, Indian markets showcase clear evidence of money moving from one sector to another as cycles shift.
For investors, understanding sector rotation means being proactive rather than reactive. Instead of chasing hot stocks after a rally, the real winners are those who anticipate the next sectoral leader and rotate their portfolios accordingly.
India’s economic growth story, driven by demographics, policy reforms, and global integration, ensures that sector rotation will continue to play a pivotal role in wealth creation. Whether you are a short-term trader or a long-term investor, mastering sector rotation is like learning the rhythm of the market’s heartbeat—it tells you where to focus, when to shift, and how to stay ahead.
SME IPO Boom in IndiaEvolution of SME IPOs in India
Pre-2012 Scenario
Before 2012, SME companies found it extremely difficult to raise funds through stock exchanges. The compliance burden, cost of listing, and strict requirements made it nearly impossible for smaller businesses to access capital markets. Their financing largely depended on:
Bank loans (often with collateral).
Private equity/venture capital.
Family funds and informal sources.
Introduction of SME Platforms
In 2012, SEBI (Securities and Exchange Board of India) and stock exchanges launched dedicated SME platforms:
BSE SME Exchange (launched in March 2012).
NSE Emerge (launched in September 2012).
These platforms were specifically designed to simplify compliance, reduce listing costs, and provide a gateway for SMEs to raise funds publicly.
Growth Trajectory
Between 2012–2016: A slow start, as companies and investors were still testing the waters.
2017–2019: Strong pickup, especially in tier-2 and tier-3 cities, as awareness spread.
Post-COVID (2020–2023): Explosive growth, with record numbers of SME IPOs and oversubscriptions, indicating a new trend of investor enthusiasm.
By 2024, hundreds of SME IPOs had listed, many with extraordinary listing gains, capturing national attention.
Why Are SME IPOs Booming in India?
Several factors explain the surge:
1. Rising Investor Appetite
Retail investors have increasingly shown interest in SME IPOs because:
Many SME IPOs have delivered multibagger returns in short periods.
Lower IPO sizes make them accessible.
Grey market activity creates hype before listing.
2. Capital Needs of SMEs
SMEs require funds for:
Expansion of capacity.
Technology upgrades.
Debt repayment.
Marketing and working capital.
Listing on SME platforms gives them visibility and credibility, helping them raise funds at competitive costs.
3. Government Support
Initiatives such as Startup India, Digital India, and Make in India have created a supportive environment for SMEs. The government’s focus on MSMEs as the “backbone of the Indian economy” has encouraged many small firms to formalize and consider stock market fundraising.
4. Exchange and SEBI Initiatives
SEBI has created a lighter compliance framework for SME listings, while BSE and NSE have aggressively promoted their SME platforms through roadshows, seminars, and regional outreach.
5. Growing Retail Participation in Markets
The pandemic era saw an explosion in demat accounts, with retail participation at historic highs. Many first-time investors are experimenting with SME IPOs, attracted by their smaller size and higher potential returns.
6. Strong Secondary Market Performance
Many SME stocks, once listed, have performed far better than mainboard stocks. This secondary market strength has boosted confidence among new investors.
Features of SME IPOs
SME IPOs differ from mainboard IPOs in several ways:
Issue Size: Typically smaller, ranging from ₹10 crore to ₹50 crore, though some go higher.
Eligibility: SMEs with post-issue paid-up capital between ₹1 crore and ₹25 crore can list.
Investors: Minimum application size is higher than mainboard IPOs (e.g., ₹1–2 lakh), designed to attract serious investors.
Trading: SME shares are initially traded in a separate platform with lower liquidity compared to mainboard.
Migration: Once the SME grows and meets eligibility, it can migrate to the mainboard.
Benefits of SME IPOs
For Companies
Access to long-term capital without heavy collateral.
Enhanced brand image and credibility.
Opportunity to attract institutional investors.
Liquidity for promoters and early investors.
Better corporate governance and transparency.
For Investors
Early access to high-growth businesses.
Potential for outsized returns.
Portfolio diversification beyond large-caps and mid-caps.
For the Economy
Formalization of the SME sector.
Job creation and regional development.
Strengthening of India’s entrepreneurial ecosystem.
Risks and Challenges in SME IPOs
While the boom is exciting, SME IPOs are not risk-free.
1. Limited Liquidity
SME stocks often suffer from low trading volumes, making it difficult to exit positions.
2. Higher Business Risk
Many SMEs are in early stages, highly dependent on promoters, and vulnerable to industry shocks.
3. Lack of Research Coverage
Unlike large companies, SME IPOs are rarely tracked by analysts, leaving investors with limited data for decision-making.
4. Valuation Concerns
Some SME IPOs are aggressively priced, relying on hype rather than fundamentals.
5. Grey Market Influence
The unofficial grey market often inflates expectations, leading to volatility post-listing.
6. Regulatory Compliance Burden
Although lighter than mainboard, SMEs still face compliance and governance requirements that can strain smaller firms.
Case Studies: Successful SME IPOs
Example 1: Rex Sealing & Packing Industries Ltd
Listed on NSE Emerge, the IPO was oversubscribed multiple times and delivered strong listing gains.
Example 2: Veekayem Fashion and Apparels Ltd
Attracted huge retail interest due to India’s growing textile exports, and its stock multiplied in value within a year.
Example 3: Drone Destination Ltd
A new-age technology SME IPO that captured attention due to India’s drone policy support.
These examples highlight that SME IPOs span across industries—from textiles and chemicals to technology and healthcare.
Investor Strategies for SME IPOs
Due Diligence: Analyze financials, promoter background, industry prospects.
Subscription Data: Higher subscription (especially QIB and HNI categories) signals confidence.
Avoid Blind Herding: Not all SME IPOs succeed; selective investing is key.
Long-Term View: Treat SME IPOs as long-term investments rather than just listing gain plays.
Diversification: Spread risk by investing in multiple SME IPOs across industries.
Regulatory Safeguards
SEBI has taken several steps to protect investors in SME IPOs:
Mandatory minimum subscription levels.
Strict disclosures of promoter shareholding and related-party transactions.
Lock-in requirements for promoters to ensure long-term commitment.
Migration norms to move from SME platform to mainboard once size criteria are met.
Future of SME IPOs in India
The SME IPO boom is likely to continue, supported by:
Tier-2 and Tier-3 growth: Regional SMEs will increasingly come to market.
Digital platforms: Easier investor access via apps and online brokers.
New-age industries: EVs, drones, fintech, and green energy SMEs will dominate listings.
Policy support: Government’s push for “Viksit Bharat 2047” includes SME empowerment.
However, sustainability of the boom will depend on investor discipline, company performance, and regulatory vigilance.
Conclusion
The SME IPO boom in India marks a new chapter in the evolution of Indian capital markets. What began as a niche experiment in 2012 has grown into a full-fledged ecosystem empowering small businesses and democratizing investment opportunities.
For SMEs, IPOs provide growth capital and visibility. For investors, they offer high-risk, high-reward opportunities. For the economy, they catalyze entrepreneurship, innovation, and job creation.
Yet, caution is essential. Investors must conduct thorough research and not be swayed by hype. Policymakers and regulators must ensure transparency and protect retail investors from excesses.
If managed well, the SME IPO boom can be one of the defining forces in India’s journey towards becoming a $5 trillion economy and beyond, proving that in India’s growth story, small can indeed be big.

Momentum Trading1. What is Momentum Trading?
Momentum trading is a short- to medium-term trading strategy that seeks to capitalize on existing price trends. Instead of trying to predict reversals, momentum traders look to “go with the flow.”
If a stock is rising on strong demand, momentum traders buy it expecting further upside.
If a stock is falling with heavy selling pressure, momentum traders short it anticipating deeper declines.
The core principle is captured in the phrase: “The trend is your friend—until it ends.”
Key Features of Momentum Trading:
Trend Following Nature: It follows short- or medium-term price trends.
Time Horizon: Typically days, weeks, or months (shorter than investing, longer than scalping).
High Turnover: Traders frequently enter and exit positions.
Reliance on Technicals: Heavy use of charts, indicators, and price action rather than fundamentals.
Psychological Driver: Momentum feeds on crowd behavior—fear of missing out (FOMO) and herd mentality.
2. The Theoretical Foundation
Momentum trading is not just a market fad. It is supported by both behavioral finance and empirical evidence.
a) Behavioral Explanation
Investor Herding: Investors often chase rising assets, amplifying the trend.
Anchoring & Confirmation Bias: Traders justify existing moves instead of challenging them.
Overreaction: News or earnings surprises create outsized reactions that persist.
b) Empirical Evidence
Academic studies (notably Jegadeesh & Titman, 1993) have shown that stocks with high past returns tend to outperform in the near future. Momentum is a recognized market anomaly that challenges the Efficient Market Hypothesis (EMH).
c) Physics Analogy
Borrowed from physics, “momentum” suggests that a moving object (in this case, price) continues in its trajectory unless acted upon by external forces (news, earnings, or macro shocks).
3. Tools of Momentum Trading
Momentum traders rely heavily on technical analysis. Here are the most widely used tools:
a) Moving Averages
Simple Moving Average (SMA) and Exponential Moving Average (EMA) smooth price action and help spot trends.
Crossovers (e.g., 50-day EMA crossing above 200-day EMA) indicate bullish momentum.
b) Relative Strength Index (RSI)
Measures speed and magnitude of price changes.
RSI above 70 → Overbought (possible reversal).
RSI below 30 → Oversold (possible bounce).
c) Moving Average Convergence Divergence (MACD)
Shows momentum shifts via difference between two EMAs.
A bullish signal arises when MACD line crosses above the signal line.
d) Volume Analysis
Momentum without volume is weak.
Rising prices with high volume = strong momentum.
Divergence between price and volume warns of exhaustion.
e) Breakouts
Prices breaking above resistance or below support often spark momentum moves.
Traders enter on breakout confirmation.
f) Relative Strength (vs Market or Sector)
Stocks outperforming their index peers often display sustainable momentum.
4. Types of Momentum Trading
Momentum trading is not monolithic. Strategies vary depending on timeframes and style.
a) Intraday Momentum Trading
Captures short bursts of momentum within a trading session.
Driven by news, earnings, or opening range breakouts.
Requires fast execution and strict stop-loss discipline.
b) Swing Momentum Trading
Holds positions for several days to weeks.
Relies on technical setups like flags, pennants, and breakouts.
Less stressful than intraday but requires patience.
c) Position Momentum Trading
Longer-term trend riding (weeks to months).
Relies on moving averages and macro catalysts.
Used by professional traders and hedge funds.
d) Sector or Thematic Momentum
Traders focus on hot sectors (e.g., AI stocks, renewable energy, defense).
Strong sector momentum amplifies individual stock trends.
5. Steps in Momentum Trading
Step 1: Idea Generation
Screeners identify stocks with high relative strength, unusual volume, or new highs/lows.
Step 2: Entry Strategy
Buy during a confirmed breakout.
Enter after consolidation within an uptrend.
Use RSI/MACD confirmation.
Step 3: Risk Management
Place stop-loss below support or recent swing low.
Position size carefully (2–3% of portfolio risk per trade).
Step 4: Exit Strategy
Exit when trend weakens (moving average crossover, bearish divergence).
Book partial profits as price extends far from moving averages.
Step 5: Review & Adapt
Analyze past trades to refine strategy.
6. Psychology of Momentum
Momentum is deeply linked with market psychology.
Fear of Missing Out (FOMO): Traders chase rising assets.
Confirmation Bias: Investors justify price moves with narratives.
Greed and Overconfidence: Leads to over-leveraging in trending markets.
Panic Selling: Accelerates downward momentum.
Understanding these forces helps traders anticipate crowd behavior.
7. Advantages of Momentum Trading
High Profit Potential: Strong trends can deliver outsized returns in short periods.
Flexibility: Works across asset classes—stocks, forex, commodities, crypto.
Clear Rules: Entry and exit are based on technical signals.
Exploits Market Inefficiencies: Captures persistent trends ignored by fundamentals.
8. Risks and Challenges
Trend Reversals: Sudden reversals can cause sharp losses.
False Breakouts: Price may fail to sustain moves, trapping traders.
High Transaction Costs: Frequent trading leads to commissions and slippage.
Emotional Stress: Fast decisions can lead to mistakes.
Overcrowding: When too many traders chase momentum, reversals become violent.
9. Risk Management in Momentum Trading
Momentum trading is risky without strict controls:
Stop-loss Orders: Essential to protect capital.
Trailing Stops: Lock in profits while letting trends run.
Position Sizing: Never risk more than 1–2% of portfolio per trade.
Diversification: Spread momentum bets across assets.
Avoid Overtrading: Quality over quantity.
10. Momentum in Different Markets
a) Equity Markets
Most popular application.
Works best in growth stocks and small/mid-cap names.
b) Forex
Momentum driven by economic releases, central bank decisions, geopolitical risks.
c) Commodities
Momentum thrives on supply-demand imbalances (oil, gold).
d) Cryptocurrencies
Momentum is extreme due to speculative nature and retail participation.
Conclusion
Momentum trading is a blend of science and art—mathematics, psychology, and market intuition. Its power lies in its ability to capture sustained moves fueled by collective human behavior.
Yet, it is not without risks. Momentum reversals can be brutal, requiring traders to maintain discipline, use stop-losses, and avoid emotional decisions.
For those who can balance courage with caution, momentum trading offers one of the most exciting paths in financial markets. It rewards quick thinking, technical mastery, and psychological resilience.
In the end, momentum is the pulse of markets—it reflects fear, greed, and human emotion in motion. By learning to read and ride that pulse, traders position themselves not just as participants, but as masters of the market’s rhythm.

Trading Master Class With ExpertsAdvanced Concepts
1. Implied Volatility (IV)
The market’s forecast of future volatility. High IV inflates option premiums.
2. Volatility Skew & Smile
Different strikes trade at different implied volatilities.
3. Greeks in Real Trading
Delta hedging by institutions.
Vega trading during events (like earnings).
Theta harvesting in sideways markets.
4. Algorithmic & Quantitative Option Trading
Automated strategies based on volatility models.
Statistical arbitrage between options and futures.
Case Studies & Real Examples
1. Reliance Earnings Event
Stock at ₹2,500. IV jumps before results.
Trader buys Straddle (Call + Put).
After results, volatility collapses → straddle loses money despite stock moving.
Lesson: IV matters as much as direction.
2. Bank Nifty Intraday Trading
Traders scalp weekly options for small moves.
Requires strict stop-loss and risk control.

Crypto Trading StrategiesChapter 1: Basics of Crypto Trading
1.1 What is Crypto Trading?
Crypto trading is the buying and selling of digital currencies like Bitcoin, Ethereum, or Solana with the goal of making profits. Trades can be short-term (minutes, hours, or days) or long-term (months or years).
1.2 Why Do People Trade Crypto?
High volatility = high profit potential
24/7 market availability
Variety of assets (over 25,000 coins/tokens)
No central authority (decentralization)
1.3 Types of Crypto Trading
Spot Trading: Buying and selling crypto for immediate delivery.
Futures & Derivatives: Speculating on price without holding the asset.
Margin Trading: Borrowing funds to trade larger positions.
Automated Trading (Bots/AI): Using algorithms to execute trades.
Chapter 2: Foundations of a Good Trading Strategy
2.1 Key Elements
Market Analysis (technical + fundamental)
Risk Management (stop-loss, position sizing)
Trading Psychology (discipline, patience)
Adaptability (adjusting strategies to market conditions)
2.2 Technical Tools
Candlestick patterns
Moving averages (MA, EMA)
RSI, MACD, Bollinger Bands
Volume profile and market structure
2.3 Risk Control
Never risk more than 1–2% of capital per trade.
Always set stop-loss orders.
Diversify across assets.
Chapter 3: Popular Crypto Trading Strategies
3.1 HODLing (Long-Term Holding)
Concept: Buy and hold crypto for years regardless of short-term fluctuations.
Best for: Investors who believe in long-term blockchain growth.
Pros: Easy, stress-free, low trading fees.
Cons: Vulnerable to market crashes.
3.2 Day Trading
Concept: Opening and closing positions within a day.
Tools Used: Technical analysis, chart patterns, high liquidity coins.
Pros: Daily income potential.
Cons: Stressful, requires screen time, risky.
3.3 Swing Trading
Concept: Capturing medium-term price swings (days to weeks).
Example: Buying Bitcoin after a pullback and selling after a breakout.
Pros: Less stressful than day trading.
Cons: Requires patience, overnight risks.
3.4 Scalping
Concept: Making dozens or hundreds of trades daily for small profits.
Tools: Bots, high liquidity exchanges, technical indicators.
Pros: Can accumulate profits quickly.
Cons: High fees, mentally exhausting.
3.5 Trend Following
Concept: "The trend is your friend." Trade in the direction of momentum.
Indicators: Moving averages, MACD, Ichimoku Cloud.
Pros: Effective in trending markets.
Cons: Doesn’t work well in sideways (range-bound) markets.
3.6 Breakout Trading
Concept: Entering trades when price breaks a key support/resistance level.
Example: Buying Bitcoin when it breaks $30,000 resistance.
Pros: Can catch big moves early.
Cons: False breakouts are common.
3.7 Arbitrage
Concept: Exploiting price differences between exchanges.
Types:
Exchange Arbitrage (Binance vs Coinbase)
Triangular Arbitrage (using three pairs)
Pros: Low risk if executed fast.
Cons: Requires speed, high capital.
3.8 Copy Trading / Social Trading
Concept: Following trades of professional traders via platforms.
Pros: Easy for beginners.
Cons: Risk if trader performs badly.
3.9 Algorithmic & Bot Trading
Concept: Automated execution using pre-set rules.
Pros: No emotions, works 24/7.
Cons: Needs technical knowledge, market risk.
3.10 News-Based Trading
Concept: Trading based on major announcements (ETF approvals, regulations, partnerships).
Pros: Can profit from volatility.
Cons: Markets react unpredictably.
Chapter 4: Advanced Crypto Trading Strategies
4.1 Using Leverage
Borrowed funds to trade bigger positions.
Example: 10x leverage means 1% move = 10% profit/loss.
Warning: Extremely risky, beginners should avoid.
4.2 Hedging
Using futures/options to protect long-term holdings.
Example: Holding Bitcoin but shorting futures to protect downside.
4.3 Dollar-Cost Averaging (DCA)
Investing small amounts regularly over time.
Pros: Reduces impact of volatility.
Cons: Slower gains in bull markets.
4.4 Yield Farming & Staking
Earning passive income by locking tokens.
Pros: Steady income.
Cons: Smart contract risks, token devaluation.
Chapter 5: Trading Psychology & Risk Management
5.1 Emotions in Trading
Fear & greed drive most mistakes.
Overtrading, revenge trading, panic selling = account killers.
5.2 Building Discipline
Have a written trading plan.
Stick to stop-loss and take-profit levels.
Avoid FOMO (fear of missing out).
5.3 Risk-Reward Ratio
Aim for at least 1:2 risk-reward ratio (risk $100 to make $200).
Chapter 6: Practical Tips for Crypto Traders
Trade only with money you can afford to lose.
Keep records of trades (trading journal).
Use reliable exchanges with strong security.
Learn continuously—crypto evolves fast.
Diversify between Bitcoin, altcoins, and stablecoins.
Conclusion
Crypto trading offers incredible opportunities—but also extreme risks. Without a strategy, traders often fall prey to volatility, scams, or emotions. By learning and applying structured crypto trading strategies like HODLing, day trading, swing trading, scalping, and advanced techniques like arbitrage or hedging, traders can approach the market with confidence.
Success in crypto doesn’t come overnight. It’s built through education, discipline, and consistent execution. The right strategy—combined with risk management and emotional control—can turn crypto from a gamble into a rewarding investment journey.

Managing Risk in Trading1. Understanding Risk in Trading
Before managing risk, it’s crucial to define what “risk” means in trading.
Risk is the possibility of losing money when market moves go against your position.
Every trade has two outcomes: profit or loss. Risk is essentially the probability and magnitude of that loss.
Types of Risks in Trading
Market Risk – Prices moving unfavorably due to volatility, economic events, or news.
Liquidity Risk – Not being able to exit a trade quickly at a fair price.
Leverage Risk – Excessive use of borrowed funds magnifying both gains and losses.
Emotional Risk – Poor decision-making under stress, fear, or greed.
Systematic Risk – Broader economic or geopolitical factors affecting all markets.
Idiosyncratic Risk – Specific risks tied to one stock, sector, or currency pair.
The goal of risk management is not to eliminate risk but to control exposure, minimize downside, and maximize the probability of long-term profitability.
2. The Core Principles of Risk Management
Principle 1: Capital Preservation Comes First
The golden rule: Protect your trading capital before chasing profits.
If you lose too much capital, recovering becomes mathematically harder. For example:
A 10% loss requires 11% gain to break even.
A 50% loss requires 100% gain to break even.
Principle 2: Never Risk More Than You Can Afford to Lose
Traders must only invest money that won’t impact essential life expenses. This ensures psychological balance and prevents desperate decisions.
Principle 3: Position Sizing Matters
The size of your trade must reflect the amount of risk you are comfortable taking. Over-leveraging is one of the fastest ways traders blow up accounts.
Principle 4: Accept That Losses Are Part of the Game
No strategy wins 100% of the time. Even top hedge funds experience losing streaks. Successful traders don’t avoid losses—they limit them.
Principle 5: Consistency Over Jackpot
Risk management is about steady, compounding growth rather than chasing one big win.
3. Practical Risk Management Tools
3.1 Stop-Loss Orders
A stop-loss order automatically exits your position once the price hits a pre-defined level.
Example: If you buy a stock at ₹100, you might place a stop-loss at ₹95, limiting potential loss to 5%.
Benefits:
Removes emotional decision-making.
Limits catastrophic losses.
Provides a clear risk-to-reward framework.
3.2 Take-Profit Levels
Just like limiting losses, pre-deciding where to book profits is essential. Greed often prevents traders from closing positions, only to see profits vanish.
3.3 Risk-Reward Ratio
The ratio compares potential profit versus potential loss.
Example: Risking ₹100 to make ₹300 means a 1:3 risk-reward ratio.
Professional traders often only take trades with at least 1:2 or higher ratios.
3.4 Diversification
Avoid putting all money in one trade, sector, or asset class.
Example: If you’re trading equities, also balance with forex, commodities, or bonds.
3.5 Hedging
Using instruments like options or futures to reduce risk.
Example: If you own a stock, buying a put option can protect against downside risk.
3.6 Leverage Control
Leverage magnifies returns but also magnifies losses.
Conservative traders limit leverage to manageable levels (like 2x or 5x), while reckless use (50x or 100x leverage in forex/crypto) can wipe out accounts quickly.
3.7 Volatility Adjustment
Adjusting position size based on market volatility.
Higher volatility → smaller position sizes to avoid large swings.
4. Position Sizing Strategies
Position sizing determines how much of your capital you allocate per trade.
4.1 Fixed Percentage Rule
Risk only a small percentage of capital per trade (commonly 1–2%).
Example: With ₹1,00,000 account, risking 1% = ₹1,000 per trade.
4.2 Kelly Criterion
A formula-based approach to maximize long-term growth while avoiding overexposure.
Balances win probability and risk-reward ratio.
4.3 Volatility-Based Position Sizing
Larger positions in stable markets, smaller ones in volatile conditions.
5. Psychological Risk Management
Emotions are often a bigger risk than the market itself.
5.1 Fear and Greed
Fear prevents traders from entering good trades or causes early exits.
Greed leads to overtrading or holding on too long.
5.2 Discipline
Following a trading plan strictly, regardless of emotions, is crucial.
Consistency beats emotional improvisation.
5.3 Avoid Revenge Trading
After losses, many traders try to “win it back” quickly. This often leads to bigger losses.
5.4 Patience
Waiting for high-probability setups rather than forcing trades is key.
5.5 Mindset
Think like a risk manager first, trader second.
Your job is not to predict markets perfectly but to manage outcomes effectively.
6. Building a Risk Management Plan
A written plan brings discipline and removes impulsive decisions.
Components of a Risk Plan:
Capital at Risk – Decide max loss per trade and per day/week.
Stop-Loss Strategy – Where and how you’ll place stops.
Position Sizing – Percentage risk rules.
Diversification Rules – How to spread trades.
Risk-Reward Criteria – Minimum acceptable ratios.
Review & Journal – Record every trade and analyze mistakes.
7. Real-World Examples
Example 1: Stock Trading
Trader has ₹5,00,000 capital.
Risks 1% per trade = ₹5,000.
Buys shares worth ₹1,00,000 with stop-loss at 5%.
Max loss = ₹5,000 (within plan).
Example 2: Forex Trading
Account size = $10,000.
Risk per trade = 2% ($200).
Chooses 50-pip stop-loss.
Lot size adjusted so each pip equals $4 → max loss $200.
Example 3: Options Trading
Owns stock worth ₹2,00,000.
Buys protective put for ₹5,000 premium.
If stock crashes, loss is capped at strike price.
8. Common Mistakes in Risk Management
Overleveraging – Betting too big.
Moving Stop-Loss – Hoping market turns back.
Ignoring Correlation – Owning multiple assets that move together.
Risking Too Much Too Soon – Overconfidence after small wins.
No Trading Journal – Failing to learn from mistakes.
9. Advanced Risk Management Techniques
Value-at-Risk (VaR) – Statistical measure of max loss at a given confidence level.
Monte Carlo Simulations – Stress testing strategies under random conditions.
Drawdown Analysis – Limiting maximum decline from peak capital.
Trailing Stops – Locking in profits while allowing trades to run.
Options Strategies – Spreads, straddles, collars for advanced hedging.
10. Long-Term Survival Mindset
Trading is not a sprint, it’s a marathon. The objective is to stay in the game long enough to let skill and discipline compound profits.
Think like a casino: Casinos don’t know individual outcomes, but they manage probabilities and always win in the long run.
Compounding works slowly: Preserving capital and growing steadily beats chasing overnight riches.
Final Thoughts
In trading, you cannot control the market, but you can control your exposure, your decisions, and your discipline. Risk management transforms trading from a gamble into a professional endeavor. Without it, even the best strategies fail. With it, even modest strategies can compound wealth over time.
Part 8 Trading Master Class With ExpertsNeutral Market Strategies
Sometimes traders expect the market to move sideways with low volatility. Options shine here:
Straddle: Buy a call & put at the same strike.
Profits if stock makes big move (up or down).
Expensive because of double premium.
Strangle: Buy OTM call & OTM put.
Cheaper than straddle.
Needs a strong move in any direction.
Iron Condor: Sell OTM call + sell OTM put + buy far OTM call + buy far OTM put.
Profits if stock stays within a range.
Popular income strategy.
Butterfly Spread: Combine calls or puts at 3 strike prices.
Best when expecting very little movement.
Advanced Strategies
Calendar Spread: Sell near-term option & buy long-term option at same strike.
Benefits from time decay differences.
Ratio Spread: Sell more options than you buy.
High-risk, high-reward.
Diagonal Spread: Mix of calendar & vertical spread.
Box Spread: Combination that locks in risk-free profit (used by arbitrageurs).
📌 Takeaway: Strategies allow traders to play in bullish, bearish, or neutral markets while controlling risk. Mastery of strategies separates professional traders from gamblers.
