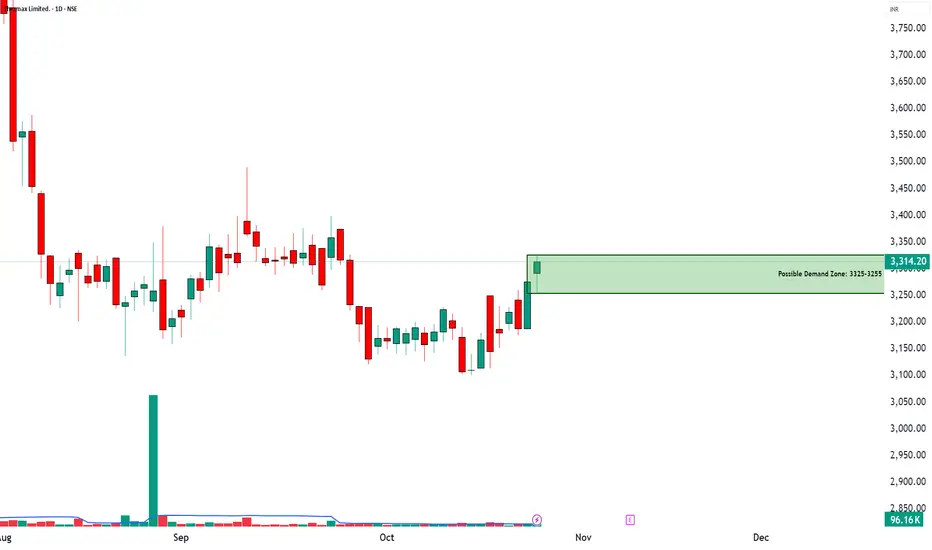
THERMAX LTD – Possible Demand Zone📈 THERMAX LTD – Possible Demand Zone in The Making - A possible Rally Base Rally
🔹 Entry Zone: 3325
🔹 Supports: 3271 / 3228 / 3201
🔹 Resistances: 3341 / 3368 / 3411
🔹 Swing Demand Zone: 3325–3255
🎯 STWP Trade View:
Thermax is showing early signs of trend reversal from recent consolidation.
A sustained close above 3340 may open the way for possible further upside move, while dips toward 3280–3260 can offer buying opportunities.
💡 Learning Note:
When price revisits a previously strong demand zone with low volume and then bounces sharply — it often signals the presence of smart money. Watch how price behaves near zone retests before scaling up.
Final Outlook:
Momentum: Building | Trend: Early Bullish | Risk: Controlled | Volume: picking up
________________________________________
________________________________________
⚠️ Disclosure & Disclaimer – Please Read Carefully
The information shared here is meant purely for learning and awareness. It is not a buy or sell recommendation and should not be taken as investment advice. I am not a SEBI-registered investment adviser, and all views expressed are based on personal study, chart patterns, and publicly available market data.
Trading—whether in stocks or options—carries risk. Markets can move unexpectedly, and losses can sometimes exceed the money you have invested. Past performance or past setups do not guarantee future results.
If you are a beginner, treat this as a guide to understand how the market works and practice on paper trades before risking real money. If you are experienced, always assess your own risk, position sizing, and strategy suitability before entering trades.
Consult a SEBI-registered financial adviser before making any real trading decision. By engaging with this content, you acknowledge full responsibility for your trades and investments.
Position Status: No active position in THERMAX at the time of analysis.
Data Source: TradingView & NSE India (Past Chart Reference) (Historical levels)
💬 Found this useful?
🔼 Give this post a Boost to help more traders discover clean, structured learning.
✍️ Drop your thoughts, questions, or setups in the comments — let’s grow together!
🔁 Share with fellow traders and beginners to spread awareness.
👉 “If you liked this breakdown, follow for more clean, structured setups with discipline at the core.”
🚀 Stay Calm. Stay Clean. Trade With Patience.
Trade Smart | Learn Zones | Be Self-Reliant 📊
THERMAX
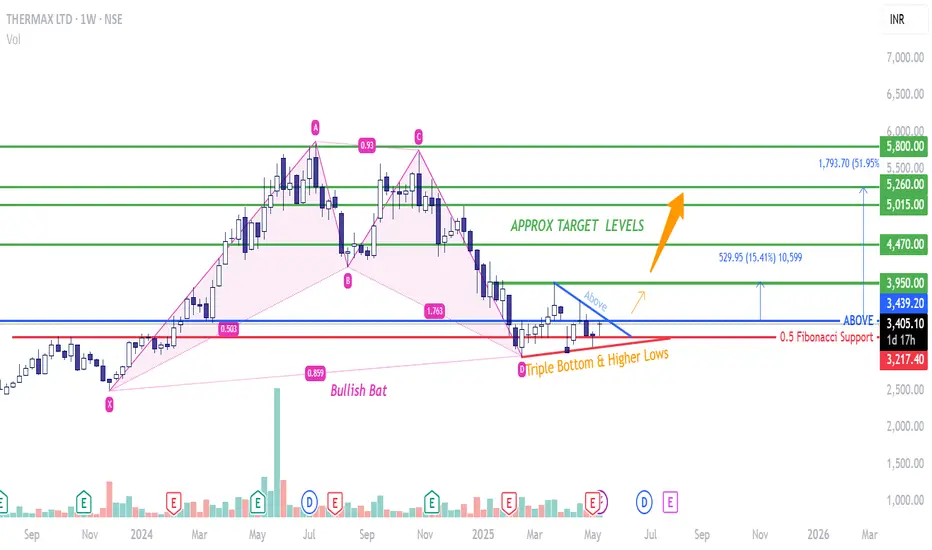
THERMAX - Bullish Bat -Bullish Bat is a harmonic pattern as shown in pink.
-Usually, during the base formation post making a Bullish bat pattern, a lot of big players accumulate which is then followed by a sudden spurt in prices.
- I see a triple bottom being made in an upward trend line suggesting Higher Lows.
- The base length can vary depending on the market scenarios. Patience is required in this kind of bamboo shoot stories.
- Here the base pattern suggests a symmetrical triangle is being formed. Too early to claim but so far looks like one. Hoping for a supersonic breakout from a symmetrical triangle pattern and a harmonic pattern.
THERMAX LTDTHERMAX LTD, Cup and handle formation, after handle tightening completed and then BO. Looking strong chart in weak market.

Flag and Pole Pattern After Reversing from a SupportNSE:THERMAX is making a Flag and Pole Pattern on Daily Charts after Reversing from a Strong Support Zone on the back of the news that NSE:THERMAX is going to ACQUIRE 100% STAKE IN BUILDTECH PRODUCTS FOR APPROX. 720 MILLION RUPEES.
A Breakout of the Flag will give a Bullish Momentum to the Stock Ahead.
🙋♀️🙋♂️If you have any questions about this stock, feel free to reach out to me.
📌Thank you for exploring my idea! I hope you found it valuable.
🙏FLLOW for more
👍BOOST if useful
✍️COMMENT Below your views.
Meanwhile, check out my other stock ideas below until this trade is activated. I would love your feedback.
Disclaimer: This analysis is intended solely for informational and educational purposes and should not be interpreted as financial advice. It is advisable to consult a qualified financial advisor or conduct thorough research before making investment decisions.

Thermax - Breakout Setup, Move is ON...#THERMAX trading above Resistance of 5218
Next Resistance is at 6256
Support is at 4367
Here are previous charts:
Chart is self explanatory. Levels of breakout, possible up-moves (where stock may find resistances) and support (close below which, setup will be invalidated) are clearly defined.
Disclaimer: This is for demonstration and educational purpose only. This is not buying or selling recommendations. I am not SEBI registered. Please consult your financial advisor before taking any trade.

Thermax - Breakout Setup, Move is ON...#THERMAX trading above Resistance of 3916
Next Resistance is at 5218
Support is at 3428
Here are previous charts:
Chart is self explanatory. Levels of breakout, possible up-moves (where stock may find resistances) and support (close below which, setup will be invalidated) are clearly defined.
Disclaimer: This is for demonstration and educational purpose only. This is not buying or selling recommendations. I am not SEBI registered. Please consult your financial advisor before taking any trade.

Short Term Trading Opportunity in Thermax for 25 % upsideHi,
An bullish on-neck Breakout pattern emerged on the Weekly chart of NSE:THERMAX
MACD on daily, weekly and monthly time frame is on the bullish side and also expecting the bullish setup to continue.
Level of Entry, Exit & Stop loss mentioned on the chart.
This idea is for educational purpose only. Take advice of your financial advisor before making any investment decision.

THERMAX | Swing Trade📊 DETAILS
Sector: Engineering - Industrial Equipments
Mkt Cap: 39,919 cr
Thermax Limited offers solutions to energy, environment and chemical sectors. The Company’s portfolio includes boilers and heaters, absorption chillers/ heat pumps, power plants, solar equipment, air pollution control equipment/system, water and waste recycle plant, ion exchange resins and performance chemicals and related services.
TTM PE : 80.03 (High PE)
Sector PE : 54.13
Beta : 0.44
📚 INSIGHTS
Strong Performer
Stock with consistent financial performance, quality management, and strong technical momentum indicating good investor enthusiasm. Currently valued at Good to expensive valuation
4.51% away from 52 week high
Outperformer - Thermax up by 5.3% v/s NIFTY 50 up by 1.1% in last 1 month
📈 FINANCIALS
Piotroski Score of 8/9 indicates Strong Financials
Disclaimer: This analysis is for educational purposes only, and I'm not a SEBI registered analyst.
If you found this analysis helpful, I encourage you to like and share it. Your observations and comments are also welcomed below. Your support, likes, follows, and comments motivate me to consistently share valuable insights with you.
🔍 More Analysis & Trade Setups 🔍
For more technical analysis and trade setups, make sure to follow me on TradingView: www.tradingview.com

Thermax - Long Setup, Move is ON...#THERMAX trading above Resistance of 3428
Next Resistance is at 3916
Support is at 2635.60
Here are previous charts:
Chart is self explanatory. Levels of breakout, possible up-moves (where stock may find resistances) and support (close below which, setup will be invalidated) are clearly defined.
Disclaimer: This is for demonstration and educational purpose only. This is not buying or selling recommendations. I am not SEBI registered. Please consult your financial advisor before taking any trade.


THERMAX - Swing Trade Analysis - 28th January #stocksTHERMAN (1D TF) - Swing Trade Analysis given on 28th Jan, 2024
Pattern: FALLING WEDGE BREAKOUT
- Volume Spike at Resistance - Done ✓
- Breakout - Done ✓
- Retest & Consolidation - In Progress
#stocks #swingtrade #chartanalysis #priceaction #traderyte #THERMAX

Target 1 (22%) achieved in Thermax. Target 2 is ON...This is follow-up on Thermax. Can check link to related ideas.
Target 1 achieved. More than 22%. Target 2 is ON.
Chart is self explanatory. Entry, Targets and Trailing Stop Loss are mentioned on the chart.
Disclaimer: This is for demonstration and educational purpose only. This is not buying or selling recommendations. I am not SEBI registered. Please consult your financial advisor before taking any trade.

1 Support and 1 Breakout trade idea for 26 July Markets I daily make educational content videos for swing / positional trading

THERMAX ANALYSIS - MAXED OUT JUST YET???This chart is self-explanatory, with highlighted 3 pairs of trendlines, 3 breakouts, 1 support level, and 2 resistance levels.
.
CMP - Rs. 2377
RESISTANCE - 1: Rs. 2501
RESISTANCE - 2: Rs. 2618
SUPPORT - Rs. 2214
.
Chart Patterns - Bullish Flag, Bullish Symmetrical Triangle, Descending Channel
.
This is just a view by an expert analyst, please invest at your own risk.
.
Follow me for more!

Thermax - Short term long TradeGood Short term trade - Analysis report.
Has formed a good Inverted head and shoulder :) and over all uptrend is intact... guess stock has long way to gooo....it is just start.
Buy nearer stop loss around 2250 or Near neck line as stock may come to retest the neck line(If we have patience :).
and consider neck line was SL
Target 2600+ ..
Keel Trailing stop loss with T1/T2/T3
Risk to Reward is 1:6 which is very good.

#ThermaxStock is moving in higher high direction, again retested BO level, keep look at entry level and target.

Thermax has taken support from last support levelThe stock has confirmed its reversal. Its time to accumulate the share.
But the safe trader cannot enter yet. The trend lines need to be taken out for a safe trader to enter.
Thermax is old company which has shown massive returns recently.
The company owner family is amazing and down to earth, they have Mr. Tata level vibes. Which is a symbol of trust for me.
Disclosure : I am not SEBI registered.The information provided here is for education purposes only.I will not be responsible for any of your profit/loss with this channel suggestions.Consult your financial advisor before taking any decisions

Thermax on SupportOne can look to add thermax at current levels as it tries to respect its trendline. I still believe that we (Indian Stock Market) will continue to outperform the US markets. Good zone to accumulate/buy. But if the current levels break, then exit; do not take unnecessary risk.

#Thermax Long (11 Aug)#Thermax Long (11 Aug)
RSI- 60
Trading in range since Jan around 2100
Yesterday's volume was good
Buy at CMP- 2140 or at 2100
SL- 2060
Target- 2235, 2330
Join us, Learn more, Earn more
We are not SEBI registered advisor
Charts and views are only for educational purpose
#NSE


THERMAX BO, bagged 17% intraday, further levels marked !!NSE:THERMAX
#NSE:THERMAX shaed with entry @ 2007 and zoomed up to 2347 = 340 points.
further good above 2320, support levels marked for practice.
Check out the details below the chart, signature column.
Happy LEarning !!

Thermax- Upflag BreakoutThermax Limited offers solutions to energy, environment and chemical sectors. The Company’s portfolio includes boilers and heaters, absorption chillers/ heat pumps, power plants, solar equipment, air pollution control equipment/system, water and waste recycle plant, ion exchange resins and performance chemicals and related services.

THERMAX- INVERTED HEAD & SHOULDERS PATTERN BREAKOUT.Swing Trade-Thermax Has Formed Inverted Head & Shoulder Pattern Breakout Daily Time Frame. Expect a 5-10 % Return on This Stock .only Education Purpose .
