Thyrocare (W): Strongly Bullish, Multi-Year BreakoutBased on Weekly Timeframe, Logarithmic Scale
This is a textbook, high-conviction breakout. The stock has decisively broken a 4-year consolidation, backed by strong fundamentals and a powerful confluence of high-timeframe technical indicators.
📈 1. The Multi-Year Setup
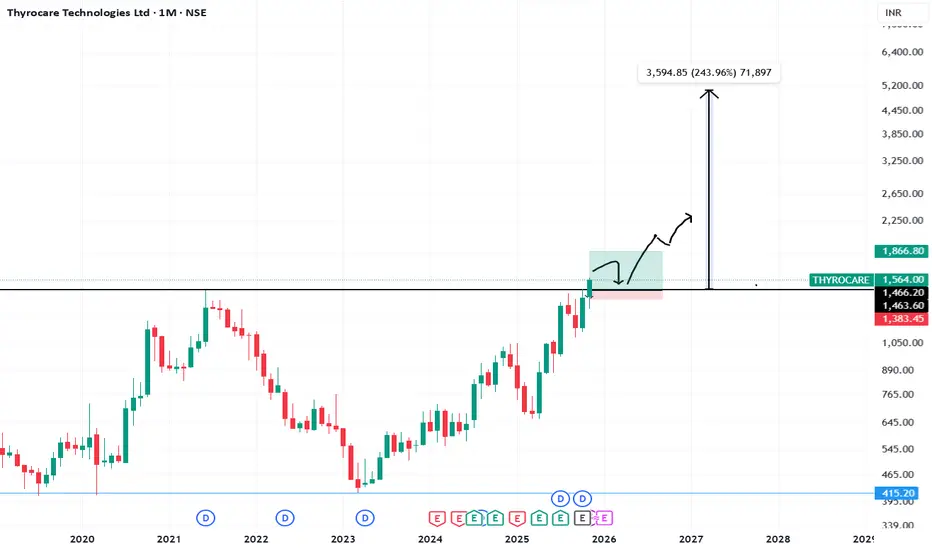
- The 2021 Peak: After its ATH in June 2021 (at ~₹1,465 ), the stock entered a steep, 2-year downtrend.
- The 2023 Bottom: This trend found its bottom in March 2023 .
- The Recovery & Base: Since then, the stock has been in a 2.5-year recovery, building a massive base. This upward move was further halted by the horizontal resistance at the ₹1,465 level, which it failed to break on previous attempts.
🚀 2. The Fundamentally-Driven Breakout (Last Week)
Last week, this entire 4-year pattern changed:
- The Catalyst: Strong Q2 2026 earnings provided the "fuel" for a major move.
- The Surge: The stock surged +12.43% for the week.
- The Volume: This move was backed by a 3.45 Million share volume spike. This comes after a period of average volume, confirming institutional interest.
- The Close: The stock achieved a weekly close above ₹1,465 , confirming the breakout is not just an intraday spike.
📊 3. Confluence of Bullish Indicators
The alignment on high timeframes is exceptionally bullish:
- RSI: The Relative Strength Index is rising on both the Monthly and Weekly charts.
- EMAs: The short-term Exponential Moving Averages are in a "PCO" (Price Crossover) state on both the Monthly and Weekly charts.
- Volume: A clear spike on the breakout after a steady rise, confirming the move's validity.
🎯 4. Future Scenarios & Key Levels to Watch
🐂 The Bullish Case (Continuation)
- Trigger: If the bullish momentum continues, the stock is in a new "blue-sky" uptrend.
- Target: The next logical long-term price target is at ₹2,000 levels.
🐻 The Pullback Case (Healthy Re-test)
- Trigger: If the stock pauses to digest its 12.5% weekly gain or if the broader market pulls back.
- Support: The price would likely fall to re-test the resistance-turned-support level at ₹1,465 . A "bounce" off this level would be a classic, healthy confirmation of the breakout and an ideal entry point for those who missed the initial surge.
THYROCARE

Thyrocare – ATH Breakout With Exceptional Volumes | Retest OpporThyrocare is showing a textbook All-Time-High (ATH) breakout backed by unusually strong volumes, a classic signal of institutional participation.
After spending years in consolidation, the stock has finally broken above its previous resistance zone, indicating a potential start of a fresh trending phase.
Thyrocare-A beautiful breakout is done!Thyrocare has given a good closing today above its previous ATH.
Stock has formed a beautiful rounding bottom pattern. Volumes buildup before breakout is decent as well.
Previously, i had covered Policybazar & Zomato with such patterns and they have given amazing returns.
Keep this stock in watchlist. This can give similar move as well.
Entering at ATH levels is tricky but these stocks come with excellent reward opportunity.
I am NISM certified RA and not SEBI registered.
This is not a recommendation but is shared for you to learn.

THYROCARE TECH LTD ANALYSISFOR LEARNING PURPOSE
THYROCARE TECH LTD - The current price of THYROCARE TECH LTD is 1085.45 rupees
I am going to buy this stock because of the reasons as follows-
1. Its coming out from a good consolidation base
2. It broke a strong resistance zone of 2.5 year and it's trying to go up towards new ATH
3. It is showing better relative strength as it stood strong in volatile times
4. The risk and reward is favourable
5. The stock belongs to a sector which is trying its best to be strong and probably it can do great in coming days.
6. The stock has done almost nothing in last 4 years (approx) and it has acted as a laggard (many stocks have made ATH much back)
Now it's trying to go up and the structure is improving.
I will buy it with minimum target of 35-40% and then will trail after that.
My SL is at 943.15 rupees
I will be managing my risk.

THYROCARE: Long Term ViewThe chart of THYROCARE provides delineates critical price thresholds that signify breakout point, along with specific support level that serve as indicators of where buying interest may manifest.
Additionally, the chart highlights regions likely to act as resistance point for future price ascension, allowing for informed decisions on entry and exit strategies.
Disclaimer: The information contained in this technical analysis report is intended solely for informational and educational purposes. It should not be interpreted as financial advice or a recommendation to buy or sell any security. Investors are strongly encouraged to conduct their own research and consult with a qualified financial advisor before making any investment decisions

Thyrocare for 70%+ gains after correctionDate: 3 Nov’24
Symbol: THYROCARE
Timeframe: Daily
Apparently, Thyrocare seems to be in Wave III which could conclude around 1000. Post which Wave IV correction could come down to 840-820 levels marked as Demand Zone in the chart. And Wave V then will be heading to 1430 to 1500 levels (70%+ from 830 levels) depending on where Wave IV ends. Its all time high price is 1465.
This is not a trade recommendation. Please do your own analysis.
HINGLISH VERSION
Jaahir taur par, Thyrocare Wave III mein lagta hai jo 1000 ke aaspaas samaapt ho sakta hai. Jiske baad Wave IV chart mein Demand Zone ke roop mein ankit 840-820 ke star tak neeche aa sakta hai. Aur Wave V tab 1430 se 1500 ke star (830 ke star se 70%+) ki taraf badh jaega, yah is baat par nirbhar karega ki Wave IV kahaan samaapt hota hai. Thyrocare ki all time high keemat 1465 hai.
Yah koi trade lene ki salah nahin hai. Kripya apana vishleshan khud karein.

Thyrocare - Waiting for Range BreakStock in Range - 625-665
Maybe waiting for results
Anyside breakout can give strong monetum
Waiting for breakout or breakdown

Thyrocare H&S breakout, Stage 1 breakoutStage 1 breakout, H&S pattern
Entry above 700-722
SL 620
Only for journaling not for the trading.
This post is for my personal use.
Note : only for learning, not a trading recommendation. i am posting as a trading journal before and after breakout.

ThyrocareBuy abv 740 close in weekly for upside confirmation.
Target - 900 , 1000
2nd scenario keep accumulate now. if u know the fundamental analysis.
Because I covered only technical.

THYROCARE - Ichimoku Bullish Breakout Stock Name - Thyrocare Technologies Limited
Ichimoku Cloud Setup :
1). Today's close is above the Conversion Line
2). Future Kumo is Turning Bullish
3). Chikou span is slanting upwards
All these parameters are showing bullishness at Current Market Price
and more bullishness AFTER crossing 710
#This is not Buy and Sell recommendation to any one. This is for education purpose and a helping hand to learn trading in Market.
# Cloud Trading
# Ichimoku Cloud
# Ichimoku Followers
I hope you all like my analysis.
Please do share your thoughts into comment section.
Please give a like, share & subscribe for daily analysis.

BUILDING BASE?Seems consolidated enough.
A very minimum risk set-up.
Can exit below.
Also API-Holding listing soon.

Thyrocare - Target -1600 - Almost 25 %The Scrip is in an ascending channel pattern bouncing from the lower trend line and 200 EMA.
Why to buy ?
1. Support at trend line/parallel channel
2. 200 EMA Support
3. 0.786 Fib retracement coincides with 200 EMA & Trend line,
Buy @ 1130-1170
Stop Loss - If it falls below 200 EMA and stays below it.
Traget - 1500/1550/1600

THYROCARENote:
1. Views are personal and for educational purposes only. Recheck and take the trade as per your RR.
2. Always remember SL is your lifeline, not the big target...
3.Follow us for more patterns and like, share so that we feel it is helpful to many and share more patterns...
3. Views given here is not a tip rather it is for educational purpose... Aftermarket opens, the condition might change so learn to handle different conditions...
4. To learn more about patterns, Psychology behind the trade, and price action trading... contact us... Thanks...
Keep an eye ladies and gentlemen. Cheers and Happy Trading

Thyrocare - Fundamentally Strong counterGood company to hold in portfolio as well as trading perspective
wait for breakout of trendline or buy above 1300 whichever suits you.
God risk reward counter

Intraday Description: Thyrocare Technologies Limited (daily): the stock has held the bottom side area around 1300 for the last one month. Looks like the flag breakout has already been given. This is a low volume
stock, so above the break, move will be quick in intraday.
1370 +is a new level to watch.
(nse: thyrocare)

Thyrocare Techno - BullishThyrocare Looking Bullish in Daily Chart, CMP is 1335. SL and Target marked on the Charts


Thyrocare Range BreakoutRange Breakout
Buy Thyrocare Technol
Closing Price - 1228.9
Buy 50% At Cmp
Add 50% Between 1115-1130
SL - 980 (Weekly Closing Basis)
Target - 1650++

Thyrocare Daily - BreakoutThyrocare breakout on the daily chart with rounding bottom pattern. Entry above the previous day (11th June ) high. Target will be depth of the cup pattern.

Thyrocare swing tradeAfter long consolidation stock ready to give a spurt in price. Can go long around CMP 1260 with SL at 1200


