Trade Setup: TITAN (Cash)📈 Trade Setup: TITAN (Cash)
Buy: ₹4005 (Current Market Price)
Stop Loss: ₹3980 (Daily closing basis)
Targets:
🎯 T1: ₹4090
🎯 T2: ₹4190
🔍 Technical Rationale
Price holding above short-term support zone
Higher-low structure intact on daily timeframe
Risk is well-defined (tight SL on closing basis)
Favorable risk–reward toward T1 & T2
⚠️ Risk Management
Exit only if daily candle closes below ₹3980
Partial profit can be booked near ₹4090
Trail stop loss once price sustains above ₹4090
🧠 Trade Type
Short-term swing trade
Time horizon: 3–10 trading sessions
Titan

Kalyan Jewellers – Elliott Wave analysis for breakout.Kalyan Jewellers – Elliott Wave Validation (Daily Chart, IST)
Big Picture Structure
• Primary trend: Bullish
• Current degree: Wave (5) in progress
• Wave (4): Completed near ₹440–445
• Market is now transitioning from early Wave (5) into impulsive expansion
________________________________________
Role of the Inverted Head & Shoulders (IH&S)
• IH&S has formed after Wave (4) → classic trend-resumption pattern
• This pattern is acting as:
o A reversal from correction
o A launchpad for Wave (5)
Key Pattern Levels
• Head: ~₹440–445 (Wave 4 low)
• Left Shoulder: ~₹495–505
• Right Shoulder: ~₹485–495
• Neckline: ~₹520–525
________________________________________
Breakout Condition (Critical Point)
If today’s candle closes 515 , it confirms breakout
More precisely:
• Daily close above ₹515 with volume
= Confirmed IH&S breakout
= Start of impulse inside Wave (5)
Projected Targets – Elliott-Compliant
Targets are valid Fibonacci expansions from Wave (4) low.
Reference Points
• Wave (4) low: ~₹445
• Breakout zone: ~₹525
🎯 Targets Explained
Target Basis
₹610 0.618 extension of Wave (5)
₹699 Equality with prior Wave (1) / mid expansion
₹799 1.618 extension → typical Wave (5) extreme
✔ All three targets are Elliott-legal and realistic
✔ ₹799 also aligns with previous Wave (3) high, which is common in Wave (5)

TITAN RANGE BREAKOUT WEEKLYTitan breaking a range weekly basis
with good volume last many weeks
bullish RSI above 60
strong q2 earnings,trading at ATH
target 4200 according to pivot point
NO BUY/SELL RECOMENDATION

TITANTITAN has successfully broken out of its resistance zone with strong volume support, indicating bullish momentum. Expecting further upside potential from here.

Titan on 1W TF1. Titan have taken support on long term support zone for 3 times.
2. Near support zone, it have formed bullish candlestick patterns.
In May 2025, it have formed Bullish Morubozu like candle which was last hit to support zone.
3. In first week of July 2025, there was a strong bearih candle with volume, despite that, stock have sustained near 3400 levels by consolidation and then have bounced back with 2 Bullish belt-holds in the bounce and have tested the long term resistance zone.
And now have retraced around 50%(July - Aug move).
4. Now the current levels are make or break levels, short term trend will be confirmed, bearish or bullish as per the move from these levels (50% zone).
Probability wise looks like it may take support, previous resistance zone should act as support as per price action.
Let's see how it moves further.
Disclaimer: This is not any stock tip/advice to buy or sell. Invest on your own risk.

Titan Breakout Watch: Spotting the Ideal EntryTitan has confirmed a clean breakout on the weekly timeframe. Watching to see whether momentum continues or if a pullback offers a better risk-reward entry.

Titan Company Limited: Poised for a BreakoutTitan Company Limited, currently trading at ₹3798, is showing strong signs of an uptrend continuation on its daily chart. The price structure suggests a potential breakout to new all-time highs, supported by a well-defined trend pattern.
🔺 Uptrend Continuation Pattern
The stock has been forming higher lows, indicating consistent buying interest at increasingly elevated levels.
This structure reflects a healthy uptrend, where each pullback finds support above the previous one.
🚀 Breakout Setup
Price action is now approaching a critical resistance zone, where previous highs capped upward movement.
A breakout above this level would signal renewed bullish momentum and open the path for further upside.
🎯 Target Projection
Based on the depth of recent pullbacks and the strength of the trend, the stock shows potential to move toward the ₹4800 mark.
This target aligns with the measured move from the base of the pattern to the anticipated breakout point.
✅ Confirmation Matters
While the setup is promising, confirmation of the breakout—preferably with strong volume and sustained price action—is essential.
Traders should watch for a decisive close above resistance to validate the move and reduce the risk of a false breakout.

Titan: Breakout Awaited ?Titan is up by almost 4% right now, and a flag pattern is quite visible. Probability of a breakout might be there provided it breaches the hurdle successfully with volume.
7% upside could be seen after the breach.
Note: Just an observation

TITAN - Bullish Reversal & Long-Term Growth StoryTITAN | Bullish Reversal & Long-Term Growth Story
Stock: Titan Company Ltd (NSE: TITAN)
Timeframe: Daily Chart
Pattern: Bullish Reversal from Key Support(Bullish Engulfing)
🏷️ Stock Intro
Titan is India’s leading lifestyle & jewellery retailer with brands like Tanishq, CaratLane and Fastrack. Strong brand equity and robust consumer demand keep Titan a long-term structural growth story.
🔎 Price Action
Current Price: ₹3,401.20
After a sharp fall from the 3,740 zone, Titan bounced off the bottom range near ₹3,303 with a strong bullish candle & above-average volume (see chart).
Key Fibonacci levels: 23.6% at 3,406, 38.2% at 3,470, and 61.8% at 3,573.
🧮 Technical Analysis
Trend: Medium-term uptrend remains intact despite recent correction.
Volume: Spike to 1.45M signals aggressive buying near support.
Momentum: Bullish engulfing candle with open = low indicates strong intraday demand.
🎯 Key Levels
Support: 3,346 / 3,297 / 3,255
Resistance: 3,437 / 3,473 / 3,528
Top Range: 3,740 (major breakout level)
📊 Volume & Indicators
Bullish VWAP confirmation with BBSqueeze OFF → potential breakout if liquidity holds.
🆕 Latest Update & Growth Outlook
FY28 EPS projected ~₹75–76 (21% CAGR).
High ROE (~35%) and sustained jewellery demand keep Titan a premium growth play.
💹 STWP Educational Trade Illustration
This illustration is only for learning purposes and not a recommendation to trade or invest.
Chart Observation: Price action shows a recent bullish reversal near the ₹3,300 support zone with strong volume.
Illustrative Setup: A trader studying this pattern might observe a potential entry area around ₹3,418 with a protective stop near ₹3,300 to manage risk.
Potential Price Zones: Key resistance zones lie near ₹3,740 and ₹3,850, which could act as future reference levels if the bullish momentum continues.
Valuation Outlook: Based on projected FY28 EPS of about ₹75–76 and an illustrative P/E multiple of 70×, some analysts estimate a theoretical long-term fair value band of around ₹5,300–₹5,500, provided growth assumptions hold.
⚠️ Risk Reminder
Gold price volatility and discretionary slowdown can impact margins.
Premium valuation (~80× trailing P/E) requires consistent earnings growth.
🏁 Final Outlook
Titan shows a strong reversal setup backed by robust fundamentals and premium brand positioning. Ideal for positional swing traders and long-term investors seeking compounding stories.
💡 Learning Note:
This setup demonstrates how price action + Fibonacci levels + surge in volume can signal a high-conviction reversal trade when aligned with long-term growth fundamentals.
⚠️ Disclosure & Disclaimer – Please Read Carefully
The information shared here is meant purely for learning and awareness. It is not a buy or sell recommendation and should not be taken as investment advice. I am not a SEBI-registered investment adviser, and all views expressed are based on personal study, chart patterns, and publicly available market data.
Trading—whether in stocks or options—carries risk. Markets can move unexpectedly, and losses can sometimes exceed the money you have invested. Past performance or past setups do not guarantee future results.
If you are a beginner, treat this as a guide to understand how the market works and practice on paper trades before risking real money. If you are experienced, always assess your own risk, position sizing, and strategy suitability before entering trades.
Consult a SEBI-registered financial adviser before making any real trading decision. By engaging with this content, you acknowledge full responsibility for your trades and investments.
💬 Found this useful?
🔼 Give this post a Boost to help more traders discover clean, structured learning.
✍️ Drop your thoughts, questions, or setups in the comments — let’s grow together!
🔁 Share with fellow traders and beginners to spread awareness.
👉 “If you liked this breakdown, follow for more clean, structured setups with discipline at the core.”
🚀 Stay Calm. Stay Clean. Trade With Patience.
Trade Smart | Learn Zones | Be Self-Reliant 📊

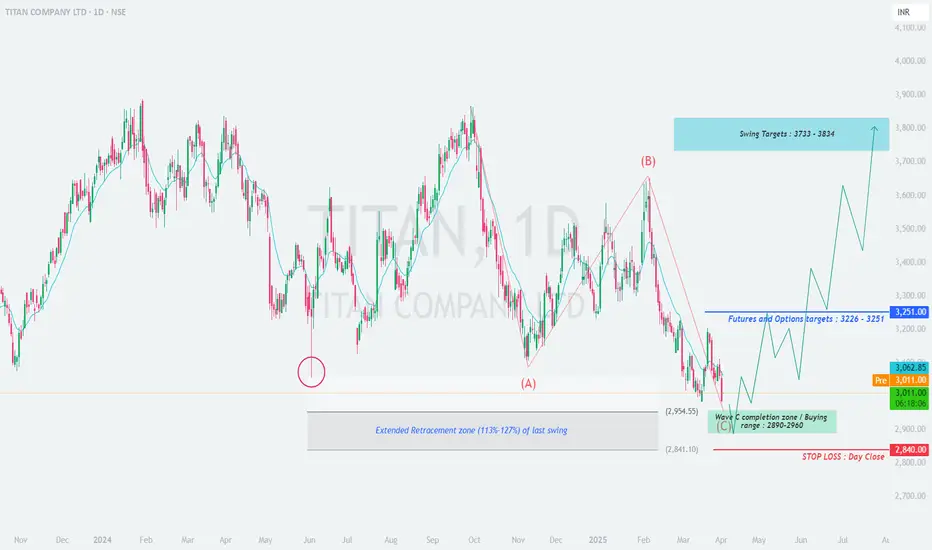
TITAN - High Probability Reversal SetupTITAN COMPANY LTD (NSE:TITAN) - High Probability Reversal Setup
Weekly Timeframe Analysis | Potential Swing Trade Opportunity
▲ BULLISH CASE
Elliott Wave Structure:
• Appears to be completing Wave C of correction (ABC pattern)
• Wave C = 1.272 extension of Wave A at ₹2,890-2,960 zone
• Typical reversal area for such corrections
Technical Confluences:
• Fibonacci Support:
1.127-1.272 retracement of prior uptrend
Aligns with 2023 swing high area
• Volume Profile:
High volume node at ₹2,920
Declining volume on recent downmove
Pattern Recognition:
• Potential falling wedge (bullish)
• RSI(14) weekly showing bullish divergence
• MACD histogram flattening near lows
▼ RISK FACTORS
• Breakdown below ₹2,840 invalidates setup
• Broader market weakness could delay recovery
• FIIs reducing positions in consumer sector
📊 Trade Plan
Entry Zone: ₹2,890-2,960 (scale-in approach recommended)
Stop Loss: Daily close below ₹2,840 (absolute)
Targets:
T1: ₹3,226 (61.8% retrace)
T2: ₹3,733 (previous high)
T3: ₹3,834 (127% extension)
Timeframe: 8-12 week hold for full targets
📌 Key Levels
Support
Resistance
₹2,960 (immediate)
₹3,100 (200 DMA)
₹2,890 (strong)
₹3,226 (F&O OI peak)
₹2,840 (absolute)
₹3,733 (ATH)
💡 Additional Notes:
• Watch for bullish reversal candle patterns in the zone
• FII derivative data shows put writing at ₹2,900 strike
• Consumer sector showing relative strength vs Nifty
Would you take this trade? Discuss in comments!
#TITAN,#NSE,#swingtrading,#elliottwave,#technicalanalysis
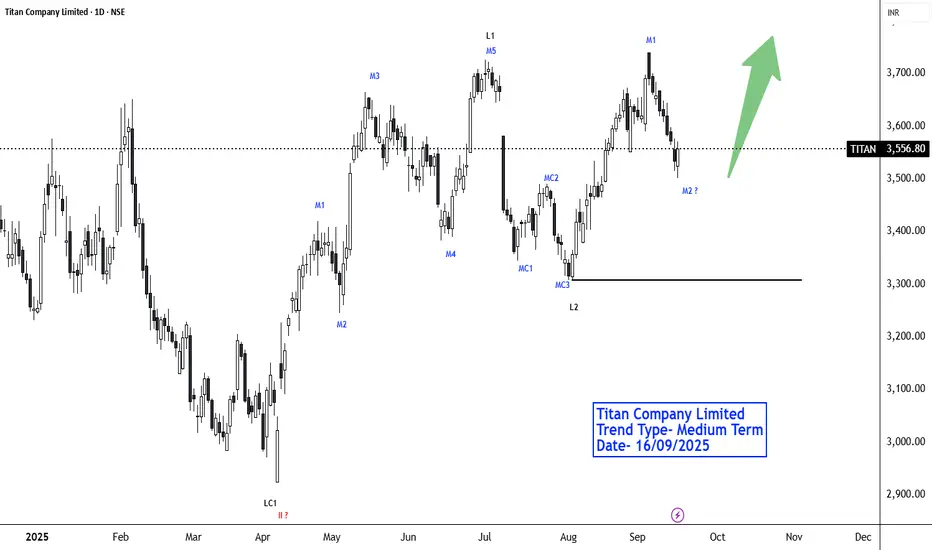
Titan - Potential up movement in future swingsHi everyone
Welcome to intelligent investor, we provide market insights by synchronising and combining all the price action waves from different time frames and gives you single trend.
Keynotes
## Titan is at good retracement levels.
## Trade with risk management that is 1 percent rule, not even 2 percent
because with neowave or wave counts you gets plenty of swings to add more that is after confirmation of price action.
______________________________________________________
If you see different keyword in charts, here is the meaning and an explaining video will be made in some time how to read and trade with these waves charts. Still if you have any query , you can leave a comment, i will be happy to answer your query.
Keyword Mean-
S- Short Term Trend
M- Medium Term Trend
L- Long Term Trend
1,2,3,4,5 are wave bullish or bearish wave count
C- mean consolidation or correction
X- Like a joint in a trend or consolidation.
Titan looking good for a 10% upmove to All time high??!!Just a simple Cup and handle pattern...depth of the cup to be the target....
10% from now would be the target level.
Immediate resistance 3726.50...needs to break it!!!!
Looking good in monthly time frame too...with 3 white soldiers candles following a consolidation ....we can expect a good rally if wider markets don't make a panic down move ahead!!!
just my view...not a tip nor advice!!!
Thank you!!!
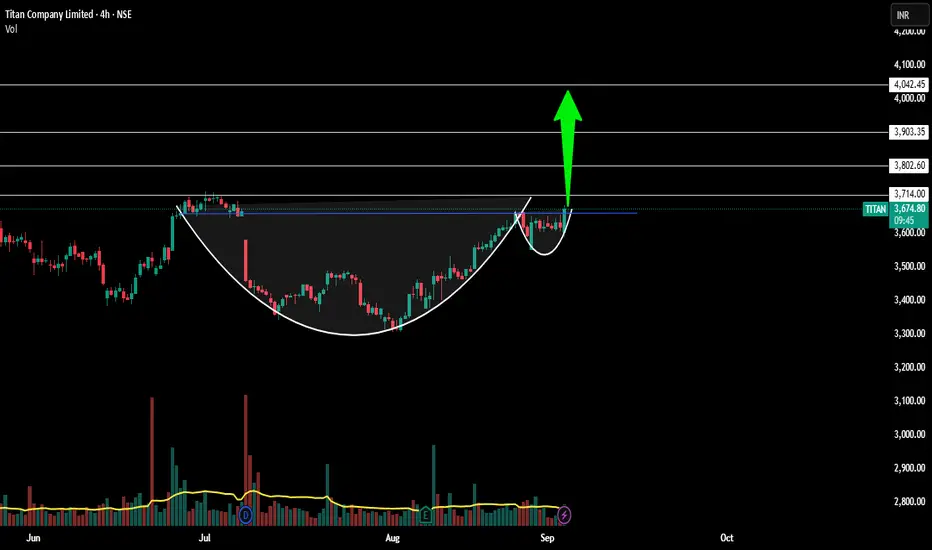
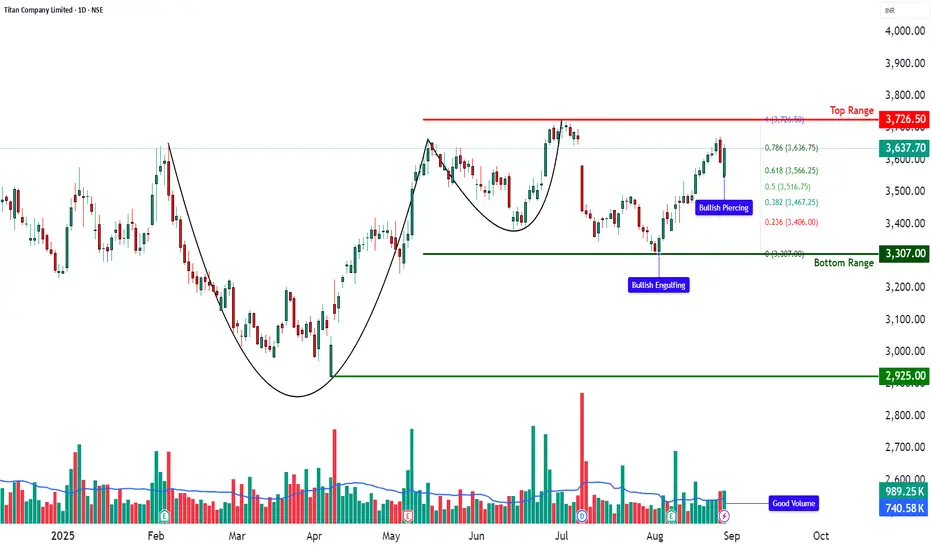
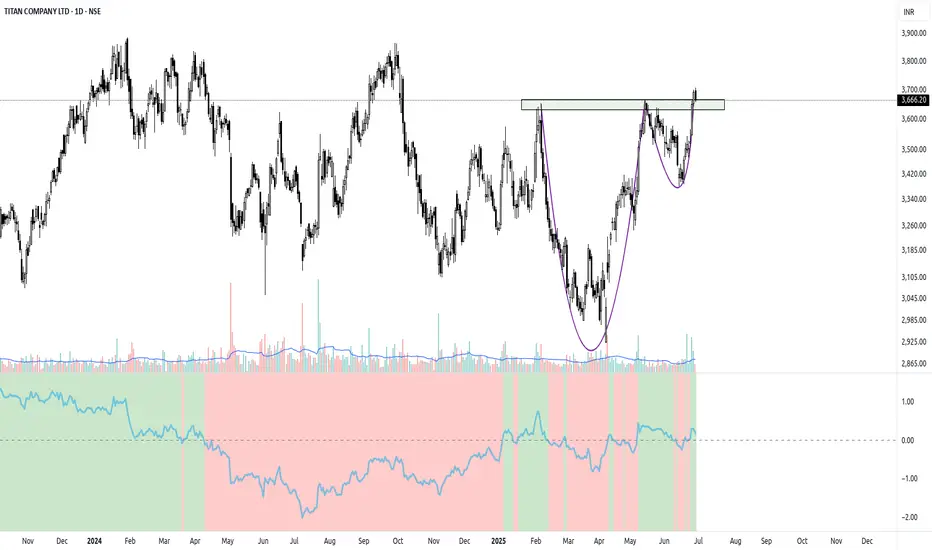
TITAN – Cup & Handle Breakout Retest📊 TITAN – Technical & Fundamental Educational Snapshot
Ticker: NSE: TITAN | Sector: Consumer – Lifestyle & Jewellery
CMP: ₹3,637.70
Rating: ⭐⭐⭐⭐ (Bullish Setup – For Educational Purposes Only)
Pattern Observed: ☕📈 Cup & Handle Breakout Retest
📊 Technical Observations
Titan Company Ltd. (CMP: ₹3,637.7) is presently exhibiting a Cup & Handle formation, with the price recently retesting the handle zone around ₹3,550–₹3,600 and showing signs of strength supported by healthy volumes. On the technical front, important resistance levels are noted around ₹3,675, ₹3,712, and ₹3,773, while support levels lie near ₹3,576, ₹3,515, and ₹3,477. Key indicators currently reflect positive momentum, with RSI around 65, MACD showing bullish signals on multiple timeframes, and CCI at 92, while the Stochastic indicator is in the higher zone (88–94), suggesting overbought but trending conditions. Volumes stood at ~989K, higher than the 20-day average of ~740K, indicating increased participation. Price action is also holding above VWAP, with Bollinger Band dynamics hinting at the possibility of trend continuation.
📰 Fundamental & News Flow
In its Q1 FY26 results, Titan Company Ltd. reported around 11% year-on-year revenue growth, primarily supported by sustained jewellery demand, although margins were modestly affected due to gold price volatility. The company continues to witness healthy traction in its Tanishq jewellery and Titan Eye+ businesses, alongside a recovery trend in watches and wearables. Titan has also been pursuing aggressive retail expansion, and the upcoming festive season is expected to support consumer demand further. From a structural perspective, the company is often highlighted for its premium brand positioning, robust balance sheet, and long-term jewellery demand drivers, which are considered key strengths in its sector.
📊 STWP Trade Analysis (Educational Purpose Only):
The recent price action indicates a Bullish Engulfing pattern followed by a Bullish Piercing formation, which are generally studied as signs of positive sentiment when supported by volumes. After the retest, a reference level around ₹3,726.50 may be noted, while the Bullish Piercing structure also highlights an observation zone near ₹3,650.90, with further upward reference levels around ₹3,752 and ₹3,854, and a protective support reference near ₹3,549. From a Fibonacci retracement perspective, a pullback level is visible near ₹3,566, with an invalidation reference around ₹3,516.
Options Watchlist — An Educational View of OI & Price Action________________________________________
📊 Options OI Trade Outlook — Bullish Setups Only
“This analysis is shared purely for educational purposes and market awareness — not a trading recommendation.”
(Educational Purpose | Not Financial Advice | SEBI Compliant)
Hello Traders 👋,
Here are 5 Bullish option setups based on today’s OI + Price Action + IV + Greeks study.
This is strictly for learning and educational purposes.
________________________________________
🟢 1. MARUTI 14800 CALL
LTP: 383.95
Sentiment: Bullish | Trend: Up | Strength: 5/5 (Strong)
IV: 20.5 | Delta: 0.53 | Theta: -8.64 | Vega: 17.6
Buildup: Long Build-up
Why?
This strike shows a Long Build-up with price rising 10.1% and OI up 38.2%, a textbook bullish confirmation.
Though volume dipped (-25.7%), IV rose 8.4% supporting premium expansion. Delta 0.53 signals strong ITM probability.
________________________________________
🟢 2. MARUTI 14700 CALL
LTP: 436.15
Sentiment: Bullish | Trend: Up | Strength: 5/5 (Strong)
IV: 20.5 | Delta: 0.56 | Theta: -8.66 | Vega: 17.4
Buildup: Long Build-up
Why?
14700 CE shows a Long Build-up with price up 9.8% and OI up 15.7%, confirming bullish sentiment.
Volume is lower (-33.5%), but IV rising 9.2% supports premiums. Delta 0.56 shows strong ITM odds.
________________________________________
🟢 3. ADANIENT 2300 CALL
LTP: 70.15
Sentiment: Bullish | Trend: Up | Strength: 5/5 (Strong)
IV: 27.6 | Delta: 0.52 | Theta: -2.35 | Vega: 2.7
Buildup: Long Build-up
Why?
2300 CE has a Long Build-up with price up 4.4% and OI soaring 81%, backed by a 219% volume surge.
IV rising 5.5% confirms premium expansion. Strong participation makes this a convincing bullish setup.
________________________________________
🟢 4. TITAN 3650 CALL
LTP: 77.4
Sentiment: Bullish | Trend: Up | Strength: 5/5 (Strong)
IV: 16.6 | Delta: 0.53 | Theta: -2.13 | Vega: 4.3
Buildup: Long Build-up
Why?
3650 CE shows a Long Build-up, with price rising 22.2% and OI up 46.2%, supported by strong volume (+89%).
IV is moderate at 16.6, and Delta at 0.53 signals strong ITM chances.
________________________________________
🟢 5. POLYCAB 7200 CALL
LTP: 184
Sentiment: Bullish | Trend: Up | Strength: 5/5 (Strong)
IV: 24.3 | Delta: 0.51 | Theta: -6.32 | Vega: 8.5
Buildup: Long Build-up
Why?
7200 CE has a powerful Long Build-up, with price up 5.8% and OI surging 364%, supported by a massive 1552% volume jump.
IV at 24.3 is stable but rising, confirming strength.
________________________________________
⚠️ Disclaimer – Please Read Carefully
The information shared here is meant purely for learning and awareness.
It is not a buy or sell recommendation and should not be taken as investment advice.
📌 I am not a SEBI-registered investment advisor.
📌 All views expressed are based on personal study, chart patterns, and publicly available data.
📌 Trading — whether in stocks or options — carries risk. Markets can move unexpectedly, and losses can exceed capital.
📌 Past setups do not guarantee future outcomes.
👉 Beginners: use this to learn market behavior, practice with paper trades before risking money.
👉 Experienced traders: apply your own risk management, sizing, and strategy filters.
👉 Always consult a SEBI-registered financial advisor before real trades.
By engaging with this content, you acknowledge full responsibility for your own trading and investments.
________________________________________
💬 Found this useful?
🔼 Boost this post to help more traders learn.
✍️ Share your thoughts/setups in comments — let’s grow together.
🔁 Share with fellow traders & learners.
👉 “Follow for more clean, structured breakdowns with discipline at the core.”
🚀 Stay Calm. Stay Clean. Trade With Patience.
Trade Smart | Learn Zones | Be Self-Reliant 📊
________________________________________
TITAN – Preparing for the Next Move?🔍 Technical Structure:
1. Base Formation & Breakout
Titan was consolidating in a well-defined sideways range between ~₹3,400 and ₹3,670 for the last four months.
A clean breakout above the range occurred recently, marking a bullish change of character.
The breakout was accompanied by above-average volume, suggesting institutional activity.
2. Retest in Progress
After the breakout, price is pulling back to retest the breakout zone (~₹3,640–₹3,670).
This retest is healthy as long as it stays above previous resistance. If it dips too far below ₹3,640 and sustains, it may invalidate the breakout (a.k.a. false breakout).
3. Volatility Contraction Pattern (VCP)
Leading up to the breakout, Titan displayed progressively tighter price contractions.
This Volatility Contraction Pattern is a classic setup where price compresses before expanding explosively.
If the stock consolidates for a few more sessions with lower volatility and tight ranges near support, it could form a final contraction leg, potentially followed by a strong breakout.
4. Relative Strength
The Relative Strength (RS) line vs Nifty has turned positive on the weekly chart – an early sign that Titan may start outperforming the index again.
On the daily, RS has been rising steadily since early June, aligning with bullish price structure.
5. Moving Averages Alignment
The stock is currently trading above all major moving averages (20, 50, 100, 200 EMA), which are now in a bullish alignment.
The 200 EMA acted as dynamic support in the earlier stages of the base.
📈 Trading Plan & Bias
Bullish Bias (if base retest holds):
A successful retest of the breakout zone (around ₹3,640–₹3,670) with a bounce on volume could trigger the next leg higher.
Potential target zones: previous swing highs and psychological levels (₹3,800+, possibly ₹4,000 over time).
Invalidation / Risk:
A breakdown back into the range and sustained trade below ₹3,600 could imply a false breakout.
Wait for a decisive reclaim in that case.
Conclusion
Titan looks technically strong after breaking out from a multi-month range.
While the current pullback might look like weakness on the surface, this could be a textbook retest or a final contraction before a strong upside move.
Keep this stock on your radar for:
Bounce confirmation near support
Breakout from a tighter VCP
Volume-led upmove resumption
Titan - Trendline BO Post Q4 - Chart of the Week NSE:TITAN has a beautiful structure in the Weekly Timeframe and qualifies for my Chart of the Week idea post decent Q4 Results.
About:
NSE:TITAN is among India’s most respected lifestyle companies. It has established leadership positions in the Watches, Jewellery and Eyewear categories, led by its trusted brands and differentiated customer experience. It was founded in 1984 as a joint venture between TATA Group and Tamil Nadu Industrial Development Corporation (TIDCO).
Technical View:
The stock has decisively broken above a major descending trendline (marked with a white line) that had contained price action since July-August 2024. This trendline has been respected multiple times over approximately 8-9 months, making today's breakout particularly significant.
The breakout occurred with substantial price momentum, as indicated by the large green candle and 5 %+ gain, suggesting conviction behind the move.
A critical demand zone (marked in green) around ₹2,900-3,000 that has repeatedly provided strong support. This zone has been tested and respected at least four times (marked with green arrows), demonstrating its importance as a major technical floor.
Since January 2025, the stock has formed progressively higher lows, indicating increasing buying interest at higher price levels.
Support and Resistance Analysis:
Key Resistance Levels
Immediate Resistance: ₹3,600 (horizontal level from previous swing highs)
Major Resistance: ₹3,886.95 (52-week high/all-time high)
Psychological Resistance: ₹3,750 (round number between current price and highs)
Key Support Levels
Immediate Support: ₹3,400-3,450 (previous resistance turned support)
Trendline Support: ₹3,350 (the broken trendline should now act as support)
Critical Support: ₹2,900-3,000 (major demand zone that has consistently held)
Structural Support: ₹2,750 (low of the most recent significant pullback)
Trade Setup:
The combination of a clean trendline breakout, strong momentum, and historically reliable support zone suggests Titan Company may be poised for continued upside. Based on technical projections:
Target(Take Profit):
Near-term Target: ₹3,700-3,750 (measured move from the breakout point)
Intermediate Target: ₹3,886.95 (retest of previous high)
Longer-term Potential: New all-time highs above ₹3,900 if momentum continues
Stop Loss:
The critical factor to watch will be whether the stock can maintain positions above the broken trendline on any pullbacks. This would confirm the validity of the breakout and strengthen the bullish case. Conversely, a failure to hold above ₹3,400 could signal a false breakout scenario.
Keep in the Watchlist and on your Radar.
NO RECO. For Buy/Sell.
📌Thank you for exploring my idea! I hope you found it valuable.
🙏FLLOW for more
👍BOOST if useful
✍️COMMENT below with your views.
Meanwhile, check out my other stock ideas on the right side until this trade is activated. I would love your feedback.
Disclaimer: "I am not SEBI REGISTERED RESEARCH ANALYST AND INVESTMENT ADVISER."
This analysis is intended solely for informational and educational purposes and should not be interpreted as financial advice. It is advisable to consult a qualified financial advisor or conduct thorough research before making investment decisions.

Titan | Swing | Breakout Titan has just given a clean trendline breakout followed by a successful retest, which makes this setup quite interesting from a positional swing trade perspective.
✅ Trendline Breakout
• The stock broke a strong descending trendline that had been acting as resistance for several months.
✅ Retest and Bounce
• After the breakout, Titan came back to retest the breakout level near ₹3,380, which held well — a classic bullish sign. This bounce happened around the 38.2% Fibonacci retracement zone — another technical confluence that adds weight to the trade idea.
⸻
📈 Entry, Targets & Stop Loss
• Entry Zone: Around ₹3,665 – ₹3,695
• Stop Loss (SL): Below ₹3,202
Important note: If price breaks below ₹3,500 without RSI crossing 75, it might lead to negative RSI divergence — a warning of weakening momentum. In that case, better to exit to avoid capital getting stuck.
⸻
🎯 Targets Based on Fibonacci Extensions:
• Target 1: ₹4,123
• Target 2: ₹4,324
• Target 3: ₹4,580
These targets are calculated using Fibonacci extension levels, with the final one being the 1.618 golden ratio zone.
⸻
Disclaimer: Do your own analysis before putting money in investment. Idea is for education purpose to share and learn within trading view community. Not a suggestion to put your hard earn money.

Titan - Keep On WatchCMP 3652 on 26.06.25
The chart itself is self-explanatory. The price has formed a Cup & Handle-like pattern since February 2025. This time, it is reaching the breakout levels.
MACD shows a likely reversal, too.
If it breaks out, it may go bullish to reach the levels of 3850, 4050, and potentially higher, depending on the market conditions.
In case of any correction, support levels are around 3510.
One may plan entry on different levels while considering risk management and position size.
All these illustrations are only for learning and sharing purposes; it is not buy or sell advice. Please do your research before taking any trade.
All the best.

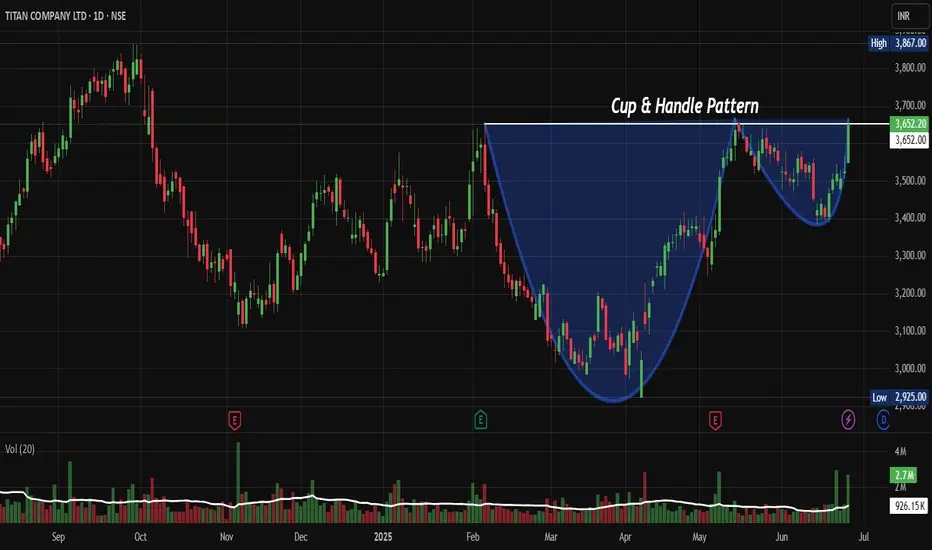
Titan: Cup & Handle Pattern Signals Major Uptrend ContinuationNSE:TITAN Cup & Handle Pattern Signals Major Uptrend Continuation after Macquarie sees Q1 growth on jewellery demand
Price Action Analysis:
• Stock has formed a classic Cup & Handle pattern over an 8-month period from February 2025 to June 2025
• Cup formation shows a rounded bottom with depth of approximately 800 points (3,700 to 2,900 levels)
• Handle formation displays controlled consolidation with lower volatility, indicating institutional accumulation
• Price action demonstrates strong momentum with a 3.58% daily gain and healthy volume expansion
Volume Spread Analysis:
• Volume pattern confirms the Cup & Handle formation with classic volume characteristics
• During cup formation, volume contracted during the decline and expanded during recovery
• Handle formation shows diminishing volume, indicating reduced selling pressure
• Recent breakout accompanied by significant volume spike (2.7M vs average), confirming institutional participation
• Volume-price correlation remains positive, supporting the bullish breakout thesis
Key Technical Levels:
Support Levels:
• Primary Support: 3,500
• Secondary Support: 3,400
• Major Support: 3,200
Resistance Levels:
• Immediate Resistance: 3,700 (Previous highs and psychological level)
• Major Resistance: 3,867 (52 Week high marked on chart)
• Extended Target: 4,200 (Cup & Handle measured move target)
Technical Patterns Identified:
• Cup & Handle Pattern: Primary bullish continuation pattern spanning 5 months
• Ascending Triangle: Within the handle formation, showing higher lows
• Volume Accumulation Pattern: Consistent with institutional buying during consolidation phases
Trade Setup:
Entry Strategy:
• Primary Entry: 3,650-3,680 (Current levels on any minor pullback)
• Secondary Entry: 3,580-3,620
• Aggressive Entry: Market price for momentum traders
Exit Levels:
• Target 1: 3,800 (Near-term resistance, book 30% profits)
• Target 2: 3,950 (Previous highs breach, book 40% profits)
• Target 3: 4,200 (Cup & Handle measured move, remaining 30%)
Risk Management:
• Stop Loss: 3,480 (Below handle low with 5% buffer)
• Risk-Reward Ratio: 1:3 (Risk of 170 points vs reward of 500+ points to first major target)
• Maximum Risk per Trade: 2% of portfolio capital
Position Sizing:
• Conservative Approach: 1-1.5% of portfolio given the strong setup
• Moderate Approach: 2-2.5% for traders comfortable with mid-cap volatility
• Scale-in Strategy: 50% on initial entry, 30% on any dip to secondary entry, 20% on momentum confirmation
Sectoral and Fundamental Backdrop:
Sector Analysis:
• Consumer Discretionary sector showing resilience amid economic recovery
• Jewellery and watches segment benefiting from the wedding season demand and festival purchases
• Luxury consumption trends supporting the premium positioning of Titan's brands
• Rural demand recovery provides an additional growth catalyst for the company
Fundamental Highlights:
• Strong brand portfolio including Tanishq, Titan, Fastrack, and Sonata
• Consistent market share gains in the organised jewellery retail segment
• Digital transformation initiatives are improving operational efficiency
• Expansion in tier-2 and tier-3 cities driving geographical diversification
Macroeconomic Factors:
• Favourable gold price trends supporting jewellery business margins
• Rising disposable income in Indian households is boosting luxury spending
• The government's focus on organized retail supporting compliant players like Titan
• Wedding season and festival demand provide seasonal tailwinds
Key Risks to Monitor:
• Gold price volatility is impacting raw material costs and consumer demand
• Competition from online jewellery platforms and regional players
• Economic slowdown potentially affecting discretionary spending
• Regulatory changes in gold import duties or GST rates
My Take:
This technical setup presents a compelling risk-reward opportunity with the Cup & Handle pattern completion, strong volume confirmation, and favourable sectoral backdrop supporting the bullish thesis for Titan Company.
Keep in the Watchlist.
NO RECO. For Buy/Sell.
📌Thank you for exploring my idea! I hope you found it valuable.
🙏FOLLOW for more
👍BOOST if you found it useful.
✍️COMMENT below with your views.
Meanwhile, check out my other stock ideas on the right side until this trade is activated. I would love your feedback.
Disclaimer: "I am not a SEBI REGISTERED RESEARCH ANALYST AND INVESTMENT ADVISER."
This analysis is intended solely for informational and educational purposes and should not be interpreted as financial advice. It is advisable to consult a qualified financial advisor or conduct thorough research before making investment decisions.
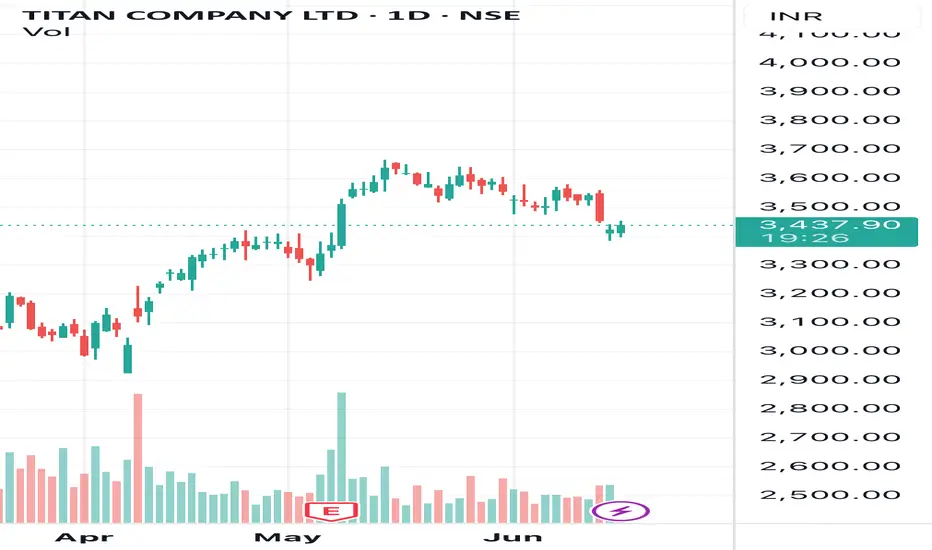
Technical Analysis (TITAN - Daily Chart):📊 Trend and Candle Pattern:
• The stock showed strong recovery between March and April.
• There was a bullish rally from April to May, reaching highs above 3600.
• After hitting resistance, it has seen a minor correction and is now trading around 3436.40.
🔴 Moving Average (Likely 200-DMA):
• The red line on the chart appears to be the 200-day moving average (DMA), which is currently at 3385.91.
• The current price is above the 200-DMA, indicating that the stock remains in a bullish zone.
• If the price falls below 3385, it may signal weakness or a trend reversal.
🧱 Support and Resistance:
• Immediate Support: 3385 (200 DMA)
• Major Support: Around 3300
• Resistance Zone: 3600–3650 (recent highs)
📈 Performance:
• The stock has shown a 5.80% gain, indicating positive momentum over the recent period.
⸻
📌 Conclusion:
• As long as the price remains above the 200-DMA (3385), the trend is bullish, and traders can consider a “buy on dips” strategy.
• A close below 3385 could trigger further downside.
• The current trend appears to be sideways to mildly bullish.
Note : not a buying or selling recommendation only for education purposes
TITAN: Bullish continuation after retest of trendlineRSI is still above 50, indicating bullish sentiment, and prices are at the retesting level of the trendline, providing another opportunity to buy.
Right now, it is advised to wait and reconfirm this level as support for any buying entry confirmation.
RSI is also above the breakout trendline. If the oscillator breaks the supporting trendline, then prices will show weakness and may enter the supply zone.

TITAN ready to touch 4000C&H pattern in W
presently near to resistance.
MA supports are taken.
Strength in RSI.
As per fib retracement, the target should be 4000 or more.

Titan - Keep On WatchCMP 3580 on 03.02.25
The above chart shows that the price has been traveling in a rising parallel channel in recent sessions. At this moment, the price has touched the upper edge of the channel. If rejected from these levels, a bearish move may be seen further.
Targets may be 3510/3330 and 3190.
Please keep in mind the earnings day around 4th February.
This setup fails if the price sustains above 3710.
Plan your trade as per your risk management. ( entry and exit)
The above illustration is my view. It is only for learning and sharing purposes, not a trading recommendation.
All the best.
