Titan


TITANIt has made a Bearish Harmonic Bat in daily time frame. It could retrace till 1200/1175/1100 provided it does not start sustaining above 1270 once again.
Harmonic Patterns are derived from Fibonacci Ratios when each angle of retracement aligns to confirm a reversal probability of 38-50-62 % of the existing trend.

#Oct13 - TITAN (intraday + swing)After breaking out from a range, the stock is again consolidating. Look for break out above these levels:-
Buy above 1268
Sell below 1236
Note:
Avoid the stock if a big gap up or gap down is seen
Enter after the breakout happens and not before it
Do not chase the market, i.e., do not get involved in late entries
Only enter with strict stop-loss and target
This is not a recommendation and is for educational purposes only.
always follow risk-reward and quantity management for the 100% of the times
The above mentioned idea may not work, so beware of the risk you are taking
Follow me on tradingview to get such intraday and swing picks everyday.
Happy Trading!!

Titan: Having Red Bull : Gives it wingsa. Zone: Strong Bull
b. Resistance 1: 1291.10
c. Resistance 2: 1335.60
d. Support 1: 1083.30
e. Support 2: 1053.60
NSE:TITAN

TITAN :- no trading zoneTitan at no trading zone, sustaining at 1268 might push towards 1297,1313
Sustaining below 1232 might push towards 1212, 1196, 1179
Regards

#Oct12 - TITAN (intraday+swing)The stock has been continuously testing the resistance at 1268, there is a very good chance for the breakout to happen. This is an intraday as well as a swing trade recommendation. Also if you look the history of the stock, you will see the stock is bullish and it had given a breakout just last week. You can check my past analysis on titan, you would see a successfull analysis just last week.
Buy above 1268
Note:
Avoid the stock if a big gap up or gap down is seen
Enter after the breakout happens and not before it
Do not chase the market, i.e., do not get involved in late entries
Only enter with strict stop-loss and target
This is not a recommendation and is for educational purposes only.
always follow risk-reward and quantity management for the 100% of the times
The above mentioned idea may not work, so beware of the risk you are taking


Titan Bullish BiasBullish Bias confirmed by price action
Can be bought at CMP levels
Target 1220
Stop Loss 1100

Titan At resistanceTitan at resistance, rejection over here can push the stock towards 1179, 1159, 1139.
Regards


TITAN is Making Symmetrical Triangle Pattern (Breakout Trade)Titan Company Limited : Indian consumer goods company that mainly manufactures fashion accessories such as watches, jewellery & eyewear. Part of the Tata Group Company ( NSE:TITAN ) is Making Symmetrical Triangle Pattern (PATTERN BREAKOUT TRADE).
This can become a very good trade for INTRADAY traders.
Target + StopLoss: There is no target here. You keep the first target as much as the StopLoss you put. And the StopLoss will be the Low/High of the candle that broke this pattern. Or Low/High swing backward inside the pattern.
And as soon as you get a profit of 0.50% of your target, you will trail your StopLoss and bring it to the entry point. And as soon as your first target is hit, you will release half of your total quantity and continue to trail your StopLoss above the last swing Low/High.
Target and StopLoss are never already fixed in the chart pattern.
Thank you.
You always have to trade only by money management, position sizing, StopLoss trailing. This is the way to stay in profit.
Chart Published By Ravinder Sharma


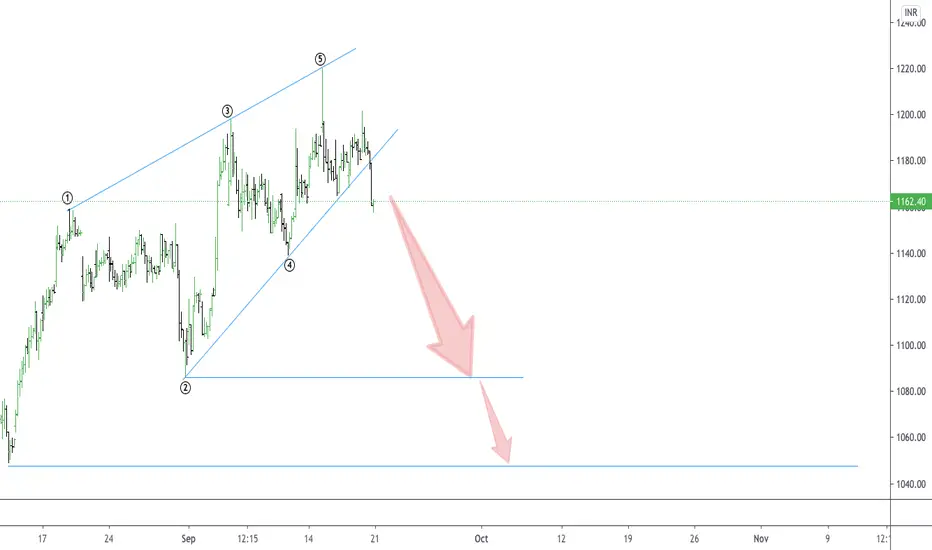
TITAN : CASE OF ENDING DIAGONALThis is the most common diagonal that can be found out at the ending of a main trend or main correction. It consists of all the waves 1-2-3-4-5 in a single or multiple zigzags. They can be found placed at 5th wave of an impulse wave or can been seen as a wave ‘C’ of a corrective waves zigzags or flat. After the termination of the ending diagonal, a swift & a sharp reversal takes place which bring the prices back to the level from where the diagonal began.
Here in the stock of TITAN, this ending diagonal is placed as a wave-C of a corrective move.
As you can see in the chart, this pattern looks like an ending diagonal having wave-1 wave-2 wave-3 wave-4 & wave-5 . Each of these five waves are having an internal structure of three waves. So as per the wave analysis we can say the stock price of TITAN are going to fall . It has been seen that the target level of ending diagonal wave is the origin of the diagonal or the wave 2. So one should see a selling opportunity in this stock & look for the target zone as mentioned in the chart.
Titan Short I hope you can now see how Titan represents an excellent low risk profit entry setup allowing you to trade in the market.Take positions so that the risk/reward is in your favor.
Knowing why, where & when a strong reversal signal is being generated will be the only way to capitalize on your technical analysis .
Disclaimer: It should not be assumed that the methods, techniques, or indicators presented in these chart will be profitable or that they will not result in losses. There is no assurance that the strategies and methods presented will be successful for you. Past results are not necessarily indicative of future results. You should not trade with money that you cannot afford to lose. Examples presented in these products are for educational purposes only and it should not be assumed that these are indicative of ordinary trades. These setups are not solicitations of any order to buy or sell. The publisher assume no responsibility for your trading results. There is a high degree of risk in trading.


Titan at channel resistance - Important levels !Price after breaking the symmetric triangle pattern formed channel pattern and reached the important levels. Previous history of the stocks analysis clearly shows that price is either taking support or resistance in this levels for more number of times as shown by arrow marks.
If price rejects the channel top and reached the channel bottom it would be a best entry, but as if now we cannot expect that. So go with less number of stocks now and if breaks 1230 levels strong then add your position.

TITAN - CHANNEL PATTERN - BULLISHBeware of False Breakouts.
A channel inside a channel is the best setup to trade in intraday, Why?
Because this shows us that even long term traders are also backing us, thus improved chances of winning
This is not a recommendation. This is for educational purpose only.
Thank you
Happy Trading!!

TITAN BUY - BREAKOUT - POSITIONAL BUYING OPPORTUNITY TITAN BUY ABOVE 1065
TARGET 1080, 1092, 1108, 1124, 1136, 1148, 1158
Higher time frame chart is showing bullish strength
Posting for Educational purpose only
If my analysis appears OK then please LIKE, FOLLOW and SHARE to get more future ideas
