Consolidation breakdown in eicher motors1. Consolidation range breakdown at top
below 6720 stock will test its Fibonacci support levels
2. stock has given big rally upwards
3. stock may test its fib support levels and the continue upward movement
4. one can watch for swing downside movement with strict targets and sl
TOP-6

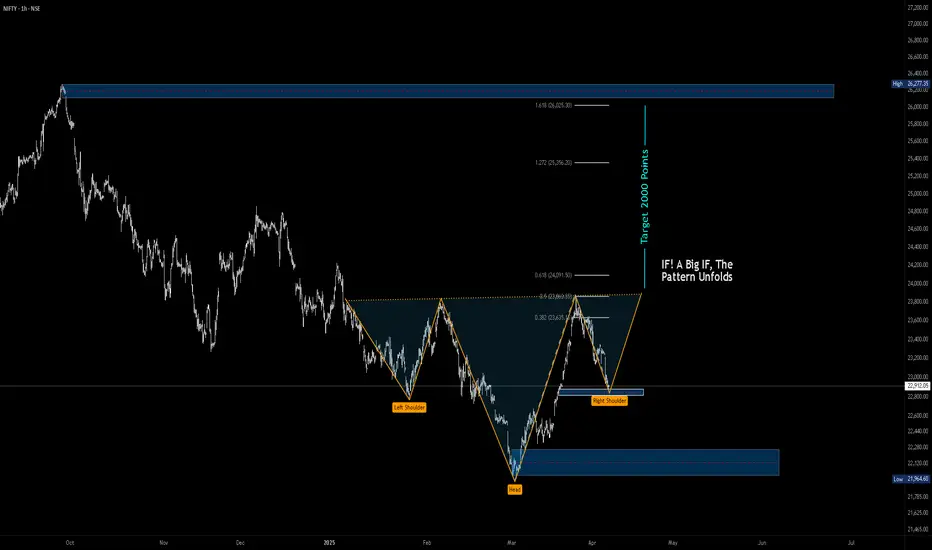
Nifty Prediction for coming days April 4th 2025A Big IF is because we are talking about probability here as the pattern is not yet shaped to its prime.
Lets Understand the Inverted Head and Shoulder Pattern
Left Shoulder : After a downtrend, the price of the respective asset makes a low and then rallies to a higher point, forming the left shoulder.
Head : Following the formation of the left shoulder, the price declines to a point lower than the left shoulder and then rallies again, forming the head.
Right Shoulder : Finally, the price declines again but not as low as the previous decline or the head, and then rallies one more time, forming the right shoulder. The right shoulder is typically roughly equal in depth to the left shoulder.
Neckline : A trendline is drawn connecting the high points (or "peaks") after the formation of each shoulder and the head. This line serves as a level of resistance that the price must break through to confirm the pattern.
Lets not get in to the Psychology part. you can find many around.
---------------------------------------------------------------
To Our analysis of nifty for the coming days we can see the same pattern on the chart above.
1st Trade : Advanced Users
If price takes support at around 22800 - 22750 and If you are good in reading volume find reversal to neck line and beyond if you can.
2nd Trade :
If You see price breaking the neck line with good volume (Volume greater than volume average and or greater than previous 3 or 4 candles in Daily Timeframe, Target Is shown on the Chart Nearly All time High.
-----------------------------------------------------------------
One can see that i have plotted FIb Ext on the chart, That clearly shows that the target of this Inverted H&S is absolutely at around 1.618 of FIb Ext.
One can even Consider this as Elliott Wave 3rd wave (I'm not a master in Elliott wave so correct me if i'm wrong)
Note.
A simple Yet powerful Patter so wait for the pattern to unfold for better results.
------------------------------------------------------------------
Monthly Nifty
In the above Picture You can see Monthly Nifty Chart. Which clearly shows that retracement is done and took support at Moving average. Formed a kicker pattern Which is my fav pattern for reversal. Now a retest of Last month candle Mid we can expect a reversal from there. That's where the market closed today. So rest you need work on your analysis. Good Day and Have a nice weekend
DJIA is entering a very dangerous period !!As per limited study April and May should reward bears.
Inittial signs of DJIA topping out is seen with my Time and Price study.
Rest market is supreme.
SL above 39889 (Weekly closing basis)
Downside 3000+ points positionally.

HEG LTD SELLOFFHEG LTD SELL ON DOJI LOW BREAK,as it has high volume +doji form on top with 1:2 minimum

PIIND- Distribution TOP?!Attached: PIIND Daily Live Market Chart 26th April 2023
SELF EXPLANATORY:
Lower Highs and Lower Lows
Head & Shoulder TOP with Necklines
Targets marked as well
SELL at Current Market Price
Note: Had a Long View of PIIND before but now it is a Flip from Long to Short

CUMMINS- Bearish Head & Shoulders TOP!Attached: Cummins Daily Live Market Chart as of 13th April 2023
Price has put in a Clean Head & Shoulder TOP Pattern and the Breakdown & Retest of this Pattern is also done
Currently Price is Moving Down to meet its 2 Targets
Downside Targets:
T1= Gap Fill Area @ 1475
T2= 1360
As long as Price holds below the 20 Day SMA (1615 presently), this Stock is a SELL......

HAVELLS SHORT on low breakoutHavells can short for atleast 1:2 on low breakout of doji,stock at resistanceas & high volume on doji candle with doji high above as sl

Bajaj Finance SHORT Trade, Head & Shoulders TOP!Attached: Hourly Chart
A Clear Cut Distribution Pattern is visible for Bajaj Finance. This Pattern is called the Head & Shoulders Top Pattern and is a Trend Reversal Pattern.
In this case, there is a BEARISH Implication
One can Short at CMP
Stop Loss above 7380
Downside Target open to 6900- 6800
Stay Safe
And Happy Trading!
If you like my work, then check out my profile and the other trade ideas that I have shared recently.
Any kind of support is appreciated :)

Shriram Transport Finance (Short Setup)BEARS to Attack SRTRANSFIN!
A Head & Shoulder Top Pattern is visible
+
EW count says 1 of (C) done as the 'v waves' marked
2 of (C) done as rise from 23rd August Low is overlapping
Now 3 of (C) down should start
CMP= 1324
TARGETS:
T1= 1260
T2= 1235
STOP LOSS > 1400

finding Tops | Nifty Targets | Crash - Hedge yourself !!This is How I try to learn to catch Tops and bottom, Market is like an "Infinite Sea"- full of earnings & looses.. but beauty of this sea is that it behaves in a systematic manner like a nature which is very well explained in Elliot Wave theory and Neo Wave theory .
A good entry and exit always gives u maximum return and vice versa for that u really need to have patience and principles while jumping into this "financial SEA"
like I have shared charts where market gave u signal of exit and u can play for some extra ordinary moves, now its upto you, how you find your entry and exits as per your appetite, either in ending diagonal from 17150-17992 or bouncing wave of new Downside move post ending diagonal completion.
Market always gives u few chances to safeguard your money in case of reverse moves. for example in just 2 days market fell 660 points from tops but still retraced approx. 300 points on upside i.e 50% retracement, even if u exit u loose hardly 300 points out of 2700 points move.
well If you have seen my previous post where I catch the bottom of 15183 for new up move & if one has invested that time could have earned 2200-2700 points depend on your entry point or 18% in nifty and waited patiently for swift exit by finding such patterns which fulfills top making criteria's.
Trust me the best Part of finding tops is Media + Pattern ( a deadly Combination) , they(media) make the maximum noise during tops and bottoms which gives u good indication of such areas ( pattern ) to plan your next counter moves.
Now Very likely we are going to see a "Covid Style Crash" (in Diametric pattern, which we will have detailed study in my upcoming post) yes this is likely the much much awaited fall since 2 years who have missed taking part in the Crash, I believe major indian traders ( the enthusiastic youngsters) entered post Covid Crash - for fundamentals we have many topics to discuss post this crash like few of them will be Economic Crises, recession, Wars , Bankruptcy etc.. !!
Lastly as I said, market give opportunity major of the times to face few situations repeatedly in your life span which gives u very great Sailing experience in this financial SEA
Thanks & Regards
Self Analyst
Vishal Sancheti

BTC Local top or "definite" ATH prediction 74706With some reverse trend "engineering" and one other tool based on market structure and analysis I think we will local top or ATH at the 74706 level inside a box (cant be too accurate). Time will tell if i'm right or not. ~Magic


Nifty - Where is it headed?Nifty on Friday has seen a narrow range top with spot Nifty making an all time high.
However, volume seems to be drying up.
Does this mean SM have stopped trading and only amateurs have taken positions?
Can this be a false upside break of the wedge forming?
I remember the instance mentioned in Tom William's book Master the Markets looking at this instance.
Well... let's not anticipate and wait for couple of hours before the show begins!
Disclaimer: All investments and trading in the stock market involve risk. Any decisions to place trades in the financial markets, including trading in stock or options or other financial instruments is a personal decision that should only be made after thorough research, including a personal risk and financial assessment and the engagement of professional assistance to the extent you believe necessary. The trading strategies or related information mentioned in this article is for informational / educational purposes only.

INDUSIND BANK - Broadening pattern | Target - 1300 🔰 MY thought process :
⭐A broadening pattern on the Daily chart :) meeting with fibo extension giving a perfect round number of 1300 which seems to be achievable but in a while, kinda positional setup for me :)
🔰Am I taking this trade now: No---Reason: Already in the trades of Naukri and PPL as posted last time :) also took a small position in Coal India today as posted guys :)
Also keeping an eye on JSW steel too seems bullish to me :), All the analysis already posted :)
🔰 {Some info}
➼My name is Apoorv and I am a 2nd year Engineering student, I want to pursue trading as my career, and thus whatsoever setups or trades I potentially see on my charting platform, I post it here and share them with you all.
➼I hope you will love my simple analysis style.
➼Feel free to suggest your view on this as learning is earning here :)
➼I take my trades on my Zerodha account :)
➼These charts are my and only my work, my thought process, just from an educational point of view and no calls.
<<<<<>>>>>

BankNifty Short Term Top is Near.Strength of the upmove is slowly decreasing.
A short term top is near, or already made at 31000.
Downward Correction possible before it resumes its uptrend again.

Nifty ready to Crash for November end!Reasons to go Short on Nifty:
- Rising Channel/ Rising Wedge/ Ending Diagonal Pattern (call it whatever) has formed on Nifty 4Hr Chart
- Triple RSI Bearish Divergence + MACD Divergence
- Today we saw a Steep Sell off (Wide Range Bear Candles)
- Market breadth has shifted in favour of declines to 1:2; it was at 6:1 during the opening today
- On Nifty's Daily Chart, we got an RSI breakdown below 70 too today, Weekly RSI has not yet managed to cross 70
- FIIs had been buying vigorously since November start but today they barely bought 24.2 Cr, once they start selling we would have not only DIIs who have been selling recently but also FIIs putting that selling pressure
- Thanksgiving is on Thursday and US markets are shut on that day, the following Black Friday US markets will operate half day. And then the coming Monday is Guru Nanak Jayanti so Indian markets are shut on Monday. Hence, Long weekend ahead likely to see Long Unwinding
- Sentiment has been Extremely Positively recently and the Markets are short term overheated along with many individual stock names especially in Banking & Financials, this all calls for a Short term Correction
- If you look at individual Stock Charts of Nifty 50 Heavyweights, then you will see Weakness there too for the short term, hence the Heavyweights can drag the Index down steeply
- Remember Markets Top out on Good News and Bottom out on Bad News. With the recent Vaccine news, it seems that now all Good news has been discounted by the Markets so what's left to push it higher?
"The best trades are the ones in which you have all three things going for you: fundamentals, technicals, and market tone" - Michael Marcus, Market Wizard
Our Short Thesis for Nifty checks quite a good number of Criteria. So there you have a recipe for a High Probability Trade !
Downside Risk Open to 12,475 as per the Pattern
View Negates above today's High
Happy Trading :)

IOC short term setupIOC is looking weak, in terms of price and volume correlation. It was consolidating in a range and then gave a break out of the range on 19th August. The volumes, then, were above the 100 DMA, suggesting some sort of strength from the buyers. After that breakout, price did continue to move higher, and volumes did expand as the price moved higher. But in the last 2-3 sessions, there have been various strong signs of sellers entering IOC, in form of bearish candles on back of volume expansion. This volume expansion has been more than the volume expansion during the bullish phase, suggesting supply is greater than demand. I will personally wait for more confirmation, such as bearish engulfing candle on back of volumes, to initiate any type of short trade. Another confirmation is the break of the upward trendline, marked with the callout box. Another decisive level is 90.5. There have been signs of supply near this level, as price has reversed from the level many times. If this level is broken with strength, then this would be a sign of supply being absorbed by buyers that are stronger than the sellers. If this were to happen before the trendline is broken, then the short trade setup should be cancelled, and the trend will continue to be bullish. Upside target would be 94.85 and downside target is 84.85. Risk should be managed according to your personal risk appetite.
I am not a SEBI registered investment advisor and hence do not follow my analysis blindly.
Be aware of what you are trading and the risk associated with it.
Stock market is risky and you can lose a lot of your capital.
Be wise and trade carefull!
Hope I can help you become a profitable trader!
Grateful!🙏

Tatasteel- Can It Become Mr. India? Expect Fall Below 355 to 300Extremely Powerful Pattern- Wedge about to complete. "Strictly" this view is valid only below 355 level- Downside Target- 337/328/312/300. Thanks

Trade setup for BankniftyI have uploaded a video with watchlist of stocks which could be traded for short term
My channel is called Intelligentrader on Utube, in which I have uploaded my watchlist for the short term
and tomorrow's Banknifty Analysis
I would try to regularly upload post-market analysis and some stock selection as well, so please subscribe to the channel
Grateful🙏

Long term analysis of NiftyInformation is given on the chart
I have a utube channel whose name is Intelligentrader
On my utube channel I will be posting videos of volume analysis and also basics of trading.
This is an educational post
Trade carefully
Grateful🙏

Nestle suspend production temporarily over coronavirus NEW DELHI: The country’s two biggest foods and beverage makers Nestle and Coca-Cola said on Tuesday that they are suspending production on a temporary basis at their plants, with the exception of limited essential products, following the country-wide lockdown amidst the Covid-19 scare.
Nestle, maker of Maggi noodles, Nescafe coffee, Cereal infant cereal, and KitKat chocolate, said in a BSE filing that in view of the countrywide lockdown, operations in some of its locations, inclusive of manufacturing, distribution centers, warehouses, offices and suppliers, have been scaled down or suspended. “The company is closely monitoring the situation and will take all necessary measures as directed by the government and authorities. The impact on the operations of the company cannot be a ..assessed at this point,” Nestle said in the BSE filing. The India unit of the Swiss foods maker did not specify which for products it was suspending manufacturing.

Top 13 Stock rallys during Lockdown***Top 13 Stocks rallys during Lockdown***
DIVIS--->
COLPAL--->
CIPLA--->
HINDUNILVR--->
LUPIN--->
TORRENT PHARMA--->
NESTLE--->
SUNPHARMA--->
ABBOT--->
BIOCON--->
P&G--->
DR REDDY--->
ALKEM--->
CNXPHARMA

Broadening Top Formation - Textbook ExampleL&T Finance | Short Below 128 | Stop-loss 134 | Target 105 |
Risk/Reward 1:4
It's a broadening top formation. And pretty much like what the textbook describes. Be careful because nice-looking patterns are rarely successful.
If price closes above the upper trendline before breaking 128 then the trading setup becomes invalid.
