TORNTPOWER | Symmetrical Triangle — Range Compression at Supply💹 Torrent Power Limited (NSE: TORNTPOWER)
Sector: Power | CMP: 1399.40
View: Symmetrical Triangle — Range Compression at Major Supply
Chart Pattern: Symmetrical Triangle
Candlestick Pattern: Strong Bullish Marubozu
Torrent Power Limited (NSE: TORNTPOWER) is showing early signs of a structural shift after spending several months in a descending price framework marked by lower highs and a gradually rising base. The stock respected a falling resistance trendline while forming higher lows, creating a classic compression phase where supply was getting absorbed quietly. The latest session produced a strong expansion candle from the trendline with visible volume participation, suggesting demand is attempting to take control after a prolonged consolidation. Immediate supports are placed near 1346, followed by 1293 and 1263, while overhead resistances stand at 1429, 1459, and 1512, with a major historical supply zone around 1680–1720. From an STWP perspective, momentum is transitioning from distribution to early accumulation; as long as price holds above the 1345–1360 zone, pullbacks are likely to find buyers, while sustained acceptance above 1460 could open the path toward higher resistance levels. Overall, the trend remains neutral but improving, momentum is in early expansion mode, volume is supportive, and risk stays moderate near overhead supply — making this a stock to observe for follow-through rather than chase.
Torrent Power Limited (NSE: TORNTPOWER) has delivered a high-impact bullish session, marked by a clear Bullish Marubozu candle accompanied by exceptionally strong volume, signalling decisive buyer dominance and visible institutional participation. The move is technically significant as it aligns with a 20-EMA crossover, RSI breakout into the strong trend zone (above 70), and a Bollinger Band expansion after prolonged compression, indicating a volatility-led expansion phase. Momentum indicators support the strength — MACD has turned firmly positive with a rising histogram, ROC shows strong positive acceleration, and relative strength versus NIFTY confirms outperformance and emerging leadership behaviour. However, oscillators such as Stochastic and CCI are in extreme overbought territory, suggesting short-term exhaustion risk even as broader momentum remains intact. Volume data further strengthens the case, with a 20-day volume breakout nearly 5x the average, highlighting aggressive accumulation rather than speculative participation. From an STWP perspective, the setup reflects strong momentum within a still-neutral higher-timeframe trend, implying that while immediate upside energy is powerful, price may require consolidation or follow-through confirmation before sustaining higher levels. Overall, momentum is strong, volume is very high, trend transition is underway, and risk remains elevated in the near term — making this a classic institutional expansion move worth tracking, not chasing.
STWP Trade Analysis – Torrent Power Limited:
The current price interaction zone is observed around 1399–1407, which marks the immediate structure-acceptance area following a strong expansion candle backed by exceptional volume. Within the STWP HNI framework, the primary observation band lies between 1399.40 and 1407.00, with a key structural risk reference near 1383.50, below which momentum acceptance would weaken. A deeper structure-based invalidation level is mapped around 1360–1365, representing the lower end of the recent accumulation base and serving as a broader risk boundary. An alternate low-risk observation pocket exists closer to 1290–1270, aligned with the prior consolidation floor and trend-support reference, while higher observation zones are identified near 1447 and 1479, where price behaviour should be evaluated for continuation, absorption, or supply emergence. All mentioned levels are strictly price-behaviour checkpoints used to assess strength, acceptance, or rejection within the evolving structure and are shared purely for educational and analytical purposes, not as entries, exits, or profit objectives.
From a derivatives perspective, positioning in Torrent Power Limited remains bullish but institutionally disciplined, with activity tightly concentrated around the near-ATM 1400 zone, which is acting as the primary liquidity and control pivot. This clustering indicates efficient directional expression rather than momentum chasing. The structure is characterised by a clear long build-up in near-ATM calls, supported by elements of ITM call short covering at lower strikes, explaining the sharp price expansion while also implying that sustained continuation will rely on fresh long additions once covering activity stabilises. Encouragingly, selective long build-up is now visible at higher strikes, adding depth and credibility to the bullish derivative structure rather than leaving it top-heavy. Volatility remains constructive, with implied volatility sitting in a healthy mid band and expanding gradually alongside price, which supports directional option frameworks while keeping time-decay risk relevant and manageable. On the put side, short build-up at lower strikes is reinforcing a defined support base beneath spot, while long unwinding in deeper puts suggests easing downside hedging demand rather than rising risk aversion — a combination that aligns with controlled bullish continuation rather than speculative excess.
STWP Demand–Supply Zone Map – Torrent Power Limited (TORNTPOWER):
On the intraday timeframe, multiple layered demand pockets are visible, indicating stepwise buyer absorption rather than a single reaction low. The immediate intraday demand zone lies between 1348–1337.80, followed by deeper support clusters at 1324.70–1320.80, 1307–1305.90, and 1279.50–1275.80, each representing prior acceptance areas where price previously attracted responsive demand. From a swing perspective, demand is broader and more structural, with key zones mapped at 1330–1319.80, 1312.10–1297.90, and 1310.60–1303.70, highlighting the larger accumulation band that underpins the current uptrend. On the higher timeframe, no fresh daily demand zones are currently active, while a clearly defined daily supply zone between 1525 and 1586.20 stands out as a major overhead distribution area where price behaviour should be carefully evaluated for acceptance or rejection. Collectively, these zones act purely as price-behaviour reference areas to assess strength, pullback quality, and supply response within the prevailing structure, and are shared strictly for educational and analytical purposes only.
Final Outlook:
Momentum: Strong | Trend: Up | Risk: High | Volume: High
⚠️ STWP Educational & Legal Disclaimer
This content is shared strictly for educational and informational purposes only. All discussions, illustrations, charts, price zones, and options structures are meant to explain market behaviour and do not constitute any buy, sell, or hold recommendation. STWP does not provide investment advice, trading calls, tips, or personalized financial guidance, and is not a SEBI-registered intermediary or research analyst.
The analysis is based on publicly available market data and observed price–derivatives behaviour, which is dynamic in nature and may change without notice. Financial markets involve inherent risk, and derivatives carry elevated risk, including the potential for significant capital loss. Factors such as option premiums, implied volatility, open interest, delta, and other Greeks can shift rapidly and unpredictably.
All trading and investment decisions, including position sizing and risk management, are solely the responsibility of the reader. Always consult a SEBI-registered investment advisor before taking any financial action. STWP, its associates, or affiliates shall not be liable for any direct or indirect loss arising from the use of this material. Past patterns, structures, or historical behaviour must never be treated as guarantees of future outcomes.
Position Status: No active position in this instrument at the time of analysis
Data Source: TradingView & NSE India
💬 Did this add value?
🔼 Boost to support structured learning
✍️ Share your views or questions in the comments
🔁 Forward to traders who value disciplined analysis
👉 Follow for clean, probability-driven STWP insights
🚀 Stay Calm. Stay Clean. Trade With Patience.
Trade Smart | Learn Zones | Be Self-Reliant 📊
TORNTPOWER

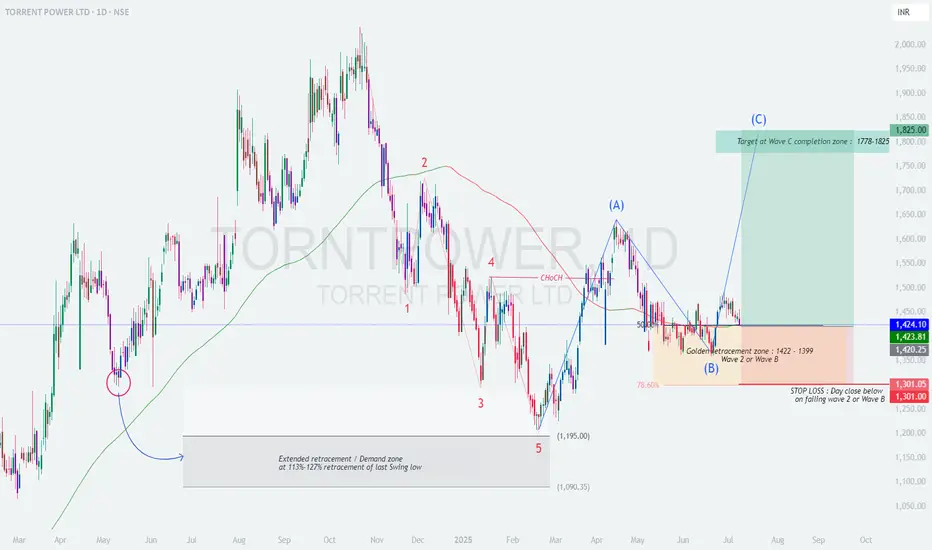
TORNTPOWER – Wave C Rally Loading from Golden Fib Zone?
After a 5-wave fall and clean ABC correction, price is poised for a potential Wave C breakout.
Golden retracement zone held strong – is this the beginning of a bullish continuation toward ₹1825?
🧩 Elliott Wave Structure:
Full 5-wave impulse decline completed → Wave 5 bottom at ₹1195
Sharp Wave A rally confirms initial trend reversal
Wave B retraced to Golden Zone (50–78.6%) → ₹1399–1422
Structure now favoring development of Wave C
📌 Key Confluences:
Golden Zone Support: Price holding firm at ₹1399–1422
CHoCH (Change of Character): Clear structure shift after Wave 5 bottom, confirming trend reversal
Price action above CHoCH level = bullish intent
Support + Fib + CHoCH = high-conviction reversal case
🎯 Targets:
Wave C Completion Zone: ₹1778–1825
Upside potential: ~28.5% from current levels
🛑 Stop-Loss & Risk Control:
Stop-loss: Day close below ₹1301
Risk:Reward: 3.4+
📈 Summary:
5-wave decline + ABC setup = classic reversal blueprint
CHoCH confirms structure flip from bearish to bullish
Low-risk swing opportunity from high-probability zone
Wave C often delivers strong directional moves – and with CHoCH in place, the foundation looks ready!
#TORNTPOWER #WaveC #CHoCH #ElliottWave #SwingTrade #GoldenZone #TrendReversal
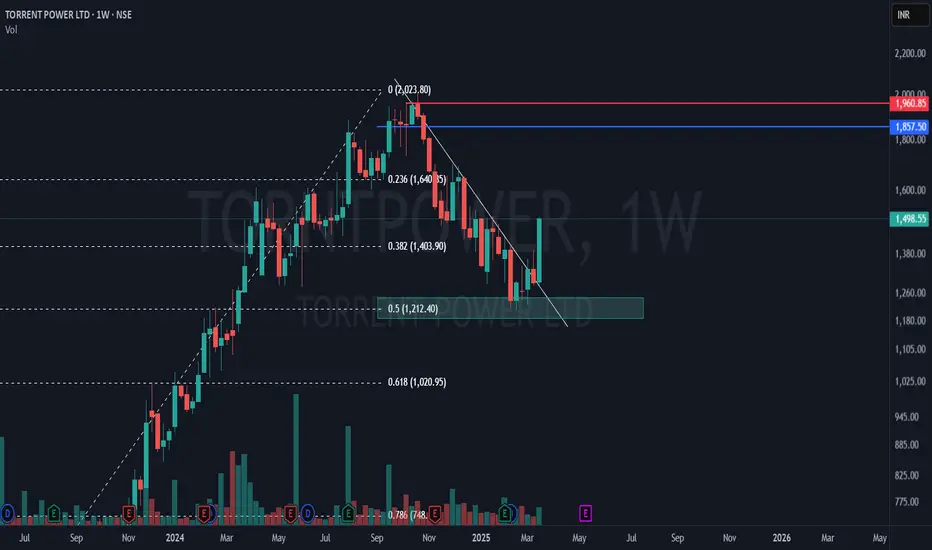
Torrent Power – 50% Fibonacci Retest & Breakout Play!📊 Technical Breakdown:
🔹 50% Fibonacci Retracement at ₹1,212 – a crucial support where buyers stepped in!
🔹 Falling trendline breakout with a massive +16.06% green candle – trend reversal confirmation?
🔹 Volume surge suggests strong buying interest but relatively still lower than as it used to be in this stock year ago
🔹 Blue and Red lines are nearest supply zone created by a weekly and monthly time frame
#TORNTPOWER 1668 TGT 15% 1940+ NSE:TORNTPOWER
Target 1940 15% upside
NSE:TORNTPOWER CPM 1668
TGT 1940+ (15%)
SL 1550
TF < 6M
If you like my work KINDLY LIKE SHARE & FOLLOW this page for free Stock Recommendations. With 💚 from Rachit Sethia

Torrent Power : How powerful is this stock?Info about the Stock
1. Torrent Power Q3 profit surges 86% YoY to Rs 685 crore, revenue grows 71%. Announces dividend at Rs 22 per share.
2. FNO stock.
If you are safe investor buy this stock at the Support : 496 .
Technical Analysis
A breakout occurred after a series of declines.The breakout is so much more powerful that the price opens as a gap-up.
The Price is trending above its 20-day moving average.
The good thing is that the price is still above the 200-day moving average.
The breakout candle has proper volume , so it can't be called a fake breakout

Torrent power on radar for swing entry Power sector looking good, especially torrent power n power grid, will post power grid separately. In torrent power seems in last leg of selling, thus a good time to add, also a observation point daily rsi at around 23, last two times when rsi made this low , torrent power gave a good upside rally, which you can find on chart with vertical line (blue dotted) on 24feb, 13/19 may, and now on 26sep, weekly chart indicates a retest of breakout level around 470 level, it may or may not touch and start upside journey for initial target of 550, 580.

TORNTPOWERNSE:TORNTPOWER
One Can Go long with a Strict SL below the Trendline or Swing Low of Daily Candle.
Close should be good, and Clean.
R:R ratio should be 1 :2 .
Disclaimer : You are responsible for your Profits and loss, Shared for Educational purpose

Long Torrent Power at CMP of 465 sl 449After a pullback stock has again give a breakout
one can buy at cmp of 465 n on dips till 455 with a sl of 449 for a tgt of 475-485


Target 2 (49%) achieved in Torrent Power. Target 3 is ON...This is follow-up on Torrent Powers. Can check link to related ideas.
Target 2 achieved. More than 49%. Target 3 is ON.
Chart is self explanatory. Entry, Targets and Trailing Stop Loss are mentioned on the chart.
Disclaimer: This is for demonstration and educational purpose only. This is not buying or selling recommendations. I am not SEBI registered. Please consult your financial advisor before taking any trade.

Target 3 (64%) achieved in Torrent Power. Target 4 is ON...This is follow-up on Torrent Powers. Can check link to related ideas.
Target 3 achieved. More than 64%. Target 4 is ON.
Chart is self explanatory. Entry, Targets and Trailing Stop Loss are mentioned on the chart.
Disclaimer: This is for demonstration and educational purpose only. This is not buying or selling recommendations. I am not SEBI registered. Please consult your financial advisor before taking any trade.


TORNTPOWER #Watchlist
#TORNTPOWER (D): 482.6 CMP, Looks promising for more benefits :)
#Disclaimer:- View shared is for educational purposes only. Conduct your due diligence before making any trading/investment decisions.
#Stocktowatch


TorntpowerAll charts/views posted here are for educational purpose only. We are not responsible for any of your profit/loss.

trendline breakout within the channel on TORNTPOWERtrendline breakout within the channel on TORNTPOWER

Tornt Power Range BreakoutRange Breakout
Buy Torrent Power
Closing Price - 450.6
Strict SL - 422 (DCB)
Target - 495+++

TORRENT POWER - Short/Mid Term View On Monthly candle Stock had broken major resistance zone and made new high in March.
Last month stock has taken support at the same zone (now acting as support) and risen again.
Looks good for targets of 475-500 if breaks ATH in next few days

TORNTPOWER : Perfect EntryTORNTPOWER
> Hourly Chart
> Very good Volume
> BO done
> Retest Done
> CMP 450.60. Good to enter till 444.
> Suport 423 on closing basis
> May go 478, 513
Dtd : 23rd May TheCharts
Like, Share, Comment for regular updates.
Disclaimer
I am not sebi registered analyst
My studies are Educational purpose only
Please consult with your Financial advisor before trading or investing

TORNTPOWER - BREAKOUT AND RETESTA STRONG STOCK TO HOLD
Note:
Avoid the stock if a big gap up or gap down is seen
Enter after the breakout happens and not before it
Do not chase the market, i.e., do not get involved in late entries
Only enter with strict stop-loss and target
This is not a recommendation and is for educational purposes only.
always follow risk-reward and quantity management for the 100% of the times
The above mentioned idea may not work, so beware of the risk you are taking
Follow me to Learn and Earn with me.
Happy Trading!!

TORRENT POWER - Can make new ATH soonStock had broken the Monthly break out zone (365-375 levels) and made new ATH in March (Monthly BO chart I have mentioned in comments section - helpful if want to have a short-mid term opinion on the stock)
After that it has re-tested the BO zone and rising again.
If stock breaks Trendline in coming days then it will test ATH again and can make a new high(435-440 levels) There are 2 possible scenarios for the same as I have mentioned in the chart
P.S. To get an idea about possibility of scenario 1 and 2 watch for volume build up in coming days.
