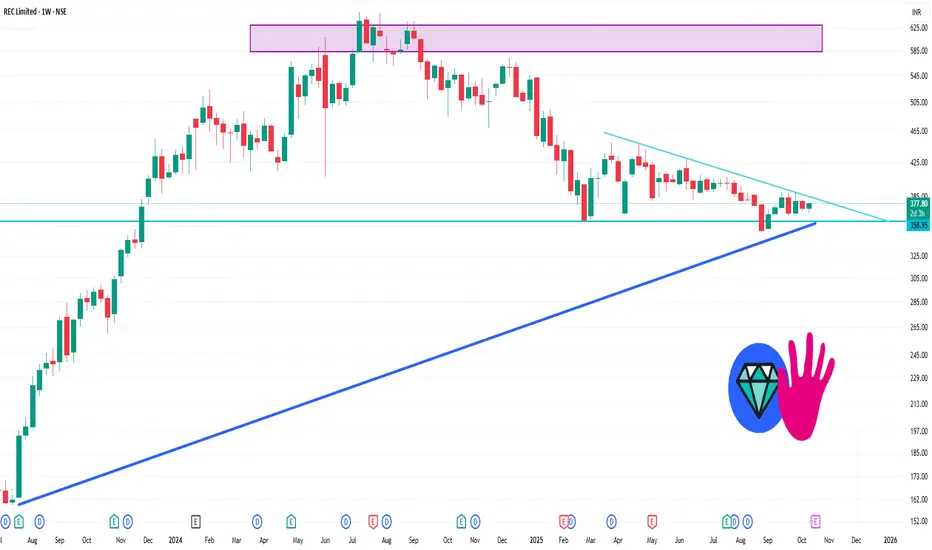
RECLTD 1 Week Time Frame 📊 Weekly Support & Resistance Levels
Immediate Support: ₹367.92
Key Support: ₹362.88
Immediate Resistance: ₹379.97
Key Resistance: ₹386.98
Weekly Trading Range: ₹355.87 – ₹392.02
🔍 Technical Indicators
RSI (14-day): 50.58 — Indicates a neutral momentum
MACD: -1.16 — Suggests a bearish trend
ADX: 15.79 — Indicates a weak trend
Stochastic RSI: 27.40 — Indicates an oversold condition
Moving Averages: Both short-term and long-term moving averages are neutral, with no clear buy or sell signals.
📈 Trend Analysis
Short-Term Trend: Neutral
Mid-Term Trend: Bearish
Long-Term Trend: Bearish
Resistance Levels: ₹386.7 (short-term), ₹391.55 (mid-term), ₹446.25 (long-term)
Support Levels: ₹364.3 (short-term), ₹350 (mid-term), ₹350 (long-term)
Traade
Option Trading What Is an Option?
An option is a contract between two parties: the buyer and the seller (writer).
It gives the buyer the right—but not the obligation—to buy or sell an underlying asset at a predetermined price (called the strike price) before or on a specific date (called the expiry date).
There are two main types of options:
Call Option – gives the buyer the right to buy the asset.
Put Option – gives the buyer the right to sell the asset.

History and Evolution of Crypto Markets1. Precursors to Cryptocurrency
1.1 Early Concepts of Digital Money
The idea of digital money predates blockchain technology. Early attempts to create decentralized digital currencies emerged in the 1980s and 1990s. Notable examples include:
DigiCash (1989): Developed by David Chaum, DigiCash was an electronic cash system emphasizing privacy through cryptographic techniques. Despite its innovation, DigiCash failed commercially due to regulatory challenges and lack of adoption.
e-gold (1996): E-gold allowed users to transact in a gold-backed digital currency. It gained significant traction but ultimately faced legal issues related to money laundering, illustrating the challenges of regulating digital currencies.
1.2 Cryptography and the Idea of Decentralization
The foundational technology behind cryptocurrencies—cryptography—had been developing since the 1970s. Public key cryptography, hash functions, and digital signatures made secure, verifiable digital transactions possible. Visionaries like Wei Dai and Nick Szabo proposed concepts such as b-money and bit gold, which laid the groundwork for a decentralized digital currency system.
2. The Birth of Bitcoin
2.1 Satoshi Nakamoto and the White Paper (2008)
The official history of cryptocurrencies begins with Bitcoin. In 2008, an individual or group using the pseudonym Satoshi Nakamoto published the Bitcoin white paper, titled “Bitcoin: A Peer-to-Peer Electronic Cash System.”
Key innovations included:
Decentralization: Bitcoin operates without a central authority.
Blockchain: A distributed ledger ensures transparency and immutability.
Proof-of-Work: A consensus algorithm secures the network against double-spending.
Limited Supply: Bitcoin’s capped supply of 21 million coins created scarcity.
2.2 Launch and Early Adoption (2009–2011)
Bitcoin’s genesis block was mined in January 2009, marking the birth of the cryptocurrency ecosystem. Early adopters were primarily technologists, libertarians, and cryptography enthusiasts. Bitcoin’s first real-world transaction occurred in May 2010 when Laszlo Hanyecz bought two pizzas for 10,000 BTC, now famously remembered as the first commercial Bitcoin transaction.
By 2011, Bitcoin’s market gained visibility, reaching parity with the US dollar and spawning the first alternative cryptocurrencies, or altcoins, such as Litecoin, which introduced faster transaction times.
3. Expansion of the Crypto Ecosystem
3.1 Altcoins and Innovation (2011–2013)
Following Bitcoin’s success, thousands of alternative cryptocurrencies emerged, each seeking to improve upon Bitcoin’s limitations:
Litecoin (2011): Faster block generation, lower transaction fees.
Ripple (2012): Focused on cross-border payments and institutional adoption.
Namecoin (2011): Introduced decentralized DNS systems.
These early experiments diversified the ecosystem and demonstrated that blockchain could be used for purposes beyond simple peer-to-peer currency.
3.2 Early Exchanges and Market Development
Cryptocurrency exchanges began to appear, enabling users to trade digital assets:
Mt. Gox (2010): Initially a platform for trading Magic: The Gathering cards, it became the largest Bitcoin exchange by 2013, handling over 70% of global BTC transactions.
BTC-e and Bitstamp: Provided additional liquidity and infrastructure for crypto markets.
Exchanges played a critical role in establishing market prices, liquidity, and accessibility for retail investors.
4. The ICO Boom and Ethereum (2013–2017)
4.1 Ethereum and Smart Contracts
In 2013, Vitalik Buterin proposed Ethereum, a blockchain platform with the ability to execute smart contracts—self-executing code that runs on a decentralized network. Launched in 2015, Ethereum allowed developers to create decentralized applications (dApps), paving the way for:
Decentralized finance (DeFi)
Tokenized assets
Complex governance models
4.2 Initial Coin Offerings (ICOs)
Ethereum also enabled the rise of ICOs, where projects issued tokens to raise capital. Between 2016 and 2017, ICOs raised billions of dollars globally, creating a speculative boom. While many ICOs were successful, the market also experienced scams and failures, highlighting the risks of unregulated fundraising.
4.3 Market Maturation and Price Surges
By late 2017, Bitcoin’s price soared to nearly $20,000, and Ethereum exceeded $1,400. The market attracted mainstream media attention, institutional interest, and a wave of retail investors, marking the first major crypto market boom.
5. Market Correction and Regulatory Scrutiny (2018–2019)
5.1 The 2018 Crypto Winter
After the 2017 boom, the crypto market experienced a severe correction:
Bitcoin fell from ~$20,000 to below $4,000.
Many altcoins lost 80–90% of their value.
Market capitalization dropped from over $800 billion to under $200 billion.
5.2 Regulatory Developments
Governments began to recognize the need for regulation:
SEC (USA): Issued warnings about ICOs and classified some tokens as securities.
China: Banned ICOs and domestic cryptocurrency exchanges.
Japan and Switzerland: Introduced licensing frameworks for exchanges.
These measures aimed to protect investors while shaping the market’s infrastructure.
6. The Rise of DeFi, NFTs, and Layer 2 Solutions (2020–2022)
6.1 Decentralized Finance (DeFi)
DeFi platforms emerged, allowing financial services without intermediaries:
Lending and borrowing (Compound, Aave)
Decentralized exchanges (Uniswap, SushiSwap)
Yield farming and liquidity mining
DeFi introduced a new paradigm, where users could earn returns on their assets without traditional banks, but with increased smart contract and systemic risk.
6.2 Non-Fungible Tokens (NFTs)
NFTs became a cultural and financial phenomenon in 2021:
Enabled digital art ownership, collectibles, and gaming assets.
Opened new revenue streams for creators and introduced blockchain to mainstream audiences.
6.3 Layer 2 Solutions and Scaling
Blockchain networks faced congestion as DeFi and NFTs increased activity. Layer 2 scaling solutions (e.g., Polygon, Optimism) and alternative blockchains (e.g., Solana, Avalanche) emerged to reduce fees and increase transaction throughput.
7. Institutional Adoption and Mainstream Integration (2021–2023)
7.1 Institutional Interest
Large institutions began participating in crypto markets:
Companies like MicroStrategy, Tesla, and Square purchased Bitcoin as a reserve asset.
Investment banks and hedge funds launched crypto trading desks.
CME and Bakkt introduced futures and options on crypto.
7.2 Stablecoins and Payment Systems
Stablecoins, such as USDT, USDC, and BUSD, became essential for trading and payments:
Pegged to fiat currencies to reduce volatility.
Facilitated cross-border transactions and DeFi participation.
7.3 Regulatory Progress and Challenges
Governments increasingly engaged in policy formation:
US, EU, and Asia developed frameworks for taxation, anti-money laundering (AML), and investor protection.
Central Bank Digital Currencies (CBDCs) explored the integration of blockchain in sovereign monetary systems.
8. Crypto Market Volatility and Emerging Trends (2023–2025)
8.1 Market Cycles
The crypto market continued to exhibit volatility, driven by macroeconomic factors, technological upgrades, and speculative behavior. Bitcoin’s role as “digital gold” and Ethereum’s shift to proof-of-stake (Ethereum 2.0) shaped investor strategies.
8.2 Emerging Technologies
Web3 Applications: Decentralized social media, gaming, and marketplaces.
Layer 1 Innovations: Ethereum alternatives and sharding for scalability.
Interoperability Protocols: Cosmos, Polkadot, and cross-chain solutions enabling multi-chain ecosystems.
8.3 Societal and Cultural Impact
Cryptocurrencies influenced:
Financial inclusion, especially in developing countries.
New forms of digital identity and governance.
Debates on privacy, censorship, and the future of decentralized networks.
9. Key Lessons from the Evolution of Crypto Markets
Technological Innovation Drives Growth: Blockchain, smart contracts, and cryptography are central to adoption.
Speculation vs. Utility: Early markets were speculative; long-term adoption requires real-world use cases.
Regulation Shapes Markets: Legal clarity encourages institutional participation, while uncertainty can depress growth.
Market Volatility Is Normative: Cycles of boom and bust are inherent, reflecting immature markets and behavioral factors.
Decentralization Challenges Traditional Finance: Peer-to-peer finance, decentralized governance, and tokenized assets redefine financial norms.
10. Future Outlook
10.1 Institutional and Retail Integration
The trend of institutional adoption is expected to continue, alongside growing retail participation through user-friendly platforms and fintech integration.
10.2 Technological Evolution
Layer 2 and interoperability solutions will enhance scalability.
Blockchain-based AI, IoT, and supply chain solutions may drive new use cases.
10.3 Regulation and Mainstream Acceptance
Clearer regulatory frameworks may reduce risk and encourage long-term investment.
CBDCs may coexist with decentralized cryptocurrencies, creating a hybrid financial ecosystem.
10.4 Global Economic Implications
Cryptocurrencies could reshape monetary policy, capital flows, and global finance.
Digital assets may provide new tools for financial inclusion and cross-border trade.
Conclusion
The history and evolution of crypto markets illustrate a journey from obscure digital experiments to a sophisticated, multifaceted global financial ecosystem. Innovations in blockchain, cryptography, and decentralized finance, coupled with cultural adoption and regulatory adaptation, have transformed cryptocurrency from a niche concept into a mainstream asset class. While volatility and uncertainty remain, the trajectory suggests continued integration with traditional finance, technological innovation, and societal influence.
The crypto market’s evolution is ongoing, reflecting broader trends in technology, finance, and global governance. Understanding its history provides critical insights into its future potential and the challenges it may face in shaping the next generation of financial systems.
Trade Management: From Entry to Exit1. Understanding Trade Management
Trade management is the systematic process of monitoring, adjusting, and executing trades once a position is initiated. It’s about controlling risk, optimizing profits, and maintaining emotional discipline throughout the lifecycle of a trade. While strategy often focuses on identifying opportunities, trade management emphasizes what happens after you act on a signal.
Key Objectives of Trade Management:
Protect capital from adverse market movements.
Capture maximum potential profits from favorable moves.
Reduce emotional bias and impulsive decision-making.
Maintain consistency across multiple trades.
Trade management is not about predicting the market perfectly but responding effectively to changing conditions. Even the best entry signal can fail without proper management.
2. Pre-Trade Considerations
Effective trade management starts before entering a trade. Planning your trade, even for a few seconds, sets the stage for disciplined execution.
a. Risk Assessment
Risk assessment is the foundation of trade management. A trader must calculate:
Position size: How much capital to allocate.
Maximum acceptable loss: Typically a small percentage of your trading account (1–3% per trade).
Volatility: Understanding how much the market might move against you.
For instance, if a stock trades at ₹500 and you’re willing to risk ₹10 per share with ₹50,000 capital, your position size would be calculated based on the acceptable loss.
b. Setting Trade Objectives
Clear objectives define what success looks like:
Profit target: A realistic price level for taking profits.
Stop-loss: The price at which to exit if the trade goes against you.
Time horizon: Day trade, swing trade, or position trade.
c. Choosing the Entry Point
Entry strategies include:
Breakouts above resistance or below support.
Pullbacks to support or resistance.
Indicator-based signals (moving averages, RSI, MACD).
A well-timed entry improves the risk-reward ratio, a critical factor in trade management.
3. The Entry Stage
a. Confirming the Setup
Before entering:
Ensure the trade aligns with your strategy.
Confirm market conditions (trend direction, volatility, liquidity).
Avoid emotional triggers; rely on logic and strategy.
b. Order Placement
The method of entry can impact trade management:
Market orders: Immediate execution but subject to slippage.
Limit orders: Execute at your desired price, avoiding overpaying or underselling.
Stop orders: Triggered only when certain levels are reached.
c. Position Sizing
Trade management begins at entry. Proper sizing ensures you can withstand market fluctuations without violating risk limits. Calculations should include:
Account size
Maximum risk per trade
Stop-loss distance
4. Initial Trade Management: First Phase
Once a trade is live, the first few minutes or hours are crucial.
a. Monitoring Price Action
Observe how the trade behaves relative to your entry:
Is the price moving in your favor?
Are there signs of reversal or consolidation?
Does the trade align with broader market trends?
b. Adjusting Stop-Loss
Depending on market behavior:
Trailing stop-loss: Moves with favorable price action to lock in profits.
Break-even stop: Adjusts the stop-loss to the entry point once the trade moves in your favor.
These adjustments reduce risk without limiting profit potential.
c. Avoid Over-Management
Too many interventions early in the trade can reduce profitability. Focus on planned adjustments rather than reactive ones.
5. Active Trade Management: Mid-Trade Phase
As the trade progresses, management focuses on protecting gains and assessing market conditions.
a. Monitoring Market Signals
Trend continuation: Indicators like moving averages or ADX can suggest the trend is intact.
Signs of reversal: Divergences or support/resistance tests may indicate slowing momentum.
b. Scaling In or Out
Advanced trade management involves adjusting position size:
Scaling out: Selling a portion of the position to lock in profits while leaving the rest to run.
Scaling in: Adding to a position if the trade continues to move in your favor (requires strict risk control).
c. Emotional Discipline
Avoid greed or fear-driven decisions. Many traders exit too early or hold too long due to emotions, undermining well-planned management strategies.
6. Exit Strategies
Exiting a trade is as important as entering it. Exits can be categorized into profit-taking and loss-limiting.
a. Stop-Loss Management
Fixed stop-loss: Set at trade entry; does not move.
Dynamic stop-loss: Adjusted based on price action or technical levels.
Volatility-based stop: Placed considering market volatility (e.g., ATR-based stop).
b. Profit Targets
Profit targets depend on the strategy:
Risk-reward ratio: Commonly 1:2 or higher.
Key levels: Previous highs/lows, trendlines, Fibonacci retracements.
Trailing profits: Using a moving stop to let profits run as long as the trend continues.
c. Partial Exits
Exiting partially can:
Reduce risk exposure.
Secure profits.
Allow a portion of the trade to benefit from extended moves.
d. Time-Based Exit
Some trades are exited purely based on time:
Day trades end before market close.
Swing trades may close after a few days or weeks based on pre-determined plans.
7. Trade Review and Analysis
After exiting, a trade review is crucial. Successful traders continuously learn from each trade.
a. Recording Trade Data
Entry and exit points
Position size
Stop-loss and target levels
Outcome (profit/loss)
Market conditions
b. Performance Metrics
Evaluate:
Win rate
Average risk-reward ratio
Maximum drawdown
Emotional adherence to strategy
c. Lessons Learned
Identify what worked and what didn’t:
Did you follow the plan?
Were stop-losses or targets set appropriately?
Could trade management have improved outcomes?
This reflection improves future trade management decisions.
8. Psychological Aspects of Trade Management
Effective trade management isn’t only technical; psychology plays a major role.
a. Emotional Control
Fear, greed, and impatience can cause premature exits or overexposure. Discipline ensures consistent management.
b. Patience and Observation
Trades require time to develop. Rushing exits reduces profitability, while overconfidence can lead to excessive risk.
c. Confidence in Strategy
Believing in your setup and management plan prevents impulsive decisions during volatile periods.
9. Tools and Techniques for Trade Management
Modern trading offers tools to aid trade management:
Stop-loss orders: Automatic exit when a price level is breached.
Trailing stops: Adjust automatically to follow market trends.
Alerts and notifications: Track critical price movements.
Charting software: Helps visualize trends, supports, and resistance levels.
Risk calculators: Ensure proper position sizing and exposure.
Using these tools reduces human error and improves consistency.
10. Common Mistakes in Trade Management
Even experienced traders can fall into traps:
Ignoring stop-losses: Leads to large, unnecessary losses.
Over-trading: Entering too many positions without proper management.
Excessive micromanagement: Constantly adjusting stops or positions.
Emotional trading: Letting fear or greed dictate decisions.
Failing to review trades: Missing opportunities to improve future performance.
Avoiding these mistakes is as important as any technical skill.
11. Advanced Trade Management Strategies
Once basic management is mastered, traders can explore advanced techniques:
a. Hedging
Use options or correlated instruments to protect open positions.
b. Scaling Positions Dynamically
Adjust size in response to volatility and trend strength.
c. Diversification
Manage multiple trades across assets to reduce risk concentration.
d. Algorithmic or Automated Management
Automated systems can manage stops, take profits, and exit trades based on predefined rules, reducing emotional interference.
12. Conclusion: The Art of Trade Management
Trade management is the bridge between strategy and profitability. While entries are important, how a trader manages the trade—adjusting stops, scaling positions, monitoring risk, and controlling emotions—ultimately determines long-term success. Consistent, disciplined trade management transforms market volatility from a threat into an opportunity.
By mastering this process from entry to exit, traders can:
Minimize losses during adverse conditions.
Maximize profits during favorable trends.
Build confidence and consistency in their trading approach.
Develop a systematic, rules-based trading methodology that outperforms purely speculative approaches.
The ultimate goal is not just winning trades but managing trades to create sustainable, long-term profitability.
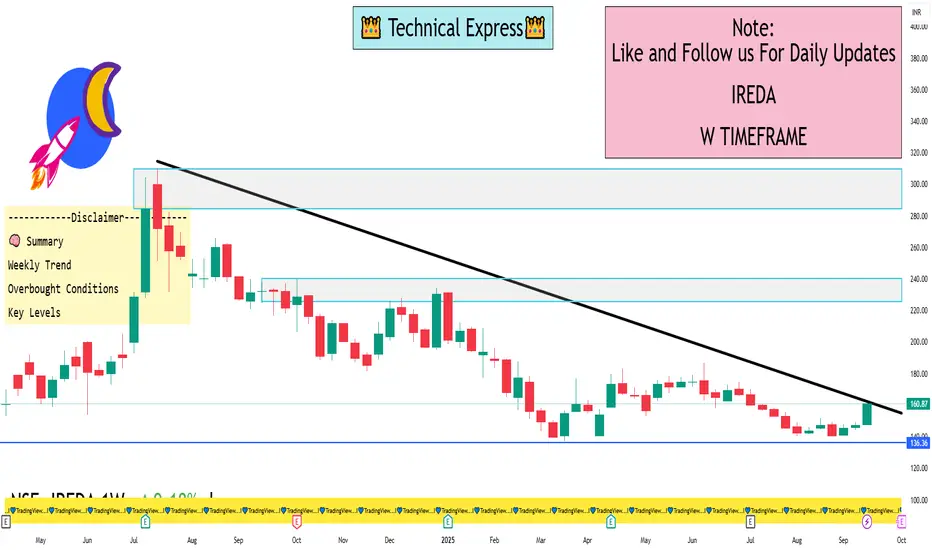
IREDA 1 Week View📈 Current Price & Trend
Latest Price: ₹160.87
Weekly Change: +9.14%
52-Week Range: ₹137.01 – ₹239.90
Market Cap: ₹45,192 Cr
🔍 Technical Indicators (Weekly)
RSI (14): 62.41 — Neutral to Bullish
MACD (12,26): 0.05 — Slight Bullish Crossover
ADX (14): 23.78 — Neutral Trend Strength
Stochastic RSI: 85.02 — Overbought Signal
Williams %R: -9.76 — Overbought Signal
CCI (14): 171.45 — Overbought Signal
ROC (14): 6.10 — Bullish Momentum
📊 Moving Averages (Weekly)
5-Day EMA: ₹149.41 — Bullish
10-Day EMA: ₹147.30 — Bullish
20-Day EMA: ₹146.27 — Bullish
50-Day EMA: ₹150.48 — Bullish
100-Day EMA: ₹158.11 — Bearish
200-Day EMA: ₹172.56 — Bearish
🔁 Pivot Levels
Support Levels: ₹145.02 (S1), ₹142.23 (S2)
Resistance Levels: ₹161.88 (R1), ₹158.12 (R2)
Pivot Point: ₹151.57
🧠 Summary
Weekly Trend: Bullish momentum with a strong uptrend.
Overbought Conditions: Indicators like Stochastic RSI, Williams %R, and CCI suggest potential short-term pullback.
Key Levels: Watch for support at ₹145.02 and resistance at ₹161.88.
Part 2 Ride The Big Moves Key Option Terms
Understanding option trading requires familiarity with essential terms:
Underlying Asset: The security (stock, index, commodity, currency) on which an option is based.
Strike Price: The pre-decided price at which the underlying asset can be bought or sold.
Expiration Date: The date on which the option contract expires.
Premium: The price paid to purchase the option.
In-the-Money (ITM): Call options where the underlying price > strike price, and put options where the underlying price < strike price.
Out-of-the-Money (OTM): Call options where the underlying price < strike price, and put options where the underlying price > strike price.
At-the-Money (ATM): Strike price is equal or near the underlying asset’s price.
American vs European Options: American options can be exercised anytime before expiration; European options only on the expiration date.
Option Pricing
Option pricing is influenced by several factors. The Black-Scholes Model and Binomial Models are commonly used to calculate theoretical option prices. Major factors include:
Underlying Asset Price: Higher prices increase call option value and decrease put option value.
Strike Price: Determines profitability; the closer to the underlying price, the more valuable an option.
Time to Expiration: Longer duration generally increases option premiums due to higher uncertainty.
Volatility: Higher volatility increases the probability of profitable movements, raising option value.
Interest Rates: Affects the cost of carry and slightly influences options pricing.
Dividends: Expected dividends impact option value, especially for stocks.
