Bearish Pullback Into Resistance, Downside Target in FocusMarket Structure
Price previously made a strong impulsive drop, followed by a rounded bottom / corrective recovery.
That recovery looks corrective, not impulsive (overlapping candles, curved structure), suggesting a bearish continuation setup rather than a trend reversal.
Key Zones
Major Resistance (≈ 5,100 – 5,130)
This zone previously acted as support, then flipped to resistance (classic S/R flip).
Price is projected to retest this zone before rejecting.
Support / Target Zone (≈ 4,750)
Strong demand zone where price previously reacted sharply.
Labeled clearly as the downside target.
Pattern & Bias
The white projection suggests a pullback → lower high → continuation down.
This resembles a bearish retracement into resistance, aligned with:
Prior breakdown level
Failure to reclaim key resistance
Momentum on the right side is weaker than the prior sell-off → bearish divergence in structure.
Trade Idea (Based on the Drawing)
Bias: Bearish below resistance
Entry Area: Near the resistance zone (~5,100)
Invalidation: Clean break and hold above resistance
Target: Support zone around ~4,750
Summary
Gold appears to be in a bearish continuation phase, with price likely retracing into resistance before rolling over. As long as resistance holds, the path of least resistance remains downward toward the marked support.
If you want, I can:
Trade

Quarterly Results: High-Impact Trading Strategies1. Why Quarterly Results Matter So Much
Quarterly earnings influence markets because they:
Update real financial reality versus expectations
Reset valuation assumptions
Alter future growth outlooks
Trigger institutional rebalancing
Create liquidity surges and volatility expansion
Markets do not react to numbers alone. They react to the difference between expectations and reality, known as earnings surprise.
Key drivers of price reaction:
Revenue vs estimates
EPS vs estimates
Guidance upgrades/downgrades
Management commentary tone
Margin expansion or contraction
2. Pre-Earnings Trading Strategies
Pre-earnings trades aim to capture anticipation, positioning, and volatility buildup.
A. Earnings Run-Up Strategy
Many stocks trend upward before results due to:
Analyst upgrades
Institutional accumulation
Positive sector sentiment
Strategy logic
Buy strong stocks 2–4 weeks before earnings
Ride the momentum until just before results
Exit partially or fully before announcement
Best conditions
Strong relative strength vs index
Consistent higher highs and higher lows
Positive earnings history
Risk
Sudden negative leaks or macro shocks
B. Volatility Expansion Play
Implied volatility typically rises before earnings.
Approach
Trade breakout setups near key levels
Use tight stop losses
Target fast momentum moves
Technical focus
Compression patterns (triangle, flag, box range)
Rising volumes into earnings
Narrow daily ranges before expansion
C. Avoid Directional Bets Without Edge
Blindly buying or shorting before results is gambling. Pre-earnings trades should be momentum-based, not prediction-based.
3. Result-Day Trading Strategies (High Risk, High Reward)
Earnings day offers explosive opportunities—but also extreme risk.
A. Gap-Up Continuation Trade
When a stock gaps up strongly and holds above key levels:
Entry
After first 15–30 minutes
Above VWAP or opening range high
Confirmation
Strong volumes
Minimal selling pressure
Price acceptance above gap zone
Target
Measured move or intraday resistance
B. Gap-Up Failure (Fade Trade)
Not all positive results sustain.
Signs of failure
Price rejects opening highs
Heavy selling volume
Break below VWAP
Strategy
Short below VWAP with tight stop
Target gap fill or previous close
This works well when:
Valuations are stretched
Market sentiment is weak
Guidance disappoints despite good numbers
C. Gap-Down Reversal (Dead Cat Bounce or True Reversal)
Large gap-downs can lead to:
Panic selling
Forced institutional exits
Reversal signs
Long lower wicks
Volume climax
Stabilization near support
Only aggressive traders should attempt this strategy.
4. Post-Earnings Trading Strategies (Most Consistent)
Post-earnings trades are statistically safer because uncertainty is removed.
A. Earnings Momentum Continuation
Strong results often lead to multi-week trends.
Ideal setup
Breakout above long-term resistance
Rising volumes post earnings
Analyst upgrades after results
Holding period
Days to weeks
Tools
Moving averages
Trend channels
Trailing stop losses
B. Post-Earnings Drift Strategy
Markets underreact initially and adjust over time.
Characteristics
Gradual trend continuation
Pullbacks bought aggressively
Strong relative strength
This is one of the most reliable earnings-based strategies.
C. Earnings Breakdown Short Trade
Negative earnings surprises can cause:
Structural trend breakdowns
Long-term distribution
Entry
Breakdown below support after results
Failed pullback retests
Target
Next major support zones
Best for:
High-debt companies
Weak cash flows
Deteriorating guidance
5. Sector and Index Influence
Earnings reactions depend heavily on:
Sector sentiment
Index trend (NIFTY, SENSEX, NASDAQ, S&P 500)
Example
Strong results in a weak market may still fail
Moderate results in a bullish sector may outperform
Always align earnings trades with:
Sector momentum
Broader market structure
6. Position Sizing and Risk Management
Quarterly results can move stocks 5–25% overnight.
Key risk rules:
Never risk more than 1–2% of capital per earnings trade
Reduce position size compared to normal trades
Avoid overexposure to multiple earnings trades at once
Respect gap risk—stop losses don’t work overnight
7. Common Mistakes Traders Make
Trading earnings without a plan
Ignoring guidance and commentary
Overtrading on result day
Holding losing trades hoping for reversal
Confusing good numbers with good price action
Remember: Price reaction > numbers
8. Professional Trader’s Earnings Checklist
Before every earnings trade:
Is the stock in a trend?
What is the market expecting?
How has the stock reacted to past earnings?
Where are key support/resistance levels?
What is my predefined risk?
If these answers aren’t clear, skip the trade.
9. Long-Term Perspective
Earnings trading is not about predicting results—it’s about reacting faster and smarter than the crowd. Professionals wait for confirmation, manage risk ruthlessly, and trade only high-quality setups.
The best traders treat earnings as:
Volatility opportunities
Trend accelerators
Risk events to be respected
Conclusion
Quarterly results are among the highest-impact events in financial markets, capable of reshaping trends in minutes and defining direction for months. High-impact earnings trading requires discipline, preparation, technical awareness, and emotional control.
Traders who focus on price behavior, volume confirmation, and post-earnings trends—rather than predictions—consistently outperform those who gamble on numbers alone.

Volatility Index (VIX) Trading: Measuring Risk and Timing TradesWhat Is the Volatility Index (VIX)?
The VIX measures the market’s expectation of 30-day forward volatility derived from S&P 500 index option prices. Instead of tracking past price movements, it reflects implied volatility, meaning how much traders expect the market to fluctuate in the near future.
A low VIX suggests calm markets and investor confidence
A high VIX indicates fear, uncertainty, and elevated risk
Unlike price indices, the VIX is mean-reverting, meaning it tends to return to long-term average levels after extreme moves.
How the VIX Measures Risk
1. Market Sentiment Indicator
The VIX captures collective trader psychology. When investors rush to buy protective options (puts), implied volatility rises, pushing the VIX higher. This behavior often appears during:
Economic uncertainty
Geopolitical events
Financial crises
Sharp market sell-offs
Thus, the VIX becomes a real-time indicator of fear and risk aversion.
2. Risk Perception vs Actual Risk
Importantly, the VIX measures expected risk, not actual price movement. Markets can fall with a low VIX or rise with a high VIX. However:
Rising VIX + falling markets = confirmed risk escalation
Rising VIX + rising markets = instability beneath optimism
This distinction helps traders anticipate volatility expansions before price breakdowns occur.
Interpreting VIX Levels
Although exact levels vary over time, traders commonly interpret the VIX as follows:
Below 15 – Low volatility, complacency, bullish bias
15–20 – Normal volatility, balanced market
20–30 – Elevated risk, caution zone
Above 30 – High fear, panic conditions
Above 40 – Crisis or extreme uncertainty
Low VIX environments often precede sudden volatility spikes, while extremely high VIX levels frequently mark market bottoms.
VIX and Market Timing
1. VIX as a Contrarian Indicator
One of the most powerful uses of the VIX is contrarian trading. Extreme fear often occurs near market lows, while extreme calm often appears near market tops.
Very high VIX → potential buying opportunity in equities
Very low VIX → warning sign of overconfidence
This works because markets tend to overreact emotionally during extremes.
2. VIX Breakouts and Trend Changes
A sudden breakout in the VIX from a low base often signals:
Trend exhaustion
Incoming market correction
Transition from accumulation to distribution
Traders monitor VIX breakouts alongside:
Support/resistance on indices
Volume spikes
Market breadth deterioration
A rising VIX with weakening index structure often confirms trend reversal risk.
3. VIX Divergence Analysis
Divergences between the VIX and market indices provide early warning signals.
Bullish divergence: Market makes lower lows, VIX fails to make higher highs → selling pressure weakening
Bearish divergence: Market makes higher highs, VIX refuses to fall → hidden risk building
Such divergences are especially useful near major support or resistance levels.
Trading Strategies Using the VIX
1. Equity Market Confirmation Strategy
Traders use the VIX to confirm equity trades:
Long trades preferred when VIX is falling or stable
Short trades favored when VIX is rising sharply
Avoid aggressive longs during VIX spikes unless trading reversals
This approach helps filter false breakouts and low-probability setups.
2. Volatility Expansion and Contraction
Volatility moves in cycles:
Low volatility leads to high volatility
High volatility leads to low volatility
Traders anticipate expansion after prolonged quiet periods. Range-bound markets with a compressed VIX often precede:
Breakouts
Trend acceleration
News-driven moves
Recognizing these phases improves timing and position sizing.
3. Hedging with VIX Instruments
The VIX is widely used for portfolio hedging. During market stress:
Equity portfolios lose value
VIX instruments often gain
Professional traders hedge risk using:
VIX futures
VIX options
Volatility ETFs (with caution due to decay)
This strategy protects capital during sudden market shocks.
4. Options Trading and the VIX
For options traders, the VIX is critical:
High VIX → options expensive → prefer selling strategies
Low VIX → options cheap → prefer buying strategies
Using the VIX helps traders choose:
When to sell premium
When to buy volatility
Appropriate strike selection
Ignoring volatility often leads to poor risk-reward outcomes.
VIX and Risk Management
Position Sizing
When the VIX is elevated, price swings widen. Smart traders:
Reduce position size
Widen stop-losses
Avoid over-leveraging
Low VIX environments allow for:
Tighter stops
Higher leverage (with caution)
Adjusting size based on volatility keeps risk consistent.
Avoiding Emotional Trading
The VIX reflects collective fear, not just individual emotion. Watching it objectively helps traders:
Avoid panic selling
Stay disciplined during volatility spikes
Recognize when fear is excessive
This psychological edge is often more valuable than technical indicators alone.
Limitations of VIX Trading
While powerful, the VIX is not perfect:
It does not predict market direction
It is based on S&P 500 options, not all markets
Short-term VIX products suffer from decay
Sudden news can override signals
Therefore, the VIX should be used as a confirmation and risk tool, not a standalone system.
Conclusion
Volatility Index trading is less about predicting price and more about understanding risk, emotion, and timing. The VIX reveals what price charts often hide—market anxiety, complacency, and expectation. By integrating VIX analysis into trading strategies, traders gain a deeper awareness of when to be aggressive, when to protect capital, and when to wait.
Successful traders do not fight volatility—they read it, respect it, and trade around it. When used correctly, the VIX becomes not just a fear gauge, but a powerful compass for navigating uncertain markets.

Part 1 Institutional Option Trading Vs. Techncal Analysis What Are Options?
Options are contracts that give you the right but not the obligation to buy or sell an asset at a fixed price before a certain date.
They are derivative instruments — their value comes from the underlying asset (index, stock, commodity, currency).
Options are mostly used for hedging, speculation, and income generation.

Algorithmic & Quantitative Trading – Basics Explained1. What is Algorithmic Trading?
Algorithmic Trading (Algo Trading) refers to using computer algorithms to automatically place trades based on predefined rules. These rules can be based on:
Price
Time
Volume
Technical indicators
Mathematical models
Once the algorithm is deployed, it can monitor markets, generate signals, and execute trades without human intervention.
Simple Example
An algorithm may be programmed as:
“Buy 100 shares of a stock when its 20-day moving average crosses above the 50-day moving average, and sell when the reverse happens.”
The computer continuously checks this condition and executes trades instantly when criteria are met.
2. What is Quantitative Trading?
Quantitative Trading (Quant Trading) is a broader concept that focuses on using statistical, mathematical, and probabilistic models to identify patterns in market data.
While algorithmic trading focuses on execution automation, quantitative trading focuses on:
Strategy design
Data analysis
Model building
Risk optimization
Most quantitative strategies are eventually implemented through algorithms, but not all algorithms are deeply quantitative.
3. Key Differences: Algo vs Quant Trading
Aspect Algorithmic Trading Quantitative Trading
Focus Automated execution Strategy development using math
Complexity Can be simple Often highly complex
Tools Rule-based logic Statistics, probability, ML
Human role Minimal after deployment High during research phase
Objective Speed & discipline Edge discovery & optimization
In practice, modern trading combines both.
4. Core Components of Algo & Quant Trading
1. Data
Data is the foundation. Common types include:
Price data (OHLC)
Volume data
Order book data
Corporate actions
Macroeconomic indicators
Data quality directly impacts strategy performance.
2. Strategy Logic
This defines when to buy, sell, or hold. Strategies can be:
Trend-following
Mean-reversion
Momentum-based
Arbitrage-based
Statistical models
Clear logic ensures consistency and removes emotional bias.
3. Backtesting
Backtesting evaluates how a strategy would have performed using historical data.
Key metrics include:
Net profit
Drawdown
Win rate
Sharpe ratio
Risk-reward ratio
Backtesting helps identify flaws before risking real capital.
4. Risk Management
Risk control is crucial. Common rules:
Fixed percentage risk per trade
Stop-loss and take-profit
Maximum drawdown limits
Position sizing models
A profitable strategy without risk control will eventually fail.
5. Execution System
Execution algorithms ensure:
Minimal slippage
Optimal order placement
Reduced market impact
Examples:
VWAP (Volume Weighted Average Price)
TWAP (Time Weighted Average Price)
5. Common Algorithmic Trading Strategies
1. Trend-Following Strategies
These aim to capture sustained price movement using:
Moving averages
Breakouts
Channel systems
Popular among beginners due to simplicity.
2. Mean Reversion Strategies
Based on the idea that prices revert to an average over time.
Examples:
RSI oversold/overbought systems
Bollinger Band reversals
Works well in range-bound markets.
3. Arbitrage Strategies
Exploits price differences between:
Cash and futures
Two exchanges
Related instruments
Requires high speed and low transaction costs.
4. Statistical Arbitrage
Uses correlations and probabilities between assets.
Example:
Pair trading (e.g., Reliance vs ONGC)
Relies heavily on quantitative analysis.
5. Market Making
Continuously places buy and sell orders to profit from bid-ask spread.
Mostly used by institutions due to infrastructure requirements.
6. Quantitative Models Used in Trading
1. Statistical Models
Regression analysis
Correlation & covariance
Z-score models
Used for identifying relationships between assets.
2. Probability & Risk Models
Normal distribution
Value at Risk (VaR)
Monte Carlo simulations
Used for risk estimation and stress testing.
3. Machine Learning Models
Advanced quants use:
Linear regression
Decision trees
Random forests
Neural networks
These models detect hidden patterns but require careful validation.
7. Benefits of Algorithmic & Quant Trading
Eliminates emotional decision-making
Faster execution than manual trading
Consistent application of rules
Ability to test strategies objectively
Scalability across multiple instruments
8. Risks and Challenges
Despite advantages, there are risks:
Overfitting historical data
Strategy failure in changing markets
Technology glitches
Data errors
Regulatory constraints
Successful traders focus on robustness, not perfection.
9. Algo & Quant Trading in Indian Markets
In India, algo trading is widely used in:
Index futures & options
Liquid stocks
Arbitrage strategies
SEBI regulations require:
Broker-approved algorithms
Risk checks
Order limits
Audit trails
Retail traders usually access algo trading through:
Broker APIs
Semi-automated platforms
Strategy builders
10. Skills Required to Learn Algo & Quant Trading
Basic statistics & probability
Market microstructure knowledge
Programming (Python preferred)
Understanding of trading psychology
Risk management principles
You don’t need to be a mathematician initially, but logic and discipline are essential.
11. Conclusion
Algorithmic and Quantitative Trading represent the evolution of trading from intuition-based decisions to systematic, data-driven processes. While institutions dominate advanced quantitative strategies, retail traders can still benefit from simpler rule-based algorithms.
Success in this field comes not from complexity, but from:
Well-tested logic
Strong risk management
Continuous learning
Adaptability to market conditions
When used correctly, algorithmic and quantitative trading can transform trading from speculation into a structured business.

The Global IPO Market1. What Is an IPO & Why It Matters
An Initial Public Offering (IPO) is when a private company offers its shares to the public for the first time by listing on a stock exchange. It allows companies to raise capital from a broad investor base, provides liquidity to early investors and employees, and increases visibility and credibility. In return, public markets demand transparency, regulatory compliance, and ongoing disclosure.
IPOs serve as a crucial mechanism in global finance for capital formation, enabling companies to fund expansion, repay debt, invest in research and development, and pursue acquisitions. For investors, IPOs can offer growth opportunities—especially if the company scales rapidly post‑listing.
2. How the Global IPO Market Works
Key Participants
Issuing Company (Issuer): Seeks capital through a public listing.
Underwriters/Investment Banks: Advise on pricing, structure the deal, and sell shares to institutional and retail investors.
Stock Exchanges: Provide the platform for listing (e.g., NYSE, Nasdaq, HKEX).
Regulators: Oversee disclosure and compliance (e.g., SEC in the U.S.).
Investors: Institutional (mutual funds, hedge funds) and retail investors who buy shares.
Process Overview
Preparation: Financial audits, governance structures, and prospectus creation.
Due Diligence: Underwriters evaluate company financials and market potential.
Marketing (Roadshow): Presenting the investment case to potential investors.
Pricing: Shares are priced based on demand and valuation metrics.
Listing: Shares begin trading publicly, often with first‑day “pop” or volatility.
The success of an IPO depends on market conditions, investor appetite, sector momentum, and broader economic trends.
3. Current Trends in the Global IPO Market (2025)
Overall Market Health
After years of caution driven by geopolitical tensions, interest rate uncertainty, and volatility, 2025 saw a stabilizing and resilient global IPO market. According to data from EY’s Global IPO Trends, there were approximately 1,293 IPOs raising US$171.8 billion globally in 2025, signaling renewed confidence and a shift toward higher‑quality offerings.
This continues a trend of recovery following slow periods in 2022–24. While not yet at the frothy peaks of the 2021 boom, IPO markets are showing strength characterized by larger deal sizes and selective investor interest in standout companies.
Volume vs. Proceeds
Data indicates that while the number of IPOs hasn’t surged dramatically, total capital raised is increasing—reflecting a shift toward larger, more established issuers deciding to go public rather than many small firms. This is a key metric of market maturity and investor selectivity.
Cross‑Border Listings
Companies increasingly choose to list on foreign exchanges—a trend especially evident in the U.S. This can enhance liquidity and broaden the investor base. Cross‑border IPOs reached multi‑decade highs in 2025, highlighting globalization within equity capital markets.
Sector Focus
Major IPO activity is concentrated in sectors that attract investor interest, such as:
Technology & AI: Companies tied to digital transformation.
Fintech: Financial technology firms tapping broader capital markets.
Healthcare & Life Sciences: Biotech and life science companies.
Industrials & Consumer Goods: Established firms with strong growth plans.
4. Regional Dynamics
Asia‑Pacific
Asia continues to be a powerhouse in IPO activity.
Greater China (including Hong Kong and mainland China) has emerged as a dominant source of IPO proceeds, capturing around one‑third of global capital raised in the first half of 2025.
Hong Kong Exchange (HKEX) has enjoyed strong listings in 2025, with companies raising significant capital — reflecting confidence in Asia’s public markets.
India has also shown strong IPO volume and improvement in fundraising, trending toward record years and ranking among the top global IPO markets.
This reflects broader economic growth in the region, deepening equity markets, and policy frameworks aimed at attracting listings.
United States
The U.S. traditionally leads global IPO markets in capital raised thanks to large tech and growth company listings:
The U.S. recorded strong IPO volumes in early to mid‑2025—the highest since 2021 in some quarters.
Some of the most anticipated potential IPOs (e.g., SpaceX) could redefine market scale if they materialize.
However, intermittent challenges like regulatory slowdowns (e.g., government shutdowns affecting the SEC) have occasionally slowed the pace of launches.
Europe
Europe’s IPO market remains smaller relative to Asia and the U.S. but showed record momentum at the start of 2026 with major industrial and defense listings.
Emerging Markets
Latin America, the Middle East, and other emerging regions see sporadic but noteworthy IPOs, with firms choosing international listings to access deeper capital pools.
5. Major Recent IPOs & Signals
2026 Activity Indicators
Even in early 2026, new signs of life include:
PicPay’s Nasdaq IPO marking a return of Brazilian companies to public markets after a multi‑year break.
Agibank’s planned U.S. IPO underlining fintech interest from Latin America.
Busy Ming’s successful Hong Kong IPO showing continued appeal of Asian listings.
These signals reflect a nuanced landscape where IPOs are widely spread across sectors and geographies.
6. Challenges Facing the IPO Market
Despite improvements, the global IPO market faces several persistent challenges:
Market Volatility & Economic Uncertainty
Global macroeconomic uncertainty—driven by tariffs, interest rate shifts, and geopolitical tensions—has made companies more cautious about listing timing.
Regulatory & Compliance Pressures
Companies face rising compliance costs and investor demands for transparency and ESG (environmental, social, governance) disclosures—both prerequisites for modern listings.
Investor Selectivity
Investors increasingly focus on firm quality, profitability pathways, and sustainability of growth. Firms with weak fundamentals or unclear growth prospects often delay or cancel IPO plans.
Valuation Concerns
High valuation expectations by private companies sometimes misalign with market realities, leading to postponed listings or sub‑par performances post‑IPO.
7. The Future Outlook
The outlook for the global IPO market remains cautiously optimistic, with several key forces shaping its trajectory:
Strong Pipelines
Many large private companies (especially in tech, fintech, and biotech) remain IPO candidates. As markets stabilize, these firms may enter public markets—potentially providing a meaningful uplift to aggregate proceeds.
Innovation & New Sectors
New sectors like AI, green tech, and biotech are attracting investors and may lead to new high‑value IPOs.
Geographic Shifts
Asia’s increasing share and cross‑border listings suggest a more balanced global IPO market, reducing reliance on single regions.
Economic Policies
If monetary easing continues and geopolitical tensions reduce, IPO markets are likely to see further expansion in both number and value of offerings.
8. Conclusion
The global IPO market in the mid‑2020s has shifted from the uncertainty of the early 2020s to a phase of resilience and cautious expansion. While market volatility and external economic pressures remain challenges, structural improvements, stronger investor sentiment, and megadeals in promising sectors suggest a maturing market with significant future capital formation potential.
Whether for young innovators or established industrial firms, the IPO remains a central pillar of global capital markets—connecting companies with investors and driving growth across regions and industries.

GVT&D 1 Week View 📊 Current context (end-Jan 2026):
The stock is trading near ₹3,100-₹3,200 levels recently.
📈 Resistance Levels (Upside Targets)
1. ~₹3,170 – ₹3,200
– Near recent intraday highs and short-term caps on rallies.
2. ~₹3,250 – ₹3,324
– Approaching the 52-week high zone (~₹3,323.8).
3. ~₹3,350 +
– Above the prior yearly highs — next structural resistance if breakout confirmed.
📉 Support Levels (Downside Floors)
1. ~₹2,670 – ₹2,680
– First solid support zone from pivot analyses & moving averages.
2. ~₹2,600 – ₹2,610
– Secondary support around longer-term EMA levels / 200-day average and prior consolidations.
3. ~₹2,520 – ₹2,550
– Lower support in case of deeper correction — near the 1-week recent low zone.
🔄 Pivot & Momentum Signals
Technical tools (e.g., trading platforms) suggest mixed/neutral to moderately bullish momentum in the 1-week context, with some indicators leaning positive but others neutral.

AXISBANK 1 Month View📈 Current Context
As of late January 2026, Axis Bank’s stock is trading around ₹1,300 – ₹1,340 range amid strong recent earnings and price momentum.
📊 1-Month Key Levels (Daily/Short-Term Range)
🔼 Resistance (Upside)
1. ₹1,340 – ₹1,350 – Near recent high/resistance zone (short-term cap)
2. ₹1,355 – ₹1,365 – Next resistance cluster above recent highs
3. ₹1,370 + – Broader higher breakout zone if strong bullish continuation occurs
Note: Weekly/short weekly resistance zones are around ₹1,317-₹1,320 and then ₹1,340-₹1,350.
🔽 Support (Downside)
1. ₹1,280 – ₹1,285 – Immediate support near recent pivot lows
2. ₹1,270 – ₹1,275 – Secondary support zone tracked by moving averages
3. ₹1,260 – ₹1,265 – Broader channel support if price weakens further
🧭 Interpretation for a 1-Month View
Bullish scenario: A sustained break and close above ₹1,350 could extend momentum toward ₹1,365+ in the coming weeks.
Bearish scenario: A break below ₹1,270 might open the path toward ₹1,250 – ₹1,260 support cluster.
Neutral/Range: In sideways conditions, expect most trading between roughly ₹1,270 – ₹1,350.

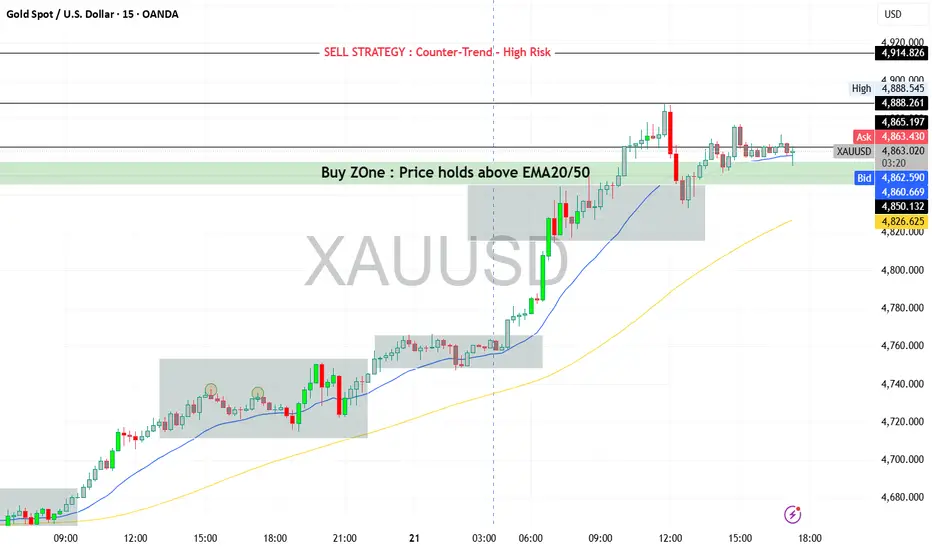
XAUUSD (Gold) | Bullish vs Bearish Scenario | Trading SetupBullish vs Bearish View
Bullish Scenario (Primary Bias – Trend Continuation)
Trend remains strongly bullish as long as price holds above the pivot zone (4858–4845).
Buyers are in control, supported by ADX strength, MACD momentum, and moving average
alignment.
Break and hold above 4888 opens the door for further upside expansion.
Bearish Scenario (Corrective Pullback Only)
Bearish moves are considered corrective, not trend-reversing, unless price falls below 4800.
Overbought conditions may trigger short-term profit booking, but trend remains bullish
above key supports.
Key Levels to Watch
Resistance Levels
4888 – 4895 (Day high / breakout zone)
4914
4939 – 4950 (extension zone)
Support Levels
4858 – Pivot
4845
4829
4803
4773 (strong trend support)
Intraday Trading Strategy (Day Trading Plan)
Strategy Type:
Trend Continuation Buy-on-Dips
Buy Setup
Buy Zone: 4858 – 4845 (pivot support / minor pullback)
Confirmation:
Price holds above EMA20 / EMA50
Bullish rejection candle or continuation pattern on M15–M30
Targets
Target 1: 4888
Target 2: 4914
Target 3 (extension): 4939
Stop Loss
Intraday SL: Below 4825
Aggressive SL: Below 4800 (trend invalidation zone)
Alternative Sell Strategy (Counter-Trend – High Risk)
⚠️Only for experienced traders
Sell Zone: 4914 – 4940
Condition: Clear rejection + bearish divergence on M15/M30
Target: 4880 → 4858
Stop Loss: Above 4955
Preferred Trading Style Today
✔️Buy on dips
❌Avoid chasing price at highs
❌Avoid heavy counter-trend sells
RSI Indicator: Sector-Wise Analysis and Its Importance in MarketUnderstanding RSI in Brief
RSI is plotted on a scale of 0 to 100. Traditionally:
An RSI above 70 indicates an overbought condition.
An RSI below 30 suggests an oversold condition.
RSI around 50 reflects a neutral or balanced momentum.
At the sector level, RSI does not focus on a single stock but instead represents the collective momentum of a group of stocks belonging to the same industry, such as banking, IT, pharmaceuticals, metals, FMCG, or energy.
Concept of Sector-Wise RSI
Sector-wise RSI measures the strength or weakness of an entire sector relative to its recent price performance. For example, if the banking sector index shows an RSI of 75, it implies strong bullish momentum and possibly overheating conditions across banking stocks. Conversely, if the IT sector RSI is at 28, it signals sector-wide weakness and potential undervaluation.
This approach helps market participants move beyond stock-specific noise and understand where institutional money is flowing. Since large investors often rotate capital between sectors rather than individual stocks, sector RSI becomes a powerful indicator of market rotation.
Importance of Sector RSI in Market Analysis
One of the biggest advantages of sector-wise RSI is its ability to identify leading and lagging sectors. When a sector’s RSI consistently remains above 60, it indicates sustained strength and leadership. Sectors with RSI stuck below 40 often represent laggards, showing weak demand or bearish sentiment.
Sector RSI also helps traders avoid false signals. A stock may show bullish RSI, but if its sector RSI is weak, the rally might be short-lived. On the other hand, when both stock RSI and sector RSI align, the probability of a successful trade increases significantly.
Sector RSI and Market Cycles
Markets move in cycles, and sector RSI plays a crucial role in identifying different phases of these cycles. During the early stage of a bull market, cyclical sectors like metals, capital goods, and banking often show rising RSI values. In the mid-phase, sectors such as IT and infrastructure may gain momentum. In the late phase, defensive sectors like FMCG and pharmaceuticals usually display stronger RSI as investors seek stability.
Similarly, during bear markets, sector RSI helps identify which sectors are experiencing aggressive selling and which ones are showing resilience. Defensive sectors often maintain higher RSI levels even during broader market corrections.
Overbought and Oversold Conditions at Sector Level
While overbought and oversold levels are useful, they should not be interpreted in isolation. A sector RSI above 70 does not always mean an immediate reversal. In strong bull markets, sectors can remain overbought for extended periods. In such cases, RSI staying between 60 and 80 is a sign of healthy strength rather than weakness.
Likewise, an oversold sector RSI below 30 may indicate panic selling or extreme pessimism. Long-term investors often use these zones to identify value opportunities, especially when supported by strong fundamentals.
Sector RSI and Relative Strength Comparison
Sector RSI is also used to compare relative strength between different sectors. For instance, if the auto sector RSI is 65 while the FMCG sector RSI is 45, it suggests that autos are outperforming FMCG in terms of momentum. This comparison helps investors allocate capital more efficiently toward sectors with better risk-reward potential.
Portfolio managers frequently rebalance portfolios based on sector RSI trends, increasing exposure to strong sectors and reducing allocation in weak ones.
Combining Sector RSI with Other Indicators
Although sector RSI is powerful, it works best when combined with other technical and fundamental tools. Trend indicators like moving averages help confirm whether a sector is in an uptrend or downtrend. Volume analysis reveals whether RSI movements are supported by strong participation. Macroeconomic factors such as interest rates, inflation, and government policies also influence sector performance and should be considered alongside RSI.
For example, a rising RSI in the banking sector combined with improving credit growth and stable interest rates strengthens the bullish case. Similarly, a falling RSI in the metal sector alongside declining global commodity prices reinforces bearish sentiment.
Sector RSI for Different Market Participants
Short-term traders use sector RSI to identify momentum trades and sector-based breakouts. Swing traders look for RSI reversals near key support or resistance levels. Long-term investors use sector RSI to time entry and exit points within broader asset allocation strategies.
For beginners, sector RSI provides a simplified view of the market by reducing the complexity of tracking hundreds of stocks individually. It allows them to focus on broader trends and make more informed decisions.
Limitations of Sector RSI
Despite its usefulness, sector RSI has limitations. It is a lagging indicator and reflects past price movements rather than future certainty. Sudden news events, policy changes, or global shocks can quickly invalidate RSI signals. Additionally, sector indices may be dominated by a few heavyweight stocks, which can skew RSI readings.
Therefore, relying solely on sector RSI without context can lead to incorrect conclusions. It should always be used as part of a comprehensive analysis framework.
Conclusion
The RSI indicator at the sector level is a valuable tool for understanding market momentum, identifying sector rotation, and improving decision-making across trading and investment horizons. By analyzing sector-wise RSI, market participants gain clarity on which industries are gaining strength, which are losing momentum, and where potential opportunities or risks lie. When combined with trend analysis, volume, and fundamental insights, sector RSI becomes a powerful guide in navigating dynamic financial markets. In an environment where sector performance often drives overall market direction, sector-wise RSI analysis is not just useful—it is essential.

Unlock Trading SecretsUnderstanding Market Behavior
The first trading secret lies in understanding that markets move based on a combination of demand and supply, driven by human behavior. Prices do not move randomly; they react to information such as economic data, corporate earnings, geopolitical events, interest rate changes, and market sentiment. Traders who learn to read these influences gain an advantage. Technical analysis helps decode price action through charts, trends, support and resistance levels, and indicators. Fundamental analysis focuses on the intrinsic value of assets by studying financial statements, macroeconomic factors, and industry trends. Successful traders often combine both approaches instead of relying on only one.
The Power of Discipline and Consistency
One of the most overlooked trading secrets is discipline. Many traders fail not because their strategy is poor, but because they cannot follow it consistently. Discipline means sticking to predefined rules for entry, exit, position sizing, and risk management—regardless of emotions or market noise. Consistency in execution allows traders to measure performance accurately and improve over time. Without discipline, even the best strategy becomes ineffective.
Risk Management: The Core Secret
Risk management is the foundation of long-term trading success. Professional traders focus more on controlling losses than maximizing profits. A common rule is to never risk more than a small percentage of trading capital on a single trade. This ensures survival during losing streaks, which are inevitable in trading. Using stop-loss orders, maintaining a favorable risk-to-reward ratio, and avoiding overleveraging are critical practices. The secret here is simple but powerful: protect your capital first, and profits will follow.
Psychology and Emotional Control
Trading psychology is often described as the true battlefield. Fear, greed, hope, and revenge trading can sabotage even the most skilled traders. Fear may cause early exits, while greed may lead to overtrading or holding positions too long. Emotional control is developed through self-awareness, experience, and structured routines. Keeping a trading journal, reviewing mistakes, and accepting losses as part of the process help build mental resilience. Traders who master their emotions gain a significant edge over those who react impulsively.
Developing a Trading Strategy
Another key trading secret is having a clear, well-tested strategy. A strategy defines what to trade, when to trade, and how to trade. It may be based on trends, breakouts, reversals, momentum, or events such as earnings and economic announcements. The important factor is not the complexity of the strategy, but its clarity and repeatability. Backtesting strategies on historical data and forward-testing them in live or simulated markets builds confidence and reliability.
Timeframe and Trading Style Alignment
Not all trading styles suit every individual. Some traders thrive in fast-paced intraday trading, while others prefer swing trading or long-term investing. Understanding your personality, time availability, and risk tolerance is a crucial secret. A strategy that works well for one trader may fail for another simply due to differences in patience or decision-making speed. Aligning your trading style with your lifestyle increases the chances of consistency and long-term success.
Learning from Losses and Mistakes
Losses are unavoidable in trading, but they are also valuable teachers. The secret is not avoiding losses entirely, but learning from them. Each losing trade offers insight into strategy flaws, emotional mistakes, or market conditions. Traders who analyze losses objectively and make adjustments continuously improve. Those who ignore or emotionally react to losses often repeat the same mistakes.
The Role of Market Cycles
Markets move in cycles—bull markets, bear markets, and sideways phases. Recognizing the current phase is a powerful trading secret. Strategies that work well in trending markets may fail in range-bound conditions. Adapting to market cycles instead of forcing trades improves performance. Flexibility and awareness allow traders to shift strategies or reduce activity when conditions are unfavorable.
Patience and Long-Term Vision
Many beginners seek quick profits, but patience is a hidden trading secret. Sustainable success comes from compounding small, consistent gains over time. Professional traders think in terms of months and years, not days. They focus on process over outcome, knowing that results will naturally follow disciplined execution. Patience helps traders wait for high-probability setups instead of chasing every market move.
Continuous Learning and Adaptation
Markets evolve with technology, regulations, and global events. A trader who stops learning eventually falls behind. Continuous education—through books, courses, market analysis, and self-review—is essential. Staying adaptable and open to improvement is a major secret behind longevity in trading.
Conclusion
Unlocking trading secrets is not about finding a hidden indicator or insider tip. It is about mastering the fundamentals: understanding market behavior, managing risk, controlling emotions, following a disciplined strategy, and committing to continuous learning. Trading rewards those who respect the process and remain patient through challenges. When approached with the right mindset and structure, trading becomes less of a gamble and more of a professional skill—one that can deliver consistent results over the long term.

Market Focus: The Foundation of Smart Trading and InvestingUnderstanding What “Market Focus” Really Means
Market focus is the ability to observe, analyze, and respond to market behavior with clarity and purpose. It is not about watching every price tick or reacting to every news headline. Instead, it involves identifying key drivers such as trends, volume, macroeconomic signals, sector strength, and risk sentiment. A focused market participant knows where to look, what to ignore, and when to act.
Many participants confuse activity with focus. Constant trading, excessive chart watching, or chasing hot tips often reduces focus rather than enhancing it. True market focus simplifies complexity. It narrows attention to high-probability setups, reliable data, and repeatable processes.
The Role of Market Structure
A focused approach begins with understanding market structure. Markets move in trends, ranges, and transitions. Recognizing whether the market is bullish, bearish, or sideways provides a framework for decision-making. Trading against the dominant structure often leads to unnecessary losses, while trading with structure improves probability.
Market structure also includes support and resistance zones, supply and demand areas, and liquidity levels. These are not random points but areas where institutional participation is often concentrated. Focusing on structure helps traders avoid emotional entries and instead act where risk and reward are clearly defined.
Filtering Noise and Distractions
One of the biggest challenges in maintaining market focus is information overload. Social media, financial news channels, and constant alerts can distort perception. Not every piece of news is actionable. Not every market move requires participation.
A focused market participant develops the ability to separate signal from noise. This includes ignoring rumors, avoiding impulsive trades based on headlines, and sticking to predefined criteria. By reducing unnecessary inputs, clarity improves, and decision-making becomes calmer and more rational.
Importance of Time Frame Alignment
Market focus also depends on aligning with the correct time frame. Short-term traders, swing traders, and long-term investors all view the same market differently. Confusion arises when time frames are mixed—such as taking long-term positions based on short-term emotions or exiting long-term investments due to short-term volatility.
A disciplined focus requires committing to a specific time horizon and analyzing the market accordingly. Weekly and monthly trends guide investors, while intraday and daily structures guide traders. Time frame alignment reduces stress and improves consistency.
Risk Management as a Focus Tool
Risk management is often discussed as protection, but it is also a powerful focus mechanism. When risk is predefined, emotions are controlled. Knowing how much capital is at risk allows the mind to stay objective rather than fearful or greedy.
Focused market participants think in terms of probabilities, not predictions. Losses are accepted as part of the process, not personal failures. This mindset keeps attention on execution quality rather than outcomes of individual trades.
Psychological Discipline and Market Focus
The market constantly tests patience, confidence, and emotional control. Fear, greed, revenge trading, and overtrading are all symptoms of lost focus. Psychological discipline restores market focus by reinforcing rules, routines, and self-awareness.
Successful participants often follow structured routines—pre-market analysis, defined entry and exit rules, and post-market reviews. These habits anchor attention and prevent impulsive decisions. Focused traders and investors understand that consistency comes from behavior, not brilliance.
Adapting to Changing Market Conditions
Market focus does not mean rigidity. Markets evolve due to economic cycles, interest rate changes, geopolitical events, and technological shifts. A focused participant remains adaptable without becoming reactive.
This adaptability comes from continuous learning and observation. When volatility rises, position sizing adjusts. When trends weaken, expectations change. Focus allows participants to respond intelligently rather than emotionally to changing conditions.
Long-Term Vision and Market Focus
For investors, market focus is deeply connected to long-term vision. Short-term market fluctuations are inevitable, but long-term value creation follows fundamentals, earnings growth, and economic expansion. A focused investor resists panic during corrections and avoids euphoria during rallies.
Long-term market focus emphasizes asset allocation, diversification, and compounding rather than frequent trading. This perspective reduces stress and improves wealth-building outcomes over time.
Technology and Tools Supporting Focus
Modern tools—charts, indicators, scanners, and data platforms—can enhance focus when used correctly. However, overuse leads to confusion. Focused market participants select a limited set of tools that complement their strategy and ignore the rest.
Technology should support decision-making, not replace thinking. Simplicity often outperforms complexity in maintaining clarity and discipline.
Conclusion: Focus as a Competitive Advantage
In competitive financial markets, information is widely available, but focus is rare. The ability to concentrate on what truly matters—market structure, risk, time frame, and psychology—creates a lasting edge. Market focus is not built overnight; it develops through experience, discipline, and self-control.
Whether trading short-term or investing long-term, focusing on the market with clarity and purpose transforms uncertainty into opportunity. In the end, success in markets is less about predicting the future and more about maintaining focus in the present.
Advanced Hedging Techniques: Tools for Managing Financial RiskUnderstanding the Concept of Advanced Hedging
Advanced hedging techniques go beyond one-to-one risk offsetting. They are designed to handle non-linear risks, multiple asset correlations, time decay, and tail-risk events. These methods often involve combinations of derivatives, dynamic adjustments, and quantitative models. The primary goal is not always to eliminate risk entirely, but to optimize the risk–return profile by reducing downside exposure while preserving upside potential.
Options-Based Hedging Strategies
One of the most widely used advanced hedging tools involves options strategies. Unlike futures, options provide asymmetric protection, meaning losses can be limited while gains remain open.
Protective Put Strategy: Investors buy put options against an existing equity or portfolio position. This acts as insurance, setting a floor on potential losses during market downturns.
Collar Strategy: This involves buying a put option and simultaneously selling a call option. The premium received from the call helps finance the put, making it a cost-effective hedge, though it caps upside potential.
Ratio Spreads and Backspreads: These strategies hedge volatility risk by adjusting the ratio of long and short options, benefiting from sharp price movements in either direction.
Such option-based hedges are particularly useful in managing event-driven risks such as earnings announcements, policy decisions, or geopolitical shocks.
Delta and Gamma Hedging
Delta hedging is a dynamic hedging technique primarily used by institutional traders and derivatives desks. Delta measures how much the price of an option changes relative to the underlying asset.
In delta hedging, traders continuously adjust their positions in the underlying asset to maintain a delta-neutral portfolio.
Gamma hedging goes a step further by managing the rate at which delta changes, especially important during periods of high volatility.
These techniques require frequent rebalancing and advanced modeling but are highly effective in minimizing small price fluctuations’ impact on portfolios.
Cross-Asset and Cross-Currency Hedging
Modern portfolios often contain exposure across asset classes and geographies. Cross-hedging involves using a related but different asset to hedge risk when a direct hedge is unavailable or illiquid.
For example, an investor holding Indian equities with global exposure may hedge using global indices or ETFs.
Currency hedging uses forward contracts, currency swaps, or options to protect against adverse exchange rate movements.
Advanced currency hedging becomes critical for multinational corporations managing foreign revenues, import costs, and overseas investments.
Interest Rate and Credit Hedging
Interest rate fluctuations can significantly affect bond portfolios, loans, and corporate balance sheets. Advanced tools used in this area include:
Interest Rate Swaps: Converting floating-rate exposure into fixed-rate exposure (or vice versa) to stabilize cash flows.
Swaptions: Options on swaps that provide flexibility to hedge future interest rate uncertainty.
Credit Default Swaps (CDS): Used to hedge against default risk of bonds or loans by transferring credit risk to another party.
These instruments are essential for banks, financial institutions, and companies with high leverage or long-term debt obligations.
Volatility Hedging and Tail Risk Protection
Volatility itself is a tradable and hedgeable risk factor. During market stress, volatility tends to spike, causing large portfolio drawdowns.
VIX-based strategies allow investors to hedge equity portfolios against sudden volatility surges.
Tail risk hedging focuses on protecting against rare but severe market crashes using deep out-of-the-money options or structured products.
Although tail hedges can be expensive, they provide crucial protection during extreme market events, preserving capital and liquidity.
Dynamic and Quantitative Hedging Models
Advanced hedging increasingly relies on quantitative models and algorithms. These models dynamically adjust hedge ratios based on volatility, correlations, and market trends.
Value-at-Risk (VaR) and Expected Shortfall models help determine the size and structure of hedges.
Algorithmic hedging systems execute trades automatically to maintain optimal hedge efficiency.
Such techniques reduce human bias and improve precision, especially in fast-moving markets.
Corporate and Operational Hedging
Beyond financial markets, advanced hedging is also applied to operational risks. Corporations hedge commodity prices, energy costs, and supply chain risks using customized derivative contracts.
For example:
Airlines hedge fuel prices using futures and swaps.
Manufacturing firms hedge raw material costs to protect profit margins.
These strategies ensure earnings stability and support long-term planning.
Benefits and Limitations of Advanced Hedging
Advanced hedging techniques offer several benefits, including reduced volatility, capital preservation, and improved predictability of returns. However, they also come with limitations such as higher costs, complexity, liquidity risk, and the need for continuous monitoring. Poorly designed hedges can sometimes amplify losses rather than reduce them.
Conclusion
Advanced hedging techniques are powerful tools for managing financial risk in today’s complex markets. By leveraging options, swaps, dynamic models, and cross-asset strategies, investors and institutions can protect portfolios against adverse movements while maintaining strategic flexibility. However, successful hedging requires deep market knowledge, disciplined execution, and ongoing evaluation. When used thoughtfully, advanced hedging transforms risk from a threat into a manageable and strategic component of long-term financial success.

Premium Chart Patterns Chart patterns are graphical representations of price movements formed over a period of time. They reflect the psychology of buyers and sellers locked in a tug of war, and the outcome often indicates the future direction of the trend.
Chart patterns are categorized into three groups:
Continuation Patterns
Reversal Patterns
Bilateral (Indecision) Patterns

Part 12 Trading Master Class Key Terminologies in Option Trading
1. Strike Price
The price at which the buyer can exercise the option.
2. Premium
The cost paid by the option buyer to the seller for the contract.
3. Expiry
The date when the option contract expires (weekly/monthly).
4. In-the-Money (ITM)
When the option has intrinsic value.
CE is ITM if underlying > strike.
PE is ITM if underlying < strike.
5. Out-of-the-Money (OTM)
When the option has no intrinsic value.
CE is OTM if underlying < strike.
PE is OTM if underlying > strike.
6. Lot Size
Options trade in fixed quantities called lots (e.g., NIFTY lot size = 50).

Turning Market Strength into Consistent Trading OpportunitiesRide the Momentum:
In financial markets, momentum is one of the most powerful forces driving price movement. When prices start moving strongly in one direction, they often continue in that direction longer than most traders expect. The concept of “riding the momentum” is about identifying these strong moves early, entering with confirmation, and staying with the trend until clear signs of weakness appear. This approach is widely used by professional traders because it aligns trading decisions with market psychology, liquidity flow, and institutional behavior.
Understanding Momentum in the Market
Momentum refers to the speed and strength of price movement over a given period. When buyers dominate, prices rise quickly and steadily; when sellers dominate, prices fall with force. Momentum is not random—it is fueled by news, earnings, economic data, sentiment, and large institutional orders. Once a strong move begins, it attracts more participants, creating a self-reinforcing cycle.
Momentum trading does not try to predict tops or bottoms. Instead, it focuses on participating in the middle of the move, where probability and volume are highest. This mindset shift is crucial because many traders lose money trying to catch reversals rather than following strength.
Why Momentum Works So Well
Momentum works because markets are driven by human emotions such as fear, greed, and urgency. When prices rise rapidly, fear of missing out (FOMO) pushes more traders to buy. Similarly, when prices fall sharply, fear accelerates selling. Institutions, hedge funds, and algorithmic traders often build large positions over time, not in a single transaction. Their continuous buying or selling creates sustained momentum.
Another reason momentum strategies succeed is liquidity. Strong moves usually occur in stocks or indices with high volume. This makes entry and exit easier and reduces the risk of slippage. Momentum also reflects market consensus—when everyone agrees on direction, price tends to move smoothly.
Identifying Momentum Early
Successful momentum trading begins with identification. Traders look for clear signs that a stock, index, or asset is entering a strong phase. Common characteristics include higher highs and higher lows in an uptrend, or lower highs and lower lows in a downtrend. Expanding volume is a key confirmation, as it shows real participation behind the move.
Technical tools such as moving averages, Relative Strength Index (RSI), MACD, and price breakouts help spot momentum. A price breaking above a well-defined resistance with strong volume often signals the start of a momentum move. Similarly, a breakdown below strong support can indicate bearish momentum.
Entry Strategies for Riding Momentum
Timing the entry is critical. Entering too early can result in false breakouts, while entering too late reduces reward-to-risk. The best entries usually occur after a small pullback or consolidation within the trend. This allows traders to join momentum at a better price without fighting the overall direction.
For example, in an uptrend, traders may wait for price to pull back to a short-term moving average or previous resistance turned support. When price resumes upward movement with volume, it confirms that momentum is intact. This approach improves accuracy and reduces emotional decision-making.
Staying in the Trade: Letting Winners Run
One of the biggest advantages of momentum trading is the ability to capture large moves. However, many traders exit too early due to fear of losing unrealized profits. Riding momentum requires discipline and trust in the trend. Instead of focusing on small price fluctuations, traders should watch the overall structure and strength of the move.
Trailing stop-losses are commonly used to stay in momentum trades. As price moves in favor of the trade, the stop is gradually adjusted to lock in profits while allowing room for natural pullbacks. This method protects capital without cutting winning trades short.
Risk Management in Momentum Trading
While momentum offers high reward potential, it also carries risk. Strong moves can reverse quickly, especially after extended runs. Proper risk management is essential to survive long-term. Traders should always define risk before entering a trade, using fixed position sizing and stop-loss levels.
A common rule is to risk only a small percentage of capital on each trade. This ensures that even a series of losing trades does not significantly damage the account. Momentum traders also avoid overtrading, focusing only on high-quality setups rather than chasing every move.
Common Mistakes to Avoid
One of the most common mistakes in momentum trading is chasing price after it has already moved too far. Late entries often result in buying near the top or selling near the bottom. Another mistake is ignoring market context. Momentum works best in trending markets; during sideways or low-volatility conditions, momentum signals often fail.
Emotional trading is another major issue. Fear of missing out leads to impulsive entries, while fear of loss causes premature exits. Successful momentum traders follow a predefined plan and remain patient, understanding that not every move needs to be traded.
Momentum Across Different Time Frames
Momentum exists on all time frames, from intraday charts to long-term investments. Day traders may ride momentum for minutes or hours, while swing traders hold positions for days or weeks. Even long-term investors use momentum principles to stay invested in strong sectors or stocks while avoiding weak ones.
The key is consistency. Traders should choose a time frame that matches their personality, capital, and lifestyle, then apply momentum principles consistently within that framework.
The Mindset of a Momentum Trader
Riding the momentum is as much about mindset as it is about strategy. It requires patience to wait for the right setup, confidence to stay in winning trades, and humility to exit when momentum fades. Momentum traders accept that losses are part of the game, but they focus on maximizing gains when the market moves strongly in their favor.
Instead of fighting the market, they move with it. This alignment with market direction reduces stress and increases long-term profitability.
Conclusion
Riding the momentum is a powerful and time-tested trading approach that leverages the natural behavior of financial markets. By focusing on strength, volume, and trend confirmation, traders can participate in high-probability moves with controlled risk. Success in momentum trading comes from discipline, patience, and consistent execution rather than prediction.
When traders learn to respect momentum and let the market lead the way, they shift from reactive decision-making to strategic participation. Over time, this approach builds confidence, consistency, and the ability to capitalize on the market’s most profitable opportunities.
Trade Setup: TITAN (Cash)📈 Trade Setup: TITAN (Cash)
Buy: ₹4005 (Current Market Price)
Stop Loss: ₹3980 (Daily closing basis)
Targets:
🎯 T1: ₹4090
🎯 T2: ₹4190
🔍 Technical Rationale
Price holding above short-term support zone
Higher-low structure intact on daily timeframe
Risk is well-defined (tight SL on closing basis)
Favorable risk–reward toward T1 & T2
⚠️ Risk Management
Exit only if daily candle closes below ₹3980
Partial profit can be booked near ₹4090
Trail stop loss once price sustains above ₹4090
🧠 Trade Type
Short-term swing trade
Time horizon: 3–10 trading sessions

Part 12 Trading Master ClassOption Trading in the Indian Market
In India, the most actively traded options are:
NIFTY
BANKNIFTY
FINNIFTY
SENSEX
Stocks like Reliance, HDFC Bank, TCS, Infosys
Weekly expiries have increased retail participation significantly.

TCS 1 Week Time Frame 📊 Weekly Price Range & Levels
Current share price is trading around ₹3,250–₹3,280 (recent data).
Key Weekly Resistance
R3 / Upper resistance: ~₹3,382–3,383 (stronger barrier)
R2: ~₹3,335
R1: ~₹3,293–3,315 (first hurdle)
Interpretation:
If price breaks above ₹3,315–₹3,335, bulls may aim toward ₹3,380+ this week.
Key Weekly Support
S1: ~₹3,203–₹3,258 (primary support zone)
S2: ~₹3,155–₹3,236
S3: ~₹3,113–₹3,200 (deeper support)
Interpretation:
Holding above ₹3,200–₹3,203 is key for short‑term strength. A break below ₹3,155 could signal weakness and extend the slide.
🟡 Summary Weekly Levels
Level Price Zone (Approx)
Strong Resistance ₹3,350–₹3,382
First Resistance ₹3,293–₹3,315
Current Range ~₹3,250–₹3,280
Support 1 ₹3,203–₹3,258
Support 2 ₹3,155–₹3,236
Support 3 ₹3,113–₹3,200
✅ Trading takeaway:
Short‑term buyers may look for strength above ₹3,315–₹3,335 to target ₹3,380+.
On the downside, watch ₹3,200 — below that, deeper support zones near ₹3,155–₹3,113 come into play.

How Digital Businesses Build Sustainable and Scalable EarningsUnderstanding the Nature of E-Commerce Profits
Unlike traditional brick-and-mortar businesses, e-commerce operates with lower physical infrastructure costs but higher digital and logistics complexity. Profits are derived from the difference between revenue and total costs, which include product sourcing, platform maintenance, marketing, fulfillment, customer service, and technology investments. The key advantage of e-commerce lies in scalability: once systems are built, businesses can increase sales volume without a proportional increase in fixed costs, allowing profit margins to expand over time.
However, this scalability is offset by intense competition and price transparency. Consumers can compare prices instantly, pressuring sellers to operate efficiently. As a result, e-commerce profits depend less on simple markups and more on optimizing the entire value chain—from supplier negotiations to last-mile delivery.
Revenue Drivers in E-Commerce
E-commerce profits begin with strong revenue generation. This is driven by multiple factors, including product selection, pricing strategy, customer acquisition, and repeat purchases. Successful e-commerce companies focus on high-demand products with favorable margins, whether through private labeling, exclusive sourcing, or differentiated offerings.
Pricing strategies play a crucial role. Dynamic pricing, bundling, subscription models, and personalized discounts help maximize revenue per customer. Additionally, increasing average order value through cross-selling and upselling directly improves profitability without increasing marketing costs. Repeat customers are particularly valuable, as the cost of acquiring them is already sunk, making subsequent purchases more profitable.
Cost Structure and Margin Management
Managing costs is central to e-commerce profitability. The main cost components include cost of goods sold (COGS), digital marketing expenses, logistics and fulfillment, platform fees, and customer support. Businesses that can negotiate better supplier terms, source directly from manufacturers, or build strong private brands often enjoy higher gross margins.
Marketing costs are one of the largest challenges. Paid advertising on search engines and social media has become increasingly expensive, compressing margins. Profitable e-commerce businesses balance paid acquisition with organic channels such as search engine optimization (SEO), content marketing, email marketing, and community building. Over time, reducing dependency on paid ads significantly improves net profits.
Logistics efficiency is another major profit lever. Optimizing warehousing, inventory management, packaging, and shipping reduces costs and improves delivery speed, which in turn boosts customer satisfaction and retention. Companies that master supply chain efficiency often outperform competitors even in low-margin categories.
Role of Technology and Data in Profit Optimization
Technology is a powerful driver of e-commerce profits. Advanced analytics help businesses understand customer behavior, forecast demand, manage inventory, and personalize marketing. Data-driven decision-making allows firms to allocate resources more efficiently, reduce waste, and improve conversion rates.
Automation also plays a critical role. Automated order processing, inventory updates, customer support chatbots, and AI-driven recommendations lower operational costs while enhancing the customer experience. As automation increases, profit margins improve due to reduced labor dependency and fewer operational errors.
Customer Lifetime Value and Profit Sustainability
Long-term e-commerce profits depend on maximizing customer lifetime value (CLV). Rather than focusing solely on one-time sales, successful businesses build relationships that encourage repeat purchases and brand loyalty. Loyalty programs, personalized communication, excellent customer service, and consistent product quality all contribute to higher CLV.
Retention-focused strategies are often more profitable than aggressive acquisition campaigns. A small increase in retention rates can lead to a significant rise in profits, as repeat customers typically spend more and require less marketing investment. Sustainable e-commerce profitability is therefore closely tied to trust, brand reputation, and customer experience.
Scaling Profits Through Market Expansion
One of the most attractive aspects of e-commerce is the ability to scale profits by expanding into new markets. Cross-border e-commerce allows businesses to reach global customers without establishing physical stores. While this introduces complexities such as currency management, taxation, and international logistics, the potential profit upside is substantial.
Additionally, expanding product lines, entering adjacent categories, or offering digital products and services can diversify revenue streams and stabilize profits. Many mature e-commerce companies leverage their existing customer base to introduce higher-margin offerings, further enhancing profitability.
Challenges and Risks to E-Commerce Profits
Despite its potential, e-commerce profitability faces several risks. Intense competition can lead to price wars, shrinking margins. Rising customer acquisition costs, increasing logistics expenses, and platform dependency (such as reliance on large marketplaces) can erode profits.
Regulatory changes, data privacy laws, and taxation policies also impact profitability, particularly for cross-border sellers. Cybersecurity risks and operational disruptions can result in financial losses and reputational damage. Profitable e-commerce businesses actively manage these risks through diversification, compliance, and robust technology infrastructure.
Conclusion
E-commerce profits are the result of a complex interplay between revenue growth, cost control, technology adoption, and customer relationship management. While the digital nature of e-commerce enables rapid scaling and global reach, sustained profitability requires strategic discipline and continuous optimization. Businesses that focus on efficient operations, data-driven decisions, strong branding, and long-term customer value are best positioned to generate consistent and growing profits. In an increasingly competitive digital marketplace, e-commerce success is not just about selling more—but about building smarter, leaner, and more resilient profit engines.

PRAENG 1 Day Time Frame 📈 Current Price Snapshot (Intraday)
Current trading price: ~₹26.6 (approx live price) — showing slight upside from prior close.
Today’s intraday range so far: ₹26.35 – ₹26.90.
📊 1-Day Pivot Levels (Today’s Key Levels)
Classic Pivot Points (based on yesterday’s price action):
Level Price
R3 ~₹27.19
R2 ~₹26.59
R1 ~₹26.30
Pivot (PP) ~₹25.70
S1 ~₹25.41
S2 ~₹24.81
S3 ~₹24.52
📌 Bullish bias if price sustains above pivot ~₹25.70.
📌 Bearish continuation if price breaks below S1 ~₹25.41.
📌 Support & Resistance (Intraday)
According to recent technical summaries:
Resistance Levels
R1: ~₹27
R2: ~₹28
R3: ~₹29
Support Levels
S1: ~₹26
S2: ~₹25
S3: ~₹24
👉 Key intraday zone:
Bullish breakout zone: Above ₹27
Bearish trigger zone: Below ₹26
⚠️ How to Use These Levels Today
Bullish view intraday:
Entry above ₹27.00
Next targets at ₹27.50 – ₹28.00
Stop near ₹26.30 (pivot area)
Bearish view intraday:
Break below ₹26.00
Next supports at ₹25.40 / ₹24.80
Stop above ₹26.50
📌 Summary Box
Current price: ~₹26.6 (intraday).
Key pivot: ~₹25.70.
Upside resistances: ~₹27 – ₹28.
Downside supports: ~₹26 – ₹25 – ₹24.
Daily trend: Weak-neutral bias; watch breakout/ breakdown.

Part 2 Master Candle Patterns What Are Options?
Options are derivative instruments, meaning their value is derived from an underlying asset—usually stocks, indices, commodities, or currencies. An option gives the buyer the right, but not the obligation, to buy or sell the underlying asset at a predetermined price before or on a specific date.
There are two types of options:
1. Call Option
A call option gives the buyer the right to buy an asset at a fixed price (known as the strike price) within a certain time (before expiry).
Traders buy call options when they expect the price to rise.
2. Put Option
A put option gives the buyer the right to sell the asset at a fixed price before expiry.
Traders buy put options when they expect the price to fall.

Controlling Trading Risk FactorsA Comprehensive Guide to Long-Term Survival in Financial Markets
Trading in financial markets offers significant opportunities for wealth creation, but it also exposes participants to substantial risks. The difference between consistent traders and those who exit the markets prematurely is not superior prediction, but effective control of trading risk factors. Risk is unavoidable in trading; however, it is manageable. Controlling trading risk factors means identifying, measuring, and mitigating the elements that can negatively impact capital, performance, and psychological stability. This process forms the foundation of professional trading and long-term sustainability.
Understanding Trading Risk
Trading risk refers to the probability of financial loss arising from market uncertainty, volatility, leverage, behavioral errors, and external events. Markets are influenced by countless variables—economic data, geopolitical developments, interest rates, liquidity flows, and investor sentiment. Since traders cannot control market outcomes, the focus must shift to controlling exposure and decision-making processes. Risk control is not about avoiding losses entirely, but about ensuring losses are limited, planned, and recoverable.
Position Sizing: The First Line of Defense
One of the most critical risk factors in trading is improper position sizing. Many traders fail not because their analysis is wrong, but because they risk too much on a single trade. Position sizing determines how much capital is allocated to each trade relative to the total account size. A disciplined approach—such as risking only 1–2% of total capital per trade—ensures that no single loss can significantly damage the account. Proper position sizing smooths the equity curve and allows traders to survive inevitable losing streaks.
Stop-Loss Discipline and Risk-Reward Management
Stop-loss orders are essential tools for controlling downside risk. They define the maximum acceptable loss before entering a trade, transforming uncertainty into a quantified risk. Traders who ignore stop-losses often allow small losses to turn into catastrophic ones. Alongside stop-loss placement, risk-reward ratio plays a vital role. Trades should be structured so that potential rewards outweigh risks, typically at least 1:2 or higher. Even with a modest win rate, favorable risk-reward dynamics can lead to profitability over time.
Managing Leverage Carefully
Leverage amplifies both gains and losses, making it one of the most dangerous risk factors in trading. Excessive leverage can wipe out accounts even with minor market moves. Professional traders treat leverage as a strategic tool, not a shortcut to fast profits. Controlling leverage means using it selectively, understanding margin requirements, and maintaining sufficient buffer to withstand volatility. Lower leverage provides emotional stability and prevents forced liquidations during adverse price movements.
Diversification and Correlation Awareness
Concentration risk arises when too much capital is allocated to highly correlated assets or similar strategies. Traders often believe they are diversified when they are not—for example, holding multiple stocks from the same sector or trades driven by the same macro factor. True diversification considers correlations across instruments, timeframes, and strategies. By spreading risk intelligently, traders reduce the impact of a single market event on overall performance.
Volatility and Market Condition Adaptation
Market volatility is not constant; it expands and contracts over time. Strategies that work well in trending markets may fail in range-bound or highly volatile conditions. Failing to adapt to changing market regimes is a major risk factor. Traders must adjust position sizes, stop distances, and expectations based on current volatility levels. Using tools such as Average True Range (ATR) or volatility indices can help align risk parameters with market conditions.
Psychological Risk and Emotional Control
Psychological factors are among the most underestimated trading risks. Fear, greed, overconfidence, and revenge trading often lead to impulsive decisions that violate risk rules. Emotional trading increases position sizes after losses, removes stop-losses, or leads to overtrading. Controlling psychological risk requires self-awareness, discipline, and routine. Maintaining a trading journal, following a predefined trading plan, and taking breaks after drawdowns are effective ways to reduce emotional interference.
Drawdown Management and Capital Preservation
Drawdowns are inevitable, but uncontrolled drawdowns can permanently impair trading capital. Effective risk control includes predefined drawdown limits, such as reducing position size after a certain percentage loss or pausing trading altogether. Capital preservation should always take priority over profit generation. Traders who protect capital during unfavorable periods are best positioned to capitalize when conditions improve.
Risk of Overtrading and Strategy Drift
Overtrading increases transaction costs, exposure, and emotional fatigue. Many traders feel compelled to trade constantly, mistaking activity for productivity. This behavior often leads to lower-quality setups and higher risk. Similarly, strategy drift—deviating from a proven system due to recent losses or market noise—introduces inconsistency. Strict trade filters and adherence to tested strategies help control these risks.
External and Event-Based Risks
Macroeconomic announcements, earnings releases, geopolitical tensions, and policy decisions can cause sudden price shocks. Ignoring event risk can result in slippage and gaps beyond stop-loss levels. Traders should be aware of economic calendars and adjust exposure ahead of high-impact events. Some choose to reduce position size or stay flat during major announcements, prioritizing risk control over opportunity.
The Role of a Trading Plan and Risk Framework
A well-defined trading plan is the backbone of risk management. It outlines entry criteria, exit rules, position sizing, maximum risk per trade, and drawdown limits. A consistent risk framework transforms trading from speculation into a structured business. Without a plan, risk decisions become reactive and emotionally driven, increasing the likelihood of large losses.
Conclusion
Controlling trading risk factors is not optional—it is the core skill that separates successful traders from unsuccessful ones. Markets are unpredictable, but risk exposure is controllable. By managing position size, leverage, stop-losses, psychological behavior, diversification, and drawdowns, traders create resilience against uncertainty. Long-term success in trading is less about finding the perfect strategy and more about surviving long enough for probabilities to work in your favor. In trading, those who control risk control their future.
