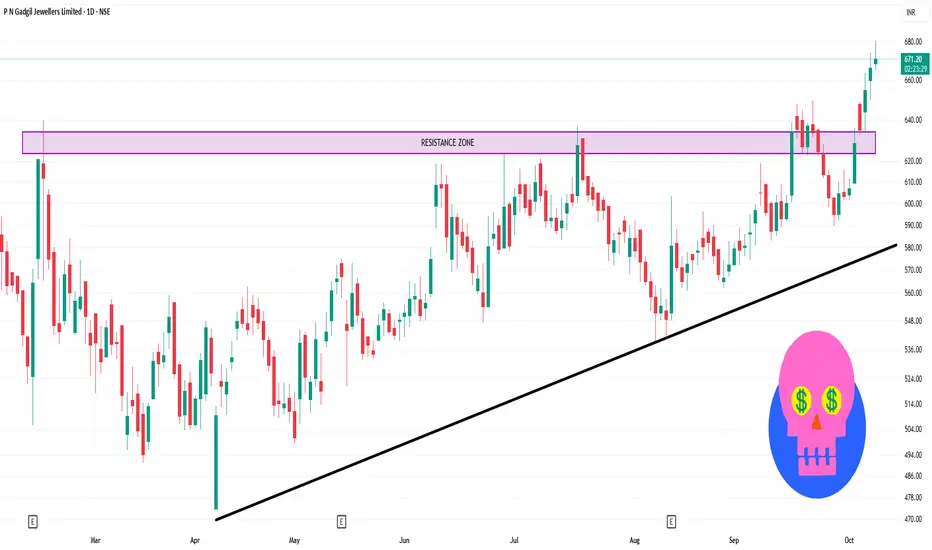
PNGJL 1 Day Time Frame 📈 Intraday Levels (1-Day Time Frame)
Opening Price: ₹668.50
Day’s Range: ₹665.10 – ₹680.65
VWAP (Volume-Weighted Average Price): ₹671.71
Previous Close: ₹666.45
Upper Circuit Limit: ₹733.05
Lower Circuit Limit: ₹599.80
🔧 Technical Indicators
Pivot Points: Classic Pivot Point at ₹663.48, with resistance levels at ₹672.61 (R1) and ₹687.38 (R2). Support levels are at ₹653.02 (S1) and ₹639.58 (S2).
Technical Analysis: The stock is currently in a "Strong Buy" position based on daily analysis, with 9 buy signals and 0 sell signals.
📊 Summary
P N Gadgil Jewellers Ltd is exhibiting a strong bullish trend on the 1-day time frame, with the stock trading above key pivot points and technical indicators signaling upward momentum. The stock has shown resilience, maintaining its position above ₹670.00 throughout the trading session.
For intraday traders, monitoring the resistance levels at ₹672.61 and ₹687.38 could provide insights into potential price targets, while support levels at ₹653.02 and ₹639.58 may act as indicators for possible pullbacks.
Trade
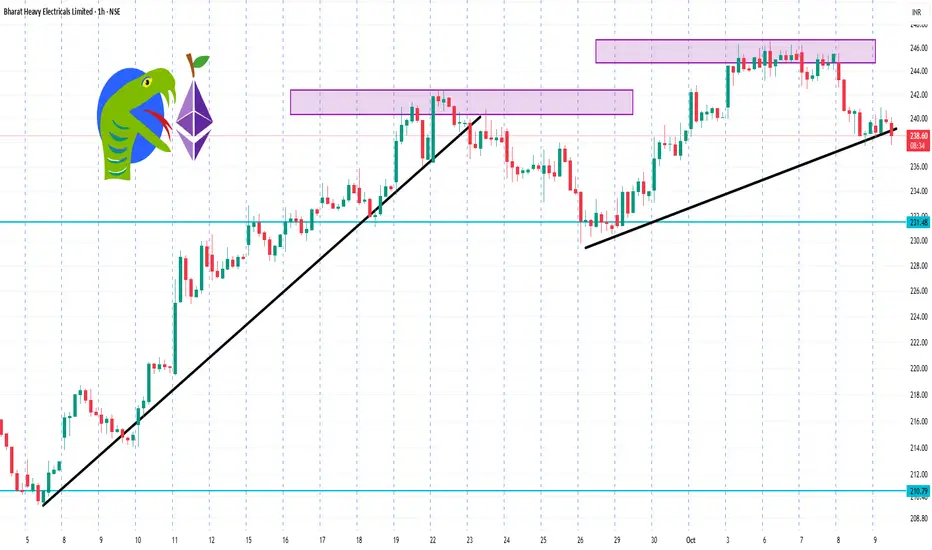
BHEL 1 Hour Time Frame 📉 1-Hour Technical Analysis Summary
Overall Signal: Strong Sell
Relative Strength Index (RSI): 41.43 — approaching oversold territory
MACD: -0.58 — indicating downward momentum
Stochastic Oscillator: 21.78 — confirming bearish bias
Average Directional Index (ADX): 54.36 — suggesting a strong trend
Williams %R: -76.66 — indicating oversold conditions
Commodity Channel Index (CCI): -68.24 — supporting bearish outlook
Pivot Levels:
Support: S1 = ₹238.45
Resistance: R1 = ₹240.85
These indicators collectively suggest a continuation of the current downtrend.
🔍 Key Price Levels
Intraday Support: ₹236.19
Intraday Resistance: ₹243.64
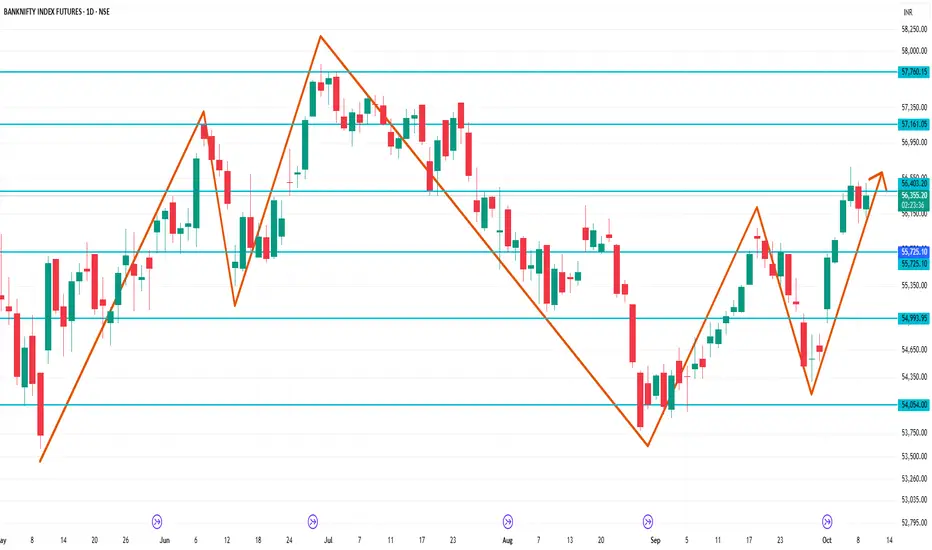
BankNifty 1 Day Time Frame 📊 1-Day Timeframe Technical Analysis
Current Price: ₹56,204.60
Day's Range: ₹55,843.90 – ₹56,286.25
52-Week Range: ₹47,702.90 – ₹57,628.40
Year-to-Date Return: +10.39%
1-Month Return: +3.56%
🔧 Technical Indicators
Trend: Neutral
Resistance Levels: ₹56,230 (immediate), ₹56,600 (stronger)
Support Levels: ₹55,843
Technical Rating: Neutral
📈 Market Outlook
The Bank Nifty Futures are currently trading within a rising wedge pattern, indicating consolidation with potential for reversal. Immediate resistance is observed around ₹56,230, which may act as a strong supply zone leading to potential selling pressure. A decisive breakout above ₹56,600 would turn the outlook bullish.
Trading Gold and Cryptocurrency in the Indian Market1. Overview of Gold Trading in India
Gold has deep cultural and economic significance in India. It is widely used in jewelry, savings, and investment, making India one of the largest consumers of gold globally.
1.1 Forms of Gold Investment
In India, gold trading occurs in several forms:
Physical Gold – Jewelry, coins, and bars.
Gold ETFs (Exchange-Traded Funds) – Allow investors to buy units representing gold without physically holding it.
Sovereign Gold Bonds (SGBs) – Issued by the Reserve Bank of India (RBI), providing interest along with appreciation in gold price.
Futures and Options – Traded on the Multi Commodity Exchange (MCX), providing leveraged exposure.
1.2 Gold Trading Mechanics
Gold trading in India, especially in the futures market, involves contracts with standard weights (1 kg, 100 grams, etc.). Prices fluctuate based on domestic demand, international gold prices, USD/INR exchange rates, and geopolitical tensions. Traders can go long (buy) or short (sell), using leverage to maximize returns, though this increases risk.
1.3 Strategies in Gold Trading
Trend Trading: Identifying upward or downward trends in international or domestic gold prices and trading accordingly.
Hedging: Using gold futures to protect portfolios from inflation or currency depreciation.
Arbitrage: Exploiting price differences between spot markets, ETFs, and futures.
1.4 Risks and Considerations
Gold is influenced by global market volatility.
Leverage can magnify losses.
Liquidity in physical gold is higher, but online platforms provide faster execution.
2. Overview of Cryptocurrency Trading in India
Cryptocurrency trading in India is still evolving. Cryptos are digital or virtual currencies that operate on blockchain technology. The most popular are Bitcoin (BTC), Ethereum (ETH), Ripple (XRP), and several altcoins.
2.1 Cryptocurrency Market in India
India has seen explosive growth in cryptocurrency adoption over the last few years. Exchanges like WazirX, CoinDCX, and ZebPay provide platforms for trading Bitcoin and other digital assets. Trading can occur in:
Spot Market: Buying and selling cryptocurrencies at current market prices.
Futures Market: Contracts allowing traders to speculate on future prices.
Margin Trading: Trading using borrowed funds to amplify gains (and risks).
2.2 Regulatory Landscape
Cryptocurrency regulations in India remain in flux:
RBI Restrictions: Previously, banks were restricted from providing services to crypto exchanges, but this has eased after Supreme Court intervention.
Taxation: Cryptocurrency gains are taxed at 30%, with a 1% TDS on transactions above a certain threshold.
Legal Status: Cryptos are legal to trade but not recognized as legal tender.
2.3 Strategies for Crypto Trading
Day Trading: Taking advantage of intraday volatility to make profits.
Swing Trading: Capitalizing on medium-term trends lasting days or weeks.
HODLing: Long-term holding based on belief in price appreciation.
Arbitrage: Exploiting price differences across exchanges.
2.4 Risks and Considerations
Cryptocurrencies are highly volatile; prices can swing 10-20% within hours.
Exchanges may face liquidity or security issues.
Regulatory changes can significantly impact prices.
3. Trading Platforms in India
3.1 Gold Trading Platforms
MCX (Multi Commodity Exchange): Futures and options.
Stock Broker Platforms: Zerodha, Upstox, ICICI Direct provide access to ETFs and SGBs.
Banks and Post Offices: For Sovereign Gold Bonds and physical gold.
3.2 Crypto Trading Platforms
WazirX: Popular for beginners with simple UI.
CoinDCX: Offers derivatives trading and margin facilities.
ZebPay: Secure platform with various coins available.
International Platforms: Binance and Kraken for Indian residents (with caution on regulations).
4. Technical and Fundamental Analysis
4.1 Gold
Technical Analysis: Uses price charts, trendlines, moving averages, and RSI to predict price movements.
Fundamental Analysis: Considers inflation rates, global demand, central bank policies, and geopolitical events.
4.2 Cryptocurrency
Technical Analysis: Chart patterns, candlestick formations, MACD, Bollinger Bands, and volume analysis.
Fundamental Analysis: Blockchain adoption, regulatory news, network updates, and market sentiment.
5. Risk Management
5.1 Gold
Diversify between physical gold, ETFs, and futures.
Limit leverage to avoid margin calls.
Monitor global gold prices and USD/INR movements.
5.2 Cryptocurrency
Trade only with capital you can afford to lose.
Use stop-loss orders to minimize losses.
Keep funds in secure wallets rather than exchanges for long-term holding.
Diversify across coins to spread risk.
6. Future Outlook
6.1 Gold
Gold will remain a core part of Indian investment due to cultural affinity and inflation hedging.
Global uncertainties, such as currency devaluation or geopolitical tensions, can drive prices higher.
6.2 Cryptocurrency
Adoption is expected to rise as digital literacy grows.
Regulations will play a pivotal role in shaping market stability.
Potential for blockchain-based applications beyond trading, including NFTs, DeFi, and metaverse assets.
Conclusion
Trading gold and cryptocurrencies in India offers unique opportunities for portfolio diversification. Gold provides stability and hedging against inflation, while cryptocurrencies offer potential high returns at higher risk. Success in both markets requires understanding the instruments, staying updated with global and domestic trends, employing technical and fundamental analysis, and practicing disciplined risk management.
Indian traders now have access to sophisticated platforms and instruments that enable both short-term speculation and long-term investment. Combining gold and cryptocurrencies strategically can help investors achieve a balance of security, growth, and speculative gains, ensuring a resilient and profitable portfolio in a rapidly evolving financial landscape.

Scalping Bank Nifty: Strategies, Techniques, and Risk Management1. Understanding Bank Nifty
Bank Nifty is the Nifty Bank Index, representing the 12 most liquid and large-cap banking stocks listed on the NSE. Its movements are heavily influenced by:
RBI monetary policies
Inflation data
Interest rate changes
Banking sector earnings and news
Global financial market movements
Because of its volatility, Bank Nifty is ideal for intraday trading strategies like scalping. It typically moves in a wide price range within a trading day, offering multiple opportunities for profit if trades are executed correctly.
2. Basics of Scalping
Scalping focuses on small, frequent gains rather than holding positions for long-term appreciation. Key elements of scalping include:
Timeframe: Usually 1-minute, 3-minute, or 5-minute charts.
Trade duration: Seconds to a few minutes.
Target profit per trade: Often between 10–50 points in Bank Nifty.
Stop loss: Tight stops, often 5–20 points.
The goal is consistency rather than large single-trade profits. Scalping thrives on high liquidity and minimal spreads, both characteristics of Bank Nifty.
3. Key Tools and Indicators for Scalping Bank Nifty
Successful scalpers rely on a combination of technical indicators, market analysis tools, and chart patterns:
a. Moving Averages (MA):
5 EMA and 20 EMA are commonly used.
Buy signals occur when the short-term EMA crosses above the long-term EMA, and sell signals occur on the reverse.
b. Bollinger Bands:
Identify overbought and oversold conditions.
Scalpers can enter trades when price touches the lower or upper band and exits when it reverts to the mean.
c. Relative Strength Index (RSI):
Measures momentum; scalpers often use 14-period RSI on 1-minute charts.
Overbought >70, Oversold <30 signals help time entry and exit.
d. MACD (Moving Average Convergence Divergence):
Detects trend direction and momentum.
Quick crossovers of MACD line over signal line provide short-term trade opportunities.
e. Market Depth & Order Flow:
Scalpers monitor the live bid-ask spread to anticipate price moves.
Large orders or imbalances can indicate short-term reversals or breakouts.
4. Scalping Strategies for Bank Nifty
Several popular strategies exist for intraday scalping:
a. Trend-Following Scalping:
Enter trades in the direction of the short-term trend.
Use EMAs or moving averages to confirm trend.
b. Range-Bound Scalping:
Works during low volatility sessions.
Identify support and resistance levels and trade bounces between them.
c. Breakout Scalping:
Exploit sudden price moves when Bank Nifty breaks key intraday levels.
Confirm breakout with volume and momentum indicators.
d. News-Based Scalping:
Intraday trades triggered by economic news or RBI announcements.
Requires rapid execution and awareness of market-moving events.
5. Risk Management in Scalping
Because scalping involves frequent trades with tight stops, risk management is critical:
Capital Allocation: Never risk more than 1–2% of capital per trade.
Stop Loss: Always predefine and strictly follow.
Trade Frequency: Avoid overtrading; quality over quantity.
Exit Strategy: Know your target points and exit at predefined levels.
Psychological Discipline: Avoid emotional trading, as rapid losses can compound quickly.
6. Choosing the Right Brokerage and Platform
Scalping demands low-latency platforms with fast order execution. Key features include:
Real-time market data
Minimal lag and downtime
Advanced charting tools
Direct market access (DMA) for speed
Popular brokers for Bank Nifty scalping include Zerodha Kite, Upstox Pro, Angel Broking, and ICICI Direct.
7. Common Mistakes in Bank Nifty Scalping
Overleveraging positions
Ignoring market news
Trading against the trend
Holding losing trades for too long
Lack of predefined entry and exit rules
Learning from mistakes is essential for long-term profitability. Scalping requires a combination of skill, discipline, and constant market awareness.
8. Psychological and Emotional Aspects
Scalping is mentally demanding:
Constant attention to charts
Quick decision-making under pressure
Managing stress from rapid wins and losses
Successful scalpers often take breaks between sessions and maintain a trading journal to analyze performance.
9. Backtesting and Practice
Before trading live, scalpers should:
Backtest strategies on historical Bank Nifty data
Use paper trading or demo accounts
Track performance metrics such as win rate, average profit/loss, and drawdown
10. Conclusion
Scalping Bank Nifty can be highly profitable, but it demands skill, discipline, and the right tools. By combining technical analysis, market awareness, and strict risk management, traders can capitalize on short-term price movements while minimizing losses. Scalping is not suitable for everyone—it requires dedication, focus, and the mental fortitude to handle rapid market changes.
When executed correctly, Bank Nifty scalping can become a consistent source of intraday profits, leveraging India’s most liquid index for high-frequency trading opportunities.
Advanced Option Strategies1. Understanding Advanced Option Strategies
Advanced option strategies involve combining multiple option positions in ways that optimize outcomes for specific market scenarios. Unlike straightforward buying or selling of single options, these strategies use combinations of calls, puts, or both, sometimes with different strike prices and expiration dates, to achieve nuanced profit/loss structures.
Traders use these strategies for several reasons:
Hedging: Protect existing portfolios against adverse price movements.
Speculation: Take calculated bets on the direction, volatility, or timing of price movements.
Income Generation: Earn premiums through selling options while controlling risk.
Volatility Trading: Profit from changes in implied volatility rather than price direction alone.
To successfully implement advanced option strategies, traders must have a deep understanding of option Greeks (Delta, Gamma, Theta, Vega, and Rho), as these metrics determine how option prices react to market movements.
2. Popular Advanced Option Strategies
2.1 Spreads
Spreads involve buying and selling options of the same type (calls or puts) on the same underlying asset but with different strike prices or expiration dates. Spreads can be broadly categorized into vertical spreads, horizontal spreads, and diagonal spreads.
2.1.1 Vertical Spreads
Vertical spreads involve buying and selling options with the same expiration date but different strike prices. They can be bullish or bearish.
Bull Call Spread: Buy a call at a lower strike and sell a call at a higher strike. This strategy limits both profit and loss and is profitable if the stock price rises moderately.
Bear Put Spread: Buy a put at a higher strike and sell a put at a lower strike. Profitable if the underlying declines moderately.
Example: A stock trading at $100:
Buy 1 call at $100 strike for $5
Sell 1 call at $110 strike for $2
Net cost: $3, Maximum gain: $7, Maximum loss: $3
2.1.2 Horizontal (Time) Spreads
Also called calendar spreads, horizontal spreads involve options with the same strike price but different expiration dates.
Long Calendar Spread: Buy a long-dated option and sell a short-dated option at the same strike. This strategy profits from low volatility and time decay.
2.1.3 Diagonal Spreads
A combination of vertical and horizontal spreads, diagonal spreads involve options with different strikes and expiration dates. These allow traders to take advantage of both time decay and directional moves.
2.2 Straddles and Strangles
These strategies are designed to profit from volatility, regardless of price direction.
2.2.1 Straddle
A straddle involves buying a call and a put at the same strike price and expiration date. Traders use straddles when they expect significant price movement but are unsure of the direction.
Pros: Unlimited profit potential if the underlying makes a large move.
Cons: High cost due to purchasing two options, risk of losing premium if the price remains stable.
2.2.2 Strangle
A strangle is similar to a straddle but uses out-of-the-money options. This makes it cheaper but requires a bigger price movement to be profitable.
Example: Stock at $100:
Buy 1 OTM call at $105
Buy 1 OTM put at $95
Outcome: Profitable if the stock moves significantly beyond $105 or below $95.
2.3 Butterfly Spreads
Butterfly spreads are limited-risk, limited-reward strategies that involve three strike prices. The most common is the call butterfly spread:
Buy 1 call at lower strike
Sell 2 calls at middle strike
Buy 1 call at higher strike
This strategy profits if the underlying price remains near the middle strike at expiration. Variants include put butterflies and iron butterflies.
Iron Butterfly: Combines a call and put spread, offering a strategy that benefits from low volatility with defined risk and reward.
2.4 Condors
Condor strategies, like butterflies, involve four strikes and aim to profit from a narrow price range.
Iron Condor: Sell an OTM put and OTM call, and buy further OTM put and call to limit risk.
Pros: Generates income in low volatility markets.
Cons: Limited profit, requires precise range predictions.
2.5 Ratio Spreads
Ratio spreads involve buying and selling options in unequal quantities. For instance, a trader might buy 1 call and sell 2 calls at a higher strike.
Pros: Can generate credit upfront, benefit from moderate moves.
Cons: Unlimited risk if the underlying moves sharply beyond the sold options.
2.6 Backspreads
Backspreads are the opposite of ratio spreads: they involve selling fewer options and buying more further out-of-the-money options. Traders use them when expecting large moves in the underlying asset.
Example: Sell 1 ATM call, buy 2 OTM calls.
Outcome: Profitable if the stock surges, limited risk if the stock drops slightly.
2.7 Synthetic Positions
Synthetic strategies replicate the payoff of holding the underlying asset using options:
Synthetic Long Stock: Buy a call and sell a put at the same strike and expiration.
Synthetic Short Stock: Sell a call and buy a put.
These strategies allow traders to gain exposure to price movements without actually holding the underlying stock.
2.8 Box Spread
A box spread is a combination of a bull call spread and a bear put spread, effectively creating a riskless arbitrage if executed correctly.
Profit/Loss: The spread’s value converges to the difference between strikes at expiration, usually used by professional traders for interest rate arbitrage.
3. Practical Considerations
Advanced option strategies require careful planning and risk management. Key considerations include:
Volatility: High implied volatility increases option premiums, affecting the profitability of debit vs. credit strategies.
Time Decay (Theta): Strategies like calendar spreads benefit from time decay, while long options lose value as expiration approaches.
Liquidity: Illiquid options can have wide bid-ask spreads, increasing execution costs.
Greeks Management: Understanding Delta, Gamma, Vega, and Theta is critical for predicting how positions respond to market changes.
Margin Requirements: Complex strategies, especially those with naked positions, may require significant margin.
4. Risk Management
Even advanced strategies carry risks. Techniques to manage risk include:
Diversification: Avoid putting all capital into a single underlying or strategy.
Stop-Loss Orders: Predefined exit points can prevent large losses.
Position Sizing: Limit exposure per trade to a fraction of the total portfolio.
Adjustments: Rolling or converting positions can mitigate adverse movements.
5. Advantages of Advanced Option Strategies
Flexibility: Traders can structure strategies for bullish, bearish, or neutral market conditions.
Defined Risk: Many strategies offer limited-risk exposure compared to outright positions in the underlying asset.
Profit from Volatility: Traders can earn profits even in sideways markets.
Portfolio Hedging: Protects against large moves without selling assets.
6. Challenges and Limitations
Complexity: Understanding multiple legs, Greeks, and expiration cycles can be challenging.
Execution Costs: Commissions and slippage can reduce profits.
Market Timing: Many strategies require precise timing and predictions.
Psychological Pressure: Multi-leg trades can be stressful and require constant monitoring.
7. Conclusion
Advanced option strategies offer traders sophisticated tools to manage risk, speculate on price movements, and generate income. From spreads and straddles to butterflies and synthetic positions, each strategy has unique characteristics suited for different market conditions. Success in these strategies requires a thorough understanding of option pricing, Greeks, volatility, and risk management techniques. While the rewards can be substantial, the complexity and risks demand disciplined execution, continual learning, and practice.
For traders willing to invest the time in mastering these strategies, options provide a versatile framework to navigate today’s dynamic markets and optimize portfolio performance.
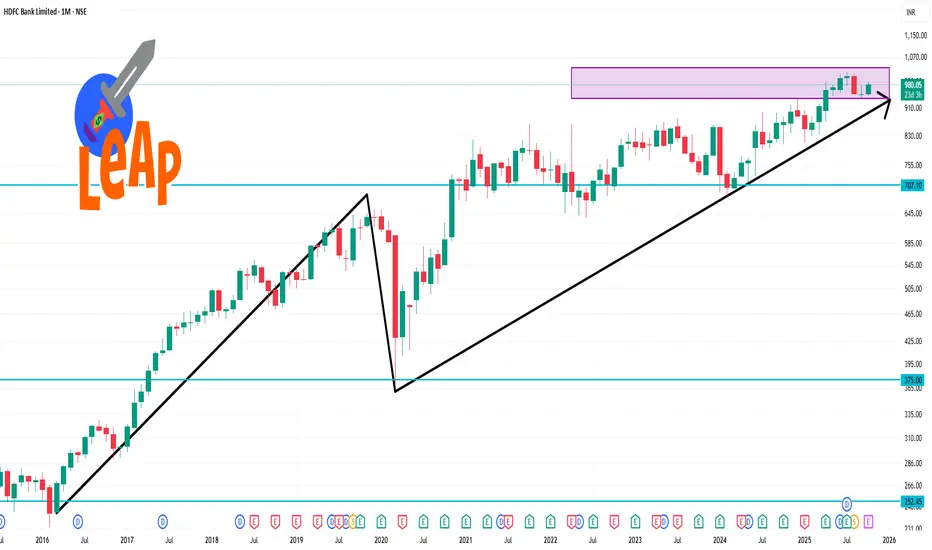
HDFCBANK 1 Month Time Frame 📊 1-Month Technical Outlook
Technical Rating: Strong Buy
Pivot Points:
Classic: Pivot: ₹960.28 | Support: ₹937.03, ₹951.12 | Resistance: ₹974.37, ₹983.53, ₹997.62
Fibonacci: Pivot: ₹960.28 | Support: ₹945.91, ₹951.40 | Resistance: ₹974.65, ₹983.53
Camarilla: Pivot: ₹961.30 | Support: ₹961.09, ₹963.80 | Resistance: ₹967.85, ₹969.21
Moving Averages:
Short-Term (MA5, MA10, MA20): Buy
Medium-Term (MA50): Sell
Long-Term (MA100, MA200): Buy
Relative Strength Index (RSI): 50.54 (Neutral)
MACD: -4.82 (Sell)
Average True Range (ATR): 13.27 (Moderate Volatility)
ADX (Trend Strength): 19.12 (Weak Trend)
Williams %R: -36.70 (Buy)
Commodity Channel Index (CCI): -13.66 (Neutral)
Rate of Change (ROC): -0.22 (Sell)
🔍 Summary
HDFC Bank's stock shows a bullish trend over the past month, with positive technical indicators and a strong buy signal. However, the neutral RSI and sell signal from the MACD suggest caution. Investors should monitor these indicators closely for potential shifts in market sentiment.
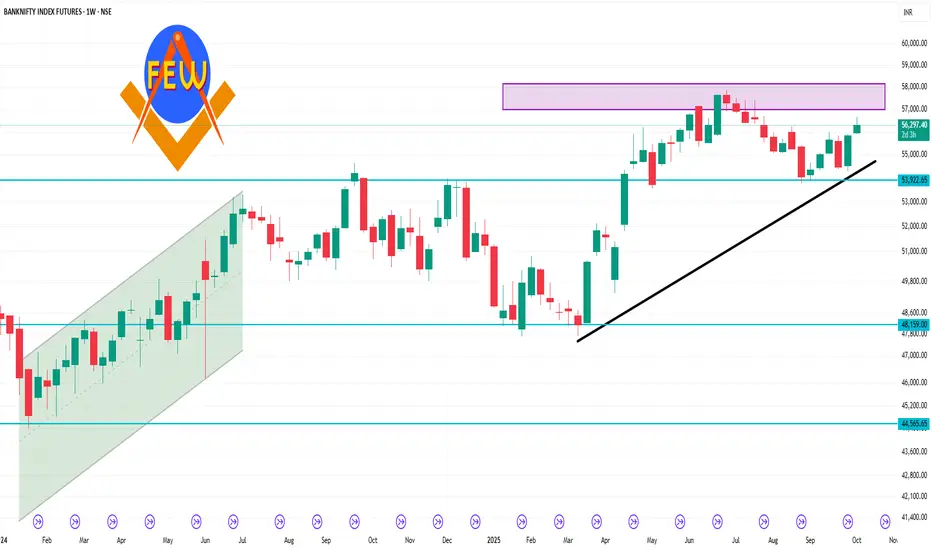
Banknifty 1 Week Time Frame 📊 Current Technical Snapshot
Spot Level: Approximately 55,900
Trend: Neutral to slightly bullish
Support Levels: 55,531; 55,778; 56,009
Resistance Levels: 56,486; 56,733; 56,964
🔍 Key Observations
Consolidation Zone: The Bank Nifty is trading within a defined range, with immediate support near 55,850–55,750 and resistance around 56,650–56,750. A breakout above 56,800 could target 57,000.
Bullish Bias: Sustaining above the 56,000 level may lead to a rally towards the 56,500–56,800 zone, followed by 57,000.
Rising Wedge Pattern: The index is forming a rising wedge, indicating potential consolidation with a chance of reversal. Immediate resistance lies around the 56,400 level, with a strong supply zone leading to potential reversal or selling pressure. A decisive breakout above 56,600 would turn bullish.
📈 Weekly Outlook (October 8–10, 2025)
Bullish Scenario: A breakout above 56,800 could target 57,000, with further upside potential.
Bearish Scenario: Failure to hold above 55,750 may lead to a decline towards 55,500 or lower.
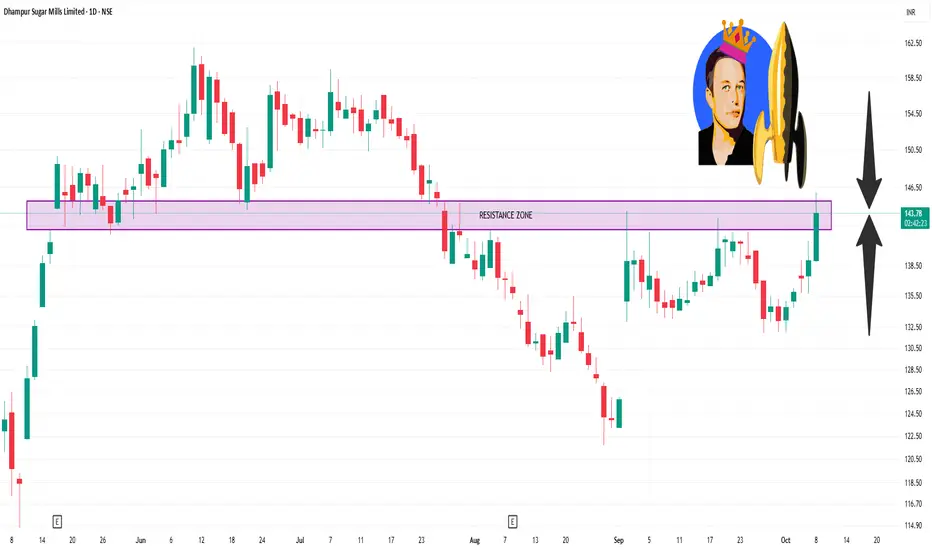
DHAMPURSUG 1 Day Time Frame 📊 Intraday Support & Resistance Levels
Based on recent technical analyses, here are the key levels for intraday trading:
Resistance Levels:
R1: ₹141.44
R2: ₹143.87
R3: ₹146.74
Support Levels:
S1: ₹136.14
S2: ₹133.27
S3: ₹130.84
These levels are derived from the Classic pivot point method and are calculated based on the price range of the previous trading day.
🔄 Pivot Points
The pivot point for today is ₹138.57, with variations in resistance and support levels across different methods:
Classic Pivot Point:
Pivot: ₹138.57
Resistance: ₹141.44, ₹143.87, ₹146.74
Support: ₹136.14, ₹133.27, ₹130.84
Fibonacci Pivot Point:
Pivot: ₹138.57
Resistance: ₹140.59, ₹141.84, ₹143.87
Support: ₹136.54, ₹135.29, ₹133.27
Camarilla Pivot Point:
Pivot: ₹138.57
Resistance: ₹139.51, ₹139.99, ₹140.48
Support: ₹138.53, ₹138.05, ₹137.56
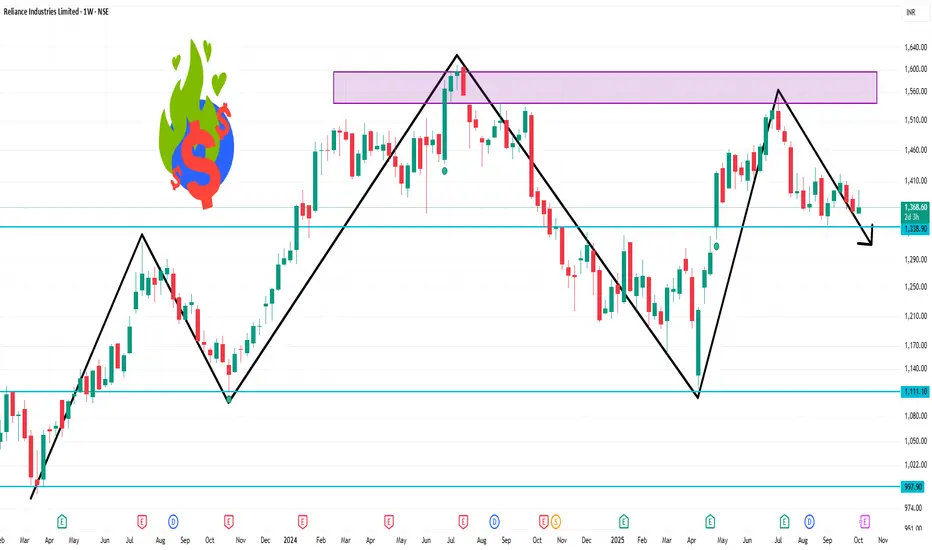
RELIANCE 1 Week Time Frame 📊 Weekly Technical Outlook
Overall Trend: The prevailing trend is bearish, with a "Strong Sell" signal on the weekly timeframe.
Moving Averages: All key moving averages—5-day, 10-day, 20-day, 50-day, 100-day, and 200-day—are indicating a "Sell" signal.
Relative Strength Index (RSI): The RSI is at 44.99, suggesting the stock is neither overbought nor oversold but leans towards a bearish stance.
MACD: The Moving Average Convergence Divergence (MACD) is positive at 1.73, indicating potential upward momentum.
🔧 Key Support & Resistance Levels
Weekly Pivot Point: ₹1,369.77
Support Levels: ₹1,318.43, ₹1,337.67
Resistance Levels: ₹1,401.87, ₹1,414.73
🔍 Additional Indicators
Technical Summary: The stock is rated as a "Strong Sell" based on moving averages and technical indicators.
Pivot Analysis: Current price is trading below the weekly pivot point, indicating a bearish short-term outlook.
📈 Conclusion
Reliance Industries Ltd is currently in a bearish phase on the weekly chart, with all major moving averages signaling a "Sell." While the MACD suggests some potential for upward movement, the overall technical indicators and pivot analysis point towards caution. Traders should monitor the support levels closely; a break below ₹1,318.43 could lead to further downside.
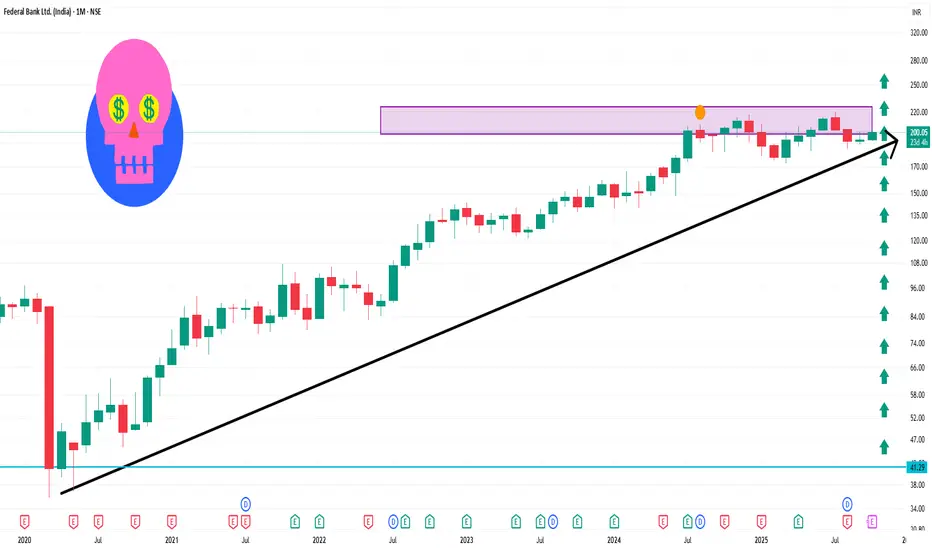
FEDERALBNK 1 Month Time Frame📊 Current Market Snapshot
Current Price: ₹199.99
Day Range: ₹199.68 – ₹202.46
52-Week Range: ₹172.66 – ₹220.00
Volume: 3,014,015 shares traded
📈 Analyst Price Forecast (1-Month Outlook)
Average Target: ₹224.37
High Estimate: ₹265.00
Low Estimate: ₹165.00
📉 Technical Indicators
Overall Sentiment: Mixed (Bearish: 9, Neutral: 3, Bullish: 3)
Moving Averages: Bearish
Oscillators: Bearish
Pivot Points: Neutral
📰 Recent Financial Performance
Q1 FY2025: Net profit declined by 15% to ₹862 crore, attributed to higher provisions, despite a 2% increase in Net Interest Income (NII)
✅ Summary
Current Price: ₹199.99
1-Month Target Range: ₹165 – ₹265
Technical Indicators: Mixed, with a bearish short-term outlook
Recent Performance: Profit decline due to increased provisions
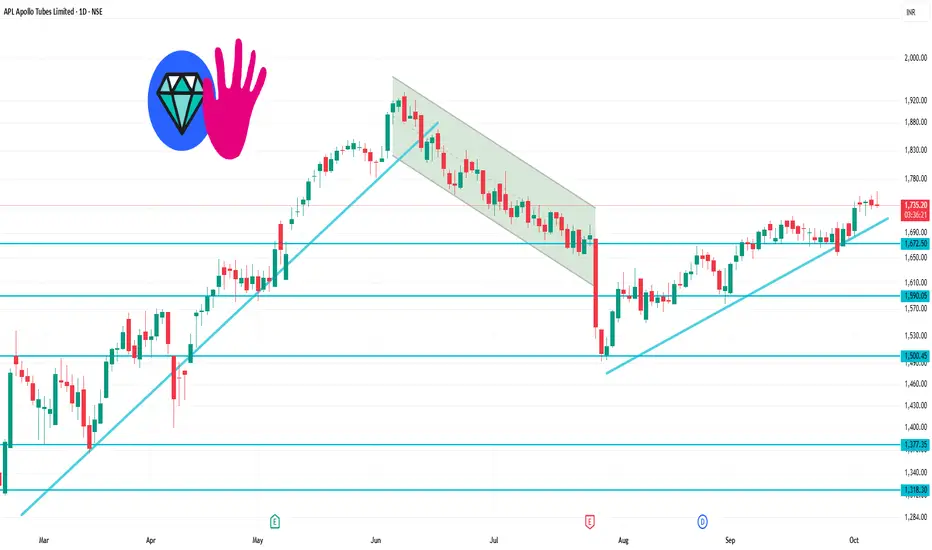
APLAPOLLO 1 Day Time Frame📊 Intraday Support & Resistance Levels
Immediate Support Levels: ₹1,717.57 and ₹1,733.63
Immediate Resistance Levels: ₹1,764.6 and ₹1,764.6
📈 Pivot Points
Standard Pivot Point: ₹1,749.57
Camarilla R3: ₹1,742.82
Fibonacci Resistance: ₹1,748.19
📉 Technical Indicators
Overall Technical Strength: Strong Buy
Moving Averages: Bullish
Oscillators: Bullish
🔮 Trend Outlook
The stock is trading above key support levels, indicating a potential continuation of the upward trend. However, it's essential to monitor for any signs of reversal or consolidation near resistance levels.
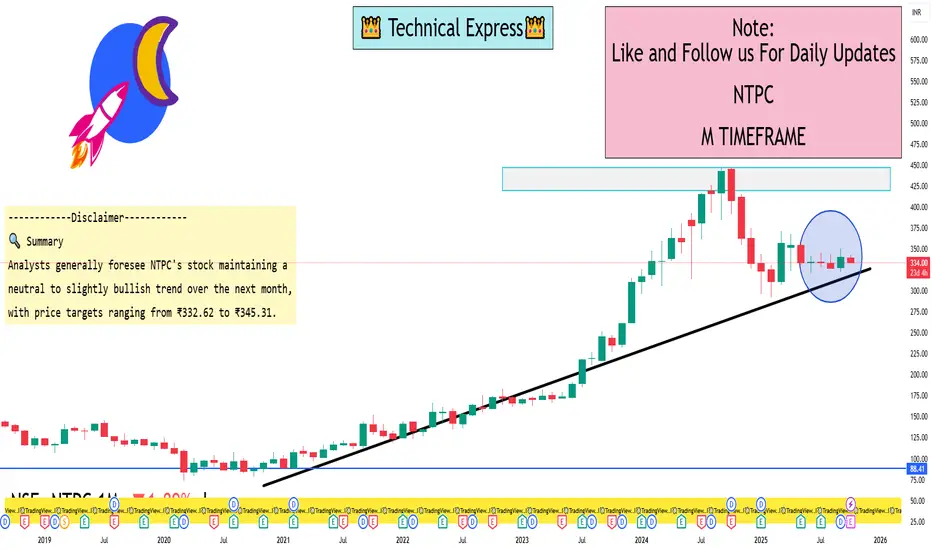
NTPC 1 Month View📊 1-Month Price Targets & Forecasts
WalletInvestor: Projects a price range of ₹332.62 to ₹345.31 within the next 14 days, with a potential upside to ₹416.02 over the next year.
MunafaSutra: Identifies immediate support at ₹326.63 and resistance at ₹338.93, suggesting a sideways trading range.
StockInvest.us: Anticipates NTPC's stock to trade between ₹319.95 and ₹343.83 over the next 3 months, indicating a neutral trend.
🔍 Summary
Analysts generally foresee NTPC's stock maintaining a neutral to slightly bullish trend over the next month, with price targets ranging from ₹332.62 to ₹345.31. The consensus suggests potential upside, but the stock may experience fluctuations within this range.
Intraday Trading vs Swing TradingIntroduction
Brief overview of trading in financial markets.
Importance of choosing the right trading style for profitability and risk management.
Statement of purpose: Compare intraday trading and swing trading across multiple dimensions such as time horizon, risk, capital requirements, strategy, and psychology.
1. Understanding Intraday Trading
1.1 Definition
Buying and selling financial instruments within the same trading day.
Positions are squared off before the market closes.
1.2 Characteristics
Short-term focus (minutes to hours).
High trade frequency.
Requires constant market monitoring.
1.3 Tools & Techniques
Technical indicators: RSI, MACD, moving averages, Bollinger Bands.
Chart patterns: Flags, triangles, head & shoulders.
Level 2 data, real-time market depth.
1.4 Advantages
Potential for high profits in a single day.
No overnight risk exposure.
Quick capital turnover.
1.5 Disadvantages
High stress due to rapid decision-making.
Significant brokerage and transaction costs.
Requires advanced knowledge and quick reflexes.
2. Understanding Swing Trading
2.1 Definition
Holding positions for several days to weeks to capture medium-term price movements.
2.2 Characteristics
Medium-term focus.
Fewer trades but larger profit potential per trade.
Less time-intensive compared to intraday trading.
2.3 Tools & Techniques
Technical analysis: Trendlines, support/resistance, moving averages.
Fundamental analysis: Earnings reports, sector trends, macroeconomic indicators.
Swing patterns: Breakouts, pullbacks, reversals.
2.4 Advantages
Less stressful than intraday trading.
More time to analyze and make informed decisions.
Lower transaction costs due to fewer trades.
2.5 Disadvantages
Exposure to overnight and weekend risks.
Capital is tied up longer.
Requires patience and disciplined risk management.
3. Time Horizon and Trading Frequency
Intraday: Trades last minutes to hours; multiple trades daily.
Swing: Trades last days to weeks; limited trades but larger exposure.
Impact on lifestyle: Intraday requires active screen time; swing allows more flexibility.
4. Capital Requirements
Intraday: Leverage is often used; margin requirements are smaller but risk is higher.
Swing: Requires more capital per trade due to longer holding periods and lower leverage.
Risk of capital erosion: Intraday mistakes can wipe out a day’s gains; swing mistakes can impact several days of profit potential.
5. Risk and Reward Dynamics
Intraday: High volatility can yield high rewards but also steep losses.
Swing: Moderate volatility, potential for larger cumulative gains, but exposure to overnight gaps.
Risk management strategies: Stop-loss orders, position sizing, diversification.
6. Trading Psychology
Intraday:
Requires quick decision-making and mental resilience.
Emotional discipline is crucial; fear and greed can destroy profits quickly.
Swing:
Patience is essential to ride trends.
Ability to handle temporary drawdowns without panic-selling.
7. Strategy and Analysis
Intraday Trading Strategies:
Scalping: Quick small gains.
Momentum trading: Riding strong price trends within the day.
Swing Trading Strategies:
Trend-following: Entering trades along prevailing trends.
Reversal trading: Buying dips and selling rallies.
Technical vs fundamental analysis balance: Swing trading often incorporates both; intraday is heavily technical.
8. Costs and Tax Implications
Intraday:
Higher brokerage and STT due to frequent trades.
Short-term gains taxed differently depending on jurisdiction.
Swing:
Lower trading costs.
Gains may qualify for medium/long-term capital gains benefits.
9. Suitability for Different Traders
Intraday: Best for active, risk-tolerant, experienced traders with fast decision-making skills.
Swing: Suitable for part-time traders, working professionals, and those seeking less stressful trading.
10. Technology and Tools
Intraday: Real-time charts, high-speed internet, advanced trading platforms.
Swing: Standard charting tools, technical analysis software, news alerts.
Algorithmic trading: Both can benefit but intraday relies more heavily on automated systems.
11. Performance Metrics
Intraday:
Profit per trade is smaller but cumulative daily gains can be significant.
Key metrics: Win rate, risk-reward ratio, drawdown percentage.
Swing:
Profit per trade larger due to capturing trends.
Key metrics: Holding period returns, average gain/loss, volatility capture.
12. Case Studies
Example of successful intraday trades: High-volume stocks, news-based spikes.
Example of successful swing trades: Trend-following in indices or sectoral stocks.
Comparison of returns, drawdowns, and effort required.
13. Hybrid Approaches
Combining intraday scalping with swing trading to diversify income streams.
Portfolio allocation between short-term and medium-term trades.
Pros and cons of hybrid trading.
14. Choosing Your Style
Assess your risk tolerance, time availability, capital, and psychological comfort.
Test both styles using paper trading before committing real capital.
Flexibility and adaptation to changing market conditions.
15. Conclusion
Recap of key differences: time horizon, risk, rewards, strategies, tools.
Emphasis on personal suitability over “best style.”
Encouragement to practice disciplined trading, regardless of style.

Consumption Trends in the Indian Trading Market1. Introduction
Consumption trends refer to the patterns and behaviors exhibited by consumers in terms of purchasing goods and services over time. In India, with a population exceeding 1.4 billion, consumption plays a pivotal role in driving economic growth. Retail, e-commerce, FMCG (Fast-Moving Consumer Goods), luxury goods, and digital services are some of the major sectors influenced by consumer spending patterns.
In recent years, consumption trends in India have shifted due to urbanization, rising disposable incomes, digital penetration, and changing lifestyles. Analyzing these trends provides valuable insights for traders and businesses to align their strategies with market demands.
2. Factors Driving Consumption Trends
Several macro and microeconomic factors influence consumption in India:
2.1 Rising Disposable Income
India’s growing middle class has more disposable income than ever before. With steady economic growth and higher employment rates, consumers are spending more on discretionary items like electronics, fashion, entertainment, and travel.
2.2 Urbanization
Rapid urbanization has created a surge in modern retail consumption. Tier-1 and Tier-2 cities have witnessed increased demand for branded products, premium services, and online retail platforms.
2.3 Digital Transformation
Digital technology has reshaped consumer behavior in India. E-commerce platforms such as Amazon, Flipkart, and Myntra have transformed the way people shop. Digital payments, mobile apps, and online promotions have contributed to convenience and impulse buying.
2.4 Lifestyle Changes
The younger generation, especially millennials and Gen Z, prioritize experiences over material goods. Their consumption patterns lean towards travel, wellness, fitness, and technology-driven products.
2.5 Government Policies
Government initiatives like Digital India, Make in India, and financial inclusion programs have increased accessibility to products and services across urban and rural regions, boosting overall consumption.
3. Consumption Patterns by Sector
3.1 FMCG (Fast-Moving Consumer Goods)
FMCG remains a cornerstone of Indian consumption. Staples like food, beverages, personal care products, and household goods dominate spending. Recent trends show a shift toward organic, health-oriented, and premium products.
Rising Health Awareness: Consumers prefer products with natural ingredients and low sugar/fat content.
E-commerce Impact: Online grocery shopping has surged, with platforms like BigBasket and Grofers leading the way.
3.2 E-commerce and Digital Consumption
E-commerce has revolutionized the Indian market, making products accessible beyond urban areas.
Growth of Mobile Commerce: Mobile apps drive more than 70% of e-commerce transactions.
Discount Culture: Festive sales and heavy discounts influence consumer behavior, leading to higher transaction volumes.
Niche Segments: Fashion, electronics, beauty products, and digital content subscriptions are seeing high online demand.
3.3 Luxury and Lifestyle Products
Luxury goods consumption has grown steadily among urban Indians, reflecting aspirations and status symbols.
Premium Brands: Demand for high-end automobiles, watches, and fashion brands is rising.
Experiential Consumption: People prefer experiences like fine dining, vacations, and wellness retreats over material possessions.
3.4 Technology and Electronics
Digital adoption drives significant consumption in electronics, including smartphones, laptops, and smart home devices.
Affordability: Competitive pricing of smartphones and appliances has widened consumer reach.
Integration with Lifestyle: Smart devices now complement entertainment, work, and fitness trends.
3.5 Rural Consumption
Rural India represents a massive consumption base, accounting for nearly half of total consumer spending.
Staple Goods: Food, FMCG, and agricultural products dominate.
Emerging Demand: Appliances, motorcycles, mobile phones, and digital services are becoming popular as connectivity improves.
4. Emerging Consumption Trends
4.1 Sustainability and Eco-consciousness
Consumers increasingly prefer sustainable and eco-friendly products. Brands focusing on packaging, renewable resources, and green initiatives gain trust.
4.2 Subscription-Based Models
Subscription services for streaming, meal kits, and curated products are gaining traction. Consumers appreciate convenience and customization.
4.3 Omni-channel Retail
Consumers expect a seamless experience across offline and online channels. Retailers offering click-and-collect, virtual try-ons, and personalized services are benefiting.
4.4 Experiential Spending
Experience-driven consumption, including travel, fitness, and leisure, is surpassing traditional material spending, especially among millennials.
4.5 Influence of Social Media
Social media platforms heavily influence purchasing decisions. Influencer marketing, short video apps, and online reviews have become key drivers of consumption.
5. Impact on Indian Trading Market
5.1 Growth of Retail and E-commerce
The retail sector is witnessing unprecedented growth due to changing consumption trends. Organized retail chains, supermarkets, and online platforms are expanding rapidly.
5.2 Increased Investor Interest
High consumption fuels business revenues, making sectors like FMCG, e-commerce, and technology attractive for investors. Stock performance of companies catering to changing consumer behavior is closely tied to these trends.
5.3 Supply Chain Evolution
Consumption trends are reshaping supply chain strategies. Efficient logistics, warehouse networks, and last-mile delivery are critical to meet demand.
5.4 Dynamic Pricing and Promotions
Companies adopt dynamic pricing and targeted promotions to influence buying patterns, particularly in e-commerce and FMCG sectors.
5.5 Product Innovation
Consumer expectations push companies to innovate continuously, focusing on personalization, convenience, and sustainability.
6. Challenges and Risks
Despite robust growth, consumption trends face challenges:
Economic Uncertainty: Inflation, interest rates, and global economic conditions can impact consumer spending.
Rural Penetration Barriers: Limited infrastructure and financial literacy may restrict rural consumption growth.
Regulatory Hurdles: Taxation and compliance requirements can affect pricing and margins.
Changing Preferences: Rapid shifts in consumer preferences may lead to inventory and investment risks for businesses.
7. Future Outlook
India’s consumption trends indicate a promising future for traders, investors, and companies. Key predictions include:
Rising Digital Consumption: Continued growth in e-commerce and online services.
Premiumization: Increased demand for premium, lifestyle, and health-oriented products.
Rural Market Expansion: Improved infrastructure and digital access will unlock rural consumption potential.
Sustainable Consumption: Brands focusing on eco-friendly products will capture long-term consumer loyalty.
Technology Integration: AI-driven personalization, AR/VR retail experiences, and smart devices will reshape buying patterns.
Overall, India’s consumption-driven market will remain a critical engine of economic growth, innovation, and global trading opportunities. Businesses and investors who anticipate these trends and adapt accordingly are likely to gain a significant competitive advantage.
8. Conclusion
The Indian trading market is evolving rapidly, with consumption trends at its core. From urban tech-savvy buyers to rural emerging consumers, the diversity of preferences demands that traders and companies remain agile. Understanding these trends enables businesses to innovate, investors to strategize, and policymakers to facilitate sustainable growth.
India’s consumption story is one of opportunity, fueled by demographic advantage, technological adoption, and a culture of aspiration. The next decade promises to redefine how goods and services are traded, consumed, and valued across the subcontinent.

Supercycle 2025: Metals, Energy, and PricesIntroduction
The global commodities market is experiencing a significant transformation in 2025, characterized by a resurgence in metal and energy prices. This phenomenon, often referred to as a "commodity supercycle," is driven by a confluence of factors including the energy transition, geopolitical tensions, and structural supply constraints. Understanding the dynamics of this supercycle is crucial for investors, policymakers, and industry stakeholders.
1. Understanding the Commodity Supercycle
Definition and Historical Context
A commodity supercycle refers to an extended period during which commodity prices remain well above their long-term trend, typically lasting several years or even decades. Historically, such supercycles have been driven by factors like industrialization, technological advancements, and shifts in global demand.
Current Drivers
In 2025, the supercycle is primarily fueled by:
Energy Transition: The global shift towards renewable energy sources is increasing demand for metals like copper, lithium, and nickel.
Geopolitical Instability: Conflicts and trade tensions are disrupting supply chains, leading to price volatility.
Supply Constraints: Limited investments in mining and energy infrastructure over the past decade are leading to supply shortages.
2. Metals: The Backbone of the Supercycle
Copper
Copper is at the forefront of the current supercycle. Its demand is surging due to its essential role in electric vehicles (EVs), renewable energy systems, and grid infrastructure. In 2025, copper prices have climbed to near-record levels, driven by a complex interplay of surging demand and significant supply disruptions. Analysts project a 30% increase in copper demand by 2040.
Lithium and Nickel
Lithium and nickel are critical for battery production. The rise of EVs and energy storage solutions is propelling their demand. However, supply is struggling to keep pace, leading to price increases.
Gold
Gold has emerged as a safe haven amid economic uncertainties. In October 2025, gold prices surpassed $4,000 per ounce for the first time, marking a 53% increase year-to-date. This rally is attributed to factors like anticipated interest rate cuts, a weak U.S. dollar, and geopolitical instability.
3. Energy: The Fuel of the Supercycle
Oil
The energy sector is witnessing a paradox. While global oil production is at record highs, oversupply concerns are leading to price declines. The U.S. Energy Information Administration (EIA) forecasts U.S. oil production to reach 13.53 million barrels per day in 2025, yet prices are expected to average $65 per barrel, down about 15% from the previous year.
Natural Gas
Natural gas prices are experiencing volatility due to fluctuating demand and supply disruptions. The transition to cleaner energy sources is also impacting its long-term outlook.
Renewable Energy
Investments in renewable energy infrastructure are driving demand for materials like steel, aluminum, and rare earth elements. The shift towards a materials-intensive energy system is reshaping global commodity markets.
4. Implications for Investors and Policymakers
Investment Opportunities
Metals and Mining Stocks: Companies like Tata Steel and Hindalco are benefiting from rising metal prices and increased demand.
Energy Infrastructure: Investments in renewable energy projects and related infrastructure are poised for growth.
Commodity ETFs: Funds like SPDR Gold Shares (GLD) and United States Oil Fund (USO) offer exposure to commodity markets.
Policy Considerations
Supply Chain Resilience: Policymakers must address vulnerabilities in commodity supply chains, especially concerning critical minerals.
Sustainable Mining Practices: Encouraging environmentally responsible mining can mitigate the ecological impact of increased extraction activities.
Energy Transition Strategies: Developing comprehensive plans for transitioning to renewable energy can ensure energy security and economic stability.
5. Conclusion
The commodity supercycle of 2025 presents both challenges and opportunities. While rising prices can benefit producers and investors, they also underscore the need for strategic planning and investment in sustainable practices. As the world continues its transition towards cleaner energy, the dynamics of commodity markets will play a pivotal role in shaping the global economic landscape.

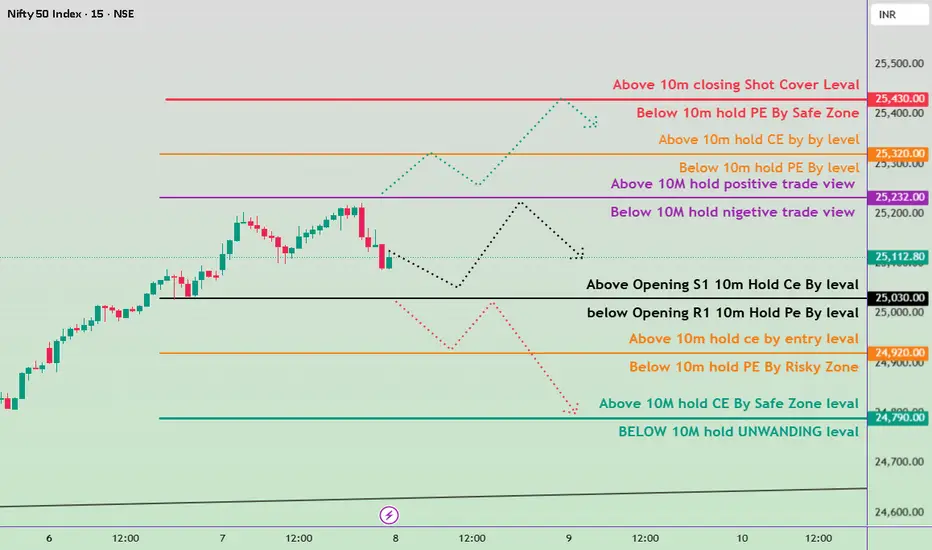
“Nifty 50 Intraday Key Levels | Buy & Sell Zones 8th Oct 2025”“Want to learn more? Like this post and follow me!”
25430 🔴 Above 10m closing Shot Cover Level
Strong resistance — short covering likely above this.
25320 🟠 Below 10m hold PE By level /
Above 10m hold CE by level
25232 🟣 Above 10M hold positive trade view
Below 10M hold negative trade view
Sentiment deciding level — crucial for trend direction.
25030 ⚫ Above Opening S1 10m Hold CE By level
Bullish entry level — CE hold area.
24920🟠 Below Opening R1 10m Hold PE By level
Below 10m hold PE By Risky Zone Weak zone — PE may strengthen below this.
24790🟢 Above 10M hold CE By Safe Zone level
Safe bullish zone — CE can be held confidently above.
24,780 🔵 BELOW 10M hold UNWINDING level
Breakdown zone — unwinding or heavy selling possible below.
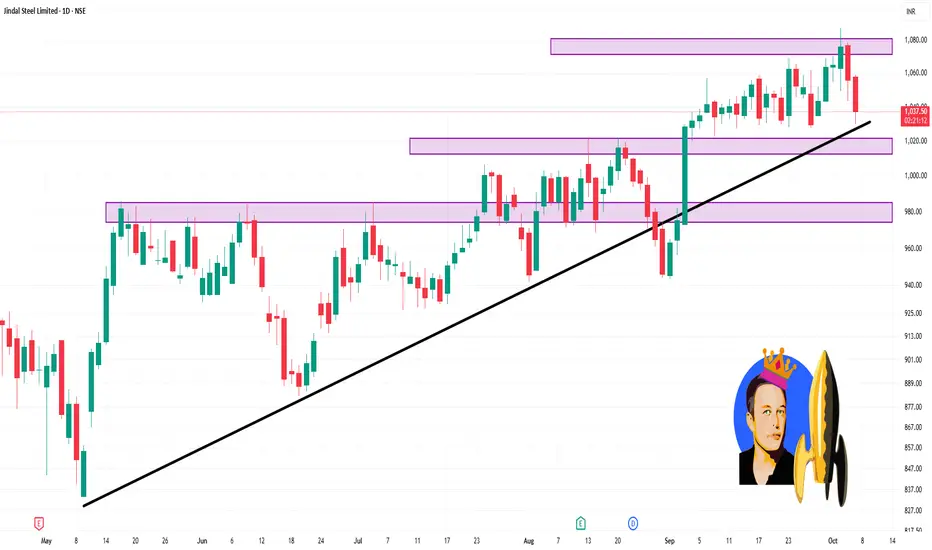
JINDALSTEL 1 Day Time Frame 📈 Intraday Support & Resistance Levels
Resistance Levels:
₹1,078.87
₹1,071.93
₹1,063.47
Support Levels:
₹1,056.54
₹1,048.07
₹1,041.13
These levels are derived from pivot point calculations and are useful for short-term trading decisions.
🔍 Technical Indicators
Relative Strength Index (RSI): Currently at 39.78, indicating a bearish condition.
MACD: At -3.67, suggesting a bearish trend.
Moving Averages: The stock shows a strong sell outlook based on moving averages ranging from MA5 to MA200, with 2 buy signals and 10 sell signals.
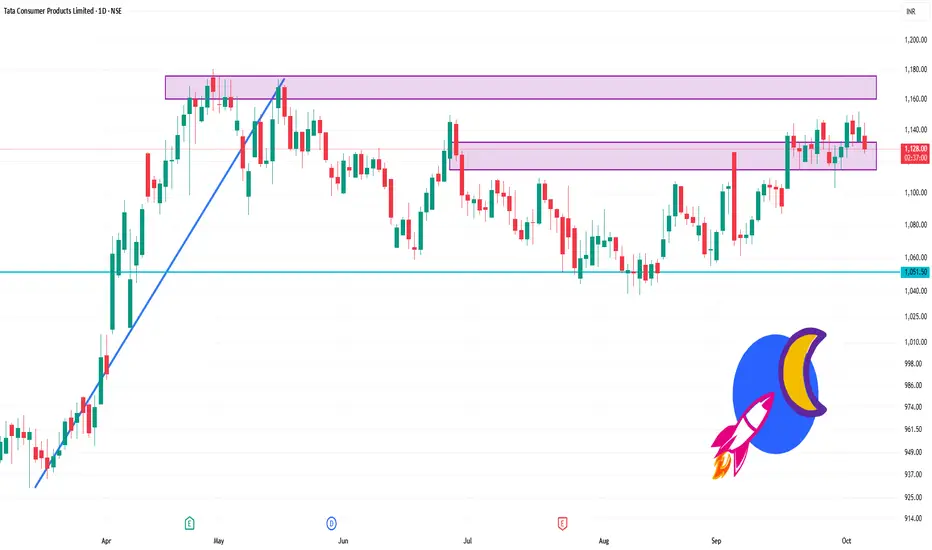
TATACONSUM 1 Day Time Frame 📊 Daily Support & Resistance Levels
Immediate Support: ₹1,112.57
Strong Support: ₹1,098.85
Resistance Levels: ₹1,154.75 → ₹1,182.65 → ₹1,210.60 → ₹1,238.50
🔄 Pivot Points & Fibonacci Levels
Pivot Point: ₹1,142.13
Resistance (R1–R4): ₹1,151.97 → ₹1,161.83 → ₹1,171.67 → ₹1,181.50
Support (S1–S4): ₹1,132.27 → ₹1,122.43 → ₹1,112.57 → ₹1,102.73
📈 Technical Indicators
Trend: Bullish on the long-term chart, neutral on the mid-term, and bullish on the short-term chart.
Resistance Levels: ₹1,144.80 → ₹1,168.90 → ₹1,168.00
Support Levels: ₹1,105.30 → ₹1,046.80 → ₹1,024.65
📌 Summary
Bullish Scenario: A breakout above ₹1,154.75 could target ₹1,182.65 and higher levels.
Bearish Scenario: A decline below ₹1,112.57 may lead to further support at ₹1,098.85.
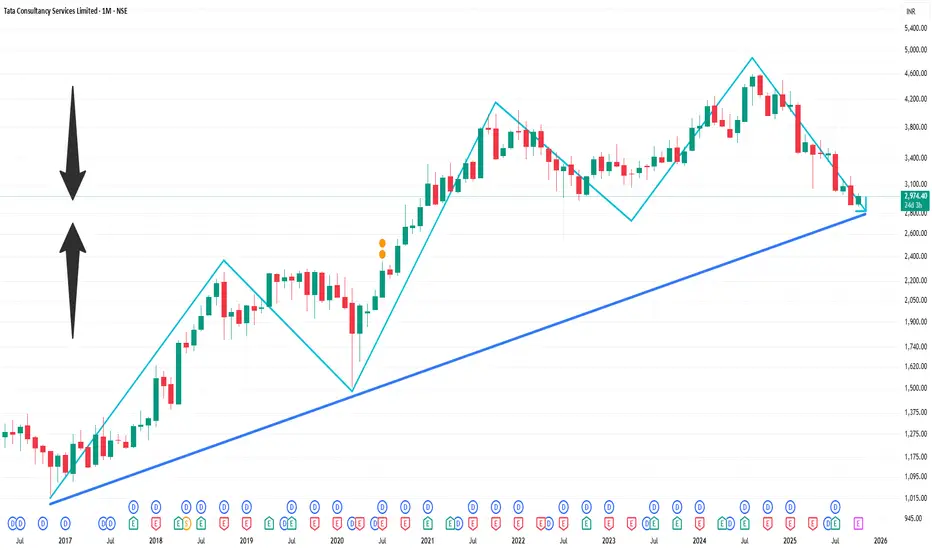
TCS 1 Month Time Frame 📉 Technical Overview (1-Month Timeframe)
Price Range: ₹2,867.55 – ₹3,202.95
Current Price: ₹2,962.
Trend: Bearish
According to TradingView, the 1-month technical analysis for TCS indicates a neutral outlook. However, moving averages suggest a strong sell signal. Oscillators are neutral, and pivot points are not specified.
🔍 Key Technical Indicators
Relative Strength Index (RSI): Not specified.
Moving Averages: Short-term and long-term moving averages indicate a bearish trend.
MACD: Not specified.
Pivot Points: Not specified.
🔮 Short-Term Outlook
Analysts forecast that TCS may reach ₹2,953.43 within a week and ₹2,707.65 within four weeks.
⚠️ Conclusion
The current technical indicators suggest a bearish trend for TCS over the past month. Investors should exercise caution and consider these factors when making investment decisions.
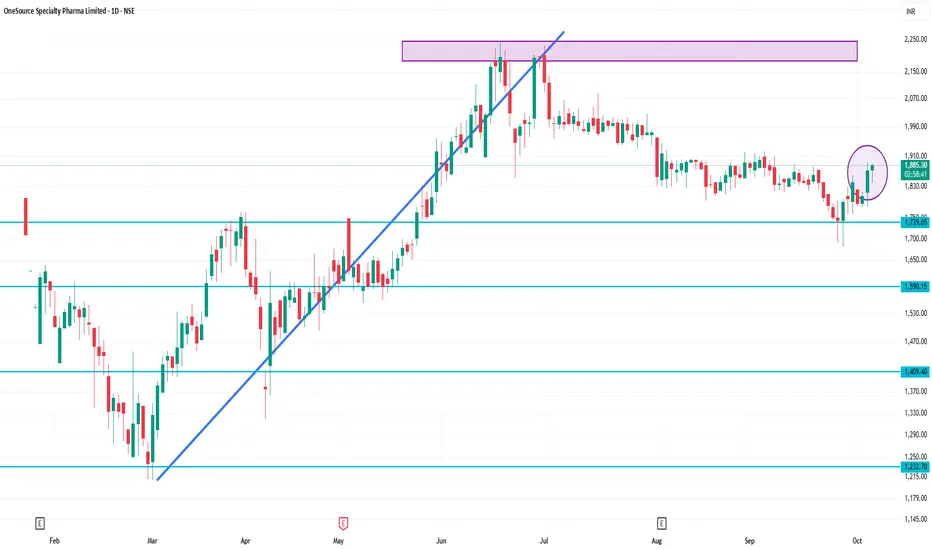
ONESOURCE 1 Day Time Frame 📈 Intraday Price Levels (1-Day Time Frame)
Day Range: ₹1,839.50 – ₹1,891.10
Previous Close: ₹1,872.10
Opening Price: ₹1,872.60
Volume: 69,807 shares traded
VWAP (Volume-Weighted Average Price): ₹1,870.18
🔍 Key Technical Levels
Immediate Resistance: ₹1,891.10 (Day High)
Immediate Support: ₹1,839.50 (Day Low)
Upper Circuit Limit: ₹2,246.50
Lower Circuit Limit: ₹1,497.70
52-Week High: ₹2,248.00
52-Week Low: ₹1,209.95
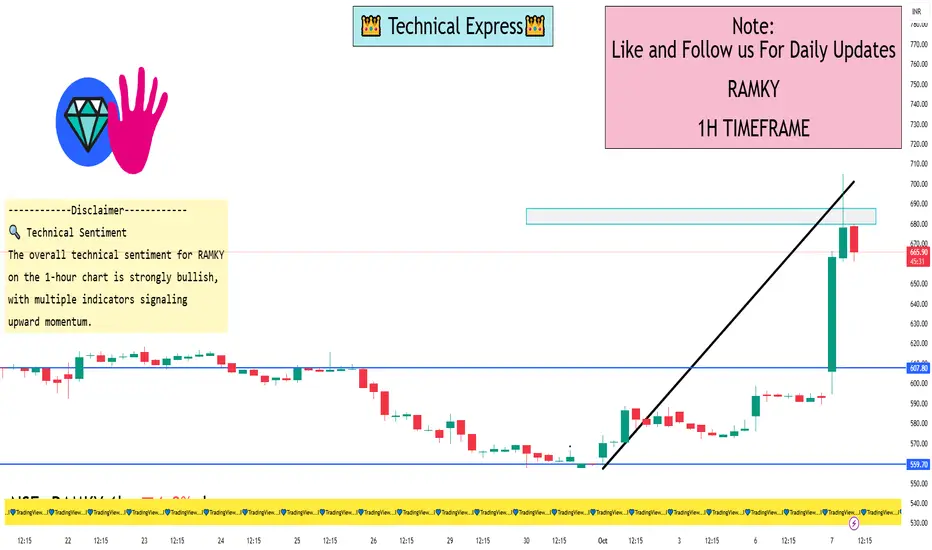
RAMKY 1 Hour View 📈 1-Hour Intraday Technical Overview
Based on the latest intraday data, here's a snapshot of RAMKY's performance:
Current Price: ₹687.10
Daily Range: ₹594.40 – ₹705.00
Volume: Approximately 6.4 million shares
RSI (Relative Strength Index): 73.06 (indicating overbought conditions)
MACD (Moving Average Convergence Divergence): 11.03 (bullish momentum)
ADX (Average Directional Index): 23.81 (moderate trend strength)
Supertrend Indicator: ₹560.31 (suggesting an upward trend)
Parabolic SAR: ₹557.45 (supporting bullish trend)
Rate of Change (ROC): 14.39% (indicating strong momentum)
Chaikin Money Flow (CMF): 0.358 (positive accumulation)
Williams %R: -12.13 (approaching overbought territory)
Stochastic Oscillator: 36.47 (neutral, with potential for upward movement)
🔍 Technical Sentiment
The overall technical sentiment for RAMKY on the 1-hour chart is strongly bullish, with multiple indicators signaling upward momentum. However, the high RSI suggests that the stock may be approaching overbought levels, indicating a potential for short-term consolidation or pullback.
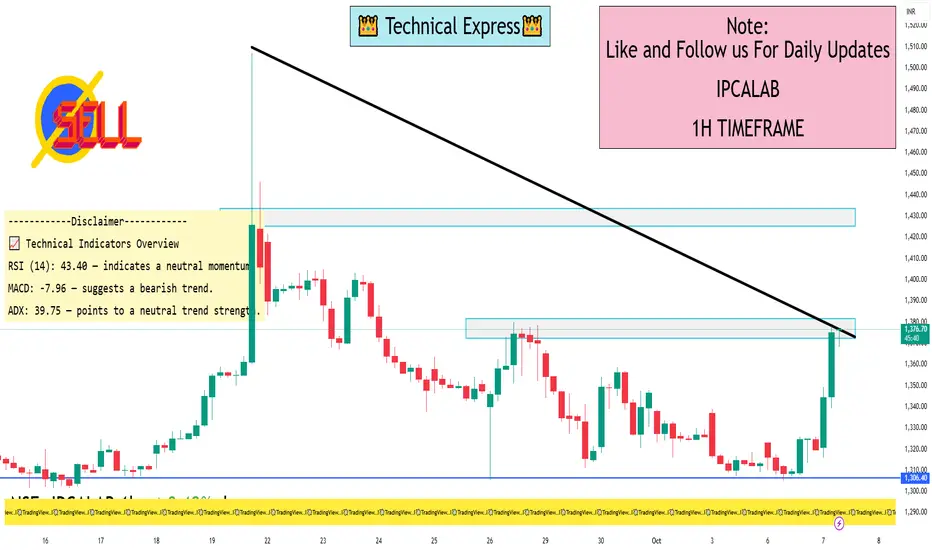
IPCALAB 1 Hour View📊 1-Hour Timeframe: Support & Resistance Levels
Based on recent intraday data, here are the key support and resistance levels for IPCA Laboratories Ltd. on the 1-hour timeframe:
🔽 Support Levels:
S1: ₹1,324.36
S2: ₹1,323.13
S3: ₹1,322.06
🔼 Resistance Levels:
R1: ₹1,326.66
R2: ₹1,327.73
R3: ₹1,328.96
These levels are derived from standard pivot point calculations and are widely used by traders to identify potential reversal points.
📈 Technical Indicators Overview
RSI (14): 43.40 — indicates a neutral momentum.
MACD: -7.96 — suggests a bearish trend.
ADX: 39.75 — points to a neutral trend strength.
Moving Averages:
5-period EMA: ₹1,325.64 — indicates a buy signal.
50-period EMA: ₹1,352.22 — suggests a sell signal.
200-period EMA: ₹1,351.26 — indicates a sell signal.
Pivot Points:
Pivot: ₹1,325.43
R1: ₹1,326.66
S1: ₹1,324.36
These indicators collectively suggest a cautious outlook for short-term traders, with a prevailing bearish sentiment.