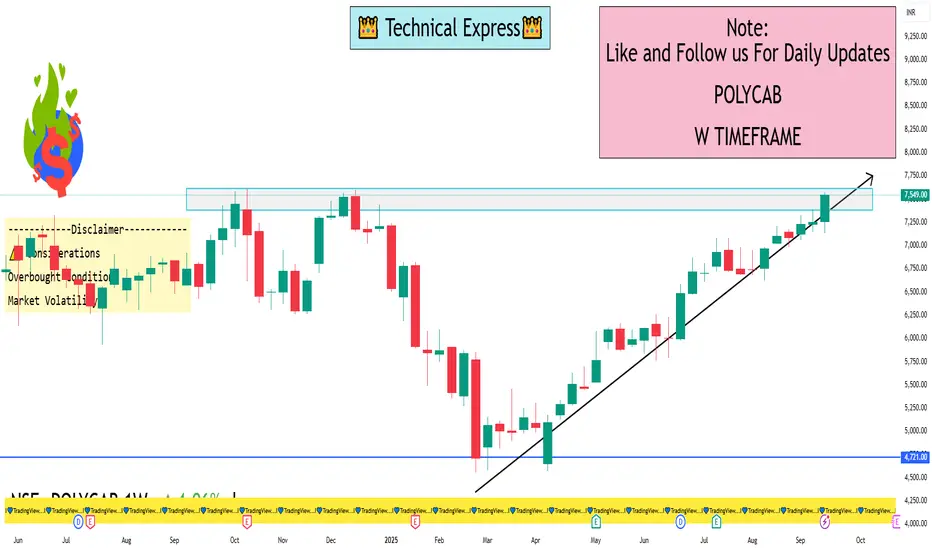
POLYCAB 1 Week View📈 Weekly Technical Outlook
Over the past week, Polycab's stock has demonstrated a strong bullish trend, supported by several key technical indicators:
Technical Ratings: Both daily and weekly analyses indicate a "Strong Buy" signal, suggesting sustained upward momentum.
Relative Strength Index (RSI): The weekly RSI stands at 85.19, indicating the stock is in overbought territory, which may suggest a potential short-term pullback.
Support and Resistance Levels:
Immediate Support: ₹7,193
Immediate Resistance: ₹7,890
Medium-Term Resistance: ₹8,693.86
Long-Term Resistance: ₹9,068.70
Long-Term Support: ₹6,000.50
Trend Indicators: Moving averages and other technical indicators are aligned with a bullish trend, supporting the "Strong Buy" signal.
⚠️ Considerations
Overbought Conditions: The high RSI suggests the stock may be due for a short-term consolidation or pullback.
Market Volatility: Investors should be aware of potential market fluctuations that could impact stock performance.
📊 Summary
Polycab India Ltd. is exhibiting strong bullish momentum on the weekly timeframe. While the stock's overbought condition warrants caution, the overall technical indicators support a positive outlook. Investors should monitor key support and resistance levels and consider potential short-term corrections as part of their investment strategy.
Trade
Risk-Free Trading and Strategies1. Understanding Risk and the Risk-Free Concept
1.1 Definition of Risk in Trading
In trading, risk is defined as the probability of losing part or all of the invested capital due to market fluctuations. Market risks arise from several sources:
Price Risk: The chance that asset prices move against the trader’s position.
Interest Rate Risk: Fluctuations in interest rates affecting bond prices or currency valuations.
Liquidity Risk: Difficulty in executing a trade without impacting the asset’s price.
Counterparty Risk: The risk that the other party in a financial transaction may default.
1.2 The Risk-Free Rate
The risk-free rate is a foundational concept in finance. It represents the theoretical return an investor would receive from an investment with zero risk of financial loss. Government-issued securities, such as U.S. Treasury bills or Indian Government Bonds, are commonly used as proxies for risk-free assets because the probability of default is extremely low. All other investments are measured relative to this baseline using risk premiums, which compensate investors for taking additional risk.
1.3 The Myth of “Risk-Free Trading”
It is crucial to acknowledge that true risk-free trading does not exist in speculative markets. Even sophisticated strategies designed to minimize risk can fail due to unexpected market conditions, operational errors, or systemic shocks. However, financial markets offer near risk-free opportunities, often through arbitrage, hedging, or government-backed instruments.
2. Theoretical Foundations of Risk-Free Trading
2.1 Arbitrage Theory
Arbitrage is a cornerstone of risk-free trading. Arbitrage involves buying and selling the same asset simultaneously in different markets to profit from price discrepancies. Theoretically, arbitrage is considered “risk-free” because it exploits mispricing rather than market direction.
Example:
Suppose a stock trades at ₹100 on the National Stock Exchange (NSE) in India and $1.25 equivalent on an international exchange. A trader can:
Buy the cheaper stock in India.
Sell the same stock in the international market.
Lock in a risk-free profit equal to the price difference after accounting for transaction costs.
While arbitrage appears risk-free, practical execution involves risks, such as transaction delays, market volatility during execution, and high transaction costs.
2.2 Covered Interest Rate Parity
Covered Interest Rate Parity (CIRP) is a near risk-free strategy in the foreign exchange market. It exploits differences in interest rates between two countries while hedging currency risk through forward contracts.
How it Works:
Borrow funds in the currency with a lower interest rate.
Convert the borrowed funds into a higher interest rate currency.
Invest in a risk-free asset in the higher interest rate currency.
Use a forward contract to convert the proceeds back to the original currency at a predetermined rate.
This approach ensures a locked-in return with minimal exposure to currency fluctuations.
2.3 The Role of Hedging
Hedging is another critical element in risk-free trading. Hedging involves taking offsetting positions to reduce or neutralize market risk. Traders use derivatives like options, futures, and swaps to protect their portfolios from adverse price movements.
Common Hedging Strategies:
Protective Put: Buying a put option to limit downside on a stock holding.
Covered Call: Owning a stock while selling a call option to earn premium income while limiting upside.
Delta Neutral Strategy: Combining options and stock positions to minimize sensitivity to price changes.
Hedging reduces risk but does not entirely eliminate it. It is most effective in volatile markets where potential losses can be significant.
3. Practical Risk-Free Trading Strategies
Although no market strategy is entirely risk-free, several practical methods allow traders to approach near-zero risk levels.
3.1 Arbitrage Trading
Arbitrage remains the closest form of “risk-free trading.” Various types exist:
3.1.1 Stock Arbitrage
Exploits price discrepancies of the same stock across different exchanges.
Requires quick execution and sufficient capital.
3.1.2 Triangular Forex Arbitrage
Involves three currencies and takes advantage of discrepancies in cross-exchange rates.
For example, converting USD → EUR → GBP → USD to earn a risk-free profit.
3.1.3 Futures Arbitrage
Exploits the difference between spot and futures prices of the same asset.
Requires precise timing and understanding of carrying costs.
Pros: Low-risk, market-neutral.
Cons: Short-lived opportunities, requires technology and low transaction costs.
3.2 Hedged Trading with Derivatives
Options and futures provide tools for risk mitigation.
Protective Put Strategy:
Buy a put option for a stock already owned.
Limits maximum loss while allowing unlimited upside potential.
Covered Call Strategy:
Hold a stock and sell a call option.
Earn premium income, which offsets potential losses in small downturns.
Example:
Own 100 shares of a company at ₹1,000 each.
Sell a call option with a strike of ₹1,050 for ₹20 premium.
If stock rises above ₹1,050, you sell at ₹1,050 but keep ₹20 premium.
If stock falls, the premium offsets part of the loss.
3.3 Risk-Free Bonds and Government Securities
Investing in government securities is the most straightforward risk-free strategy. Examples include:
Treasury Bills (T-Bills): Short-term government debt with fixed returns.
Government Bonds: Longer-term instruments with predictable interest payments.
Fixed Deposits (FDs): Bank-backed deposits with guaranteed returns.
Pros: Extremely low risk and predictable returns.
Cons: Low returns compared to equities; susceptible to inflation risk.
3.4 Market-Neutral ETFs
Some ETFs employ long-short strategies to minimize market exposure.
Long-short ETFs: Buy undervalued stocks (long) and short overvalued stocks.
Market-neutral ETFs: Target returns independent of overall market movements.
These instruments provide a way for retail investors to engage in near-risk-free strategies without complex derivative setups.
3.5 Statistical Arbitrage
Statistical arbitrage uses historical correlations and mathematical models to trade pairs or baskets of securities.
How it Works:
Identify highly correlated assets.
Go long on underperforming and short on overperforming securities.
Profit as the spread converges.
This is a market-neutral strategy but requires sophisticated software, data analysis, and continuous monitoring.
4. Principles of Minimizing Risk
Even with strategies labeled “risk-free,” the following principles are essential:
Diversification: Spread capital across multiple assets to reduce exposure to a single market event.
Hedging: Protect positions using derivatives to offset adverse moves.
Position Sizing: Avoid over-leveraging, as even low-risk trades can become high-risk with excessive capital.
Liquidity Awareness: Trade only in liquid markets where positions can be exited quickly.
Cost Management: Transaction fees, spreads, and taxes can erode profits, converting low-risk strategies into potential losses.
5. Common Misconceptions
“Risk-free trading exists in all markets” → False. Only government-backed instruments are truly risk-free.
“High returns with zero risk is achievable” → Impossible; higher returns always involve higher risk.
“Hedging eliminates risk” → Hedging reduces risk but cannot remove systemic or operational risk.
6. Implementing Risk-Free Strategies in Real Markets
6.1 Tools and Platforms
Trading Platforms: NSE, BSE, Interactive Brokers, MetaTrader for forex arbitrage.
Derivatives Platforms: For options and futures hedging.
Data Analytics: High-speed software for identifying arbitrage opportunities.
6.2 Risk Monitoring
Set stop-loss orders even in hedged positions.
Use risk/reward analysis to evaluate each trade.
Monitor market conditions, interest rates, and geopolitical events that may affect “risk-free” assumptions.
6.3 Case Study: Arbitrage in Indian Markets
Scenario: Nifty futures trading at a premium to spot index.
Strategy:
Short Nifty futures.
Buy underlying stocks forming the index.
Lock in profit as futures and spot prices converge at expiry.
This is a classic cash-and-carry arbitrage, minimizing market risk while generating predictable returns.
7. Limitations of Risk-Free Trading
Capital Intensive: Arbitrage requires significant capital for small profits.
Execution Risk: Delays or errors can eliminate expected gains.
Regulatory Constraints: Some strategies may be restricted in certain markets.
Opportunity Scarcity: Risk-free opportunities are rare and often short-lived.
8. Conclusion
Risk-free trading is a concept grounded in finance theory but practically limited in speculative markets. True zero-risk investments are confined to government-backed securities, while near-risk-free strategies involve arbitrage, hedging, and market-neutral approaches. Traders aiming to minimize risk must combine strategic execution, diversification, and risk management tools to achieve consistent, low-risk returns.
While markets inherently carry uncertainty, understanding risk, leveraging arbitrage opportunities, and employing hedged strategies allows traders to approach the closest practical form of risk-free trading. In essence, the goal is not to eliminate risk entirely but to manage it intelligently, ensuring that potential losses are minimized while opportunities for gain remain accessible.
Cryptocurrency as a Digital Asset1. What is a Cryptocurrency?
At its core, a cryptocurrency is a digital or virtual currency that relies on cryptography for security. Unlike physical currencies issued by governments (fiat money), cryptocurrencies operate on decentralized networks based on blockchain technology—a distributed ledger maintained by a network of computers (nodes). These digital assets can be used as a medium of exchange, a store of value, and a unit of account, although their adoption varies widely.
The first and most widely known cryptocurrency is Bitcoin, introduced in 2009 by the pseudonymous creator Satoshi Nakamoto. Bitcoin was designed as a peer-to-peer electronic cash system, enabling users to transact without intermediaries like banks. Since then, thousands of alternative cryptocurrencies (altcoins) have emerged, each with unique features, purposes, and communities.
2. Characteristics of Cryptocurrencies as Digital Assets
Cryptocurrencies possess distinct characteristics that differentiate them from traditional assets:
a. Decentralization
Unlike centralized financial systems controlled by banks or governments, cryptocurrencies operate on decentralized networks. This decentralization reduces reliance on intermediaries, enhances transparency, and mitigates single points of failure in financial systems.
b. Digital Nature
Cryptocurrencies exist solely in digital form, making them easily transferable across borders, instantaneously, without the need for physical exchange. This digital nature allows for programmable transactions, automated contracts, and integration with emerging technologies like smart contracts and decentralized finance (DeFi).
c. Security and Immutability
Transactions are secured using cryptographic algorithms. Once recorded on a blockchain, transactions are immutable, meaning they cannot be altered or deleted. This feature enhances trust and integrity in digital financial transactions.
d. Scarcity and Supply Mechanisms
Many cryptocurrencies, like Bitcoin, have a fixed maximum supply. Bitcoin, for instance, has a cap of 21 million coins. This scarcity creates a potential store of value similar to precious metals, and it can influence market dynamics through supply-demand mechanisms.
e. Volatility
Cryptocurrencies are notorious for price volatility. The same digital asset may experience significant fluctuations in a single day due to speculative trading, adoption news, regulatory announcements, or macroeconomic factors. While this volatility presents high-risk opportunities for traders, it can also pose challenges for long-term investors.
3. The Technology Behind Cryptocurrencies
The backbone of cryptocurrencies is blockchain technology—a distributed ledger that records all transactions across a network of computers. Key technological aspects include:
a. Blockchain
A blockchain is a chain of blocks containing transaction records. Each block is linked to the previous one using cryptographic hashes, creating a secure, immutable record. Blockchains can be public (like Bitcoin and Ethereum) or private/permissioned (used by enterprises).
b. Consensus Mechanisms
Cryptocurrencies rely on consensus mechanisms to validate transactions without a central authority. Common mechanisms include:
Proof of Work (PoW): Miners solve complex mathematical problems to validate transactions (e.g., Bitcoin).
Proof of Stake (PoS): Validators are chosen based on the number of coins they hold and are willing to “stake” (e.g., Ethereum 2.0).
Other mechanisms: Delegated Proof of Stake (DPoS), Proof of Authority (PoA), and hybrid models.
c. Smart Contracts
Smart contracts are self-executing contracts with terms directly written into code. They run on blockchain platforms like Ethereum and enable decentralized applications (DApps) for lending, insurance, gaming, and other financial services.
d. Wallets and Keys
Cryptocurrency ownership is represented by cryptographic keys:
Public key: Acts like an address for receiving funds.
Private key: Acts as a password for authorizing transactions. Proper management of private keys is crucial for asset security.
4. Cryptocurrencies as an Investment Asset Class
Cryptocurrencies have evolved from speculative instruments to a recognized asset class in global finance. Investors view them through various lenses:
a. Store of Value
Bitcoin is often referred to as “digital gold” due to its limited supply and potential to hedge against inflation. Unlike fiat currency, whose value may erode due to monetary expansion, Bitcoin offers a deflationary characteristic.
b. Diversification
Cryptocurrencies provide portfolio diversification due to their low correlation with traditional asset classes like equities and bonds. Including crypto assets in an investment portfolio can enhance risk-adjusted returns.
c. High-Risk, High-Reward
The cryptocurrency market is volatile and speculative. While early adopters have earned significant returns, the market is also prone to crashes. Understanding risk tolerance, time horizon, and market cycles is critical for investors.
d. Yield Opportunities
Beyond price appreciation, cryptocurrencies offer opportunities for earning yields through mechanisms like staking, lending, and decentralized finance protocols.
5. Market Dynamics and Trading
The cryptocurrency market operates 24/7, unlike traditional stock markets. Key factors influencing crypto prices include:
Supply and demand: Limited supply and growing adoption can drive prices higher.
Speculation: Retail and institutional investors’ buying/selling patterns create volatility.
Regulatory news: Announcements regarding crypto regulations significantly impact market sentiment.
Technological developments: Upgrades, forks, and innovations affect the value of specific cryptocurrencies.
Macro trends: Inflation, monetary policy, and geopolitical events influence crypto markets indirectly.
Trading strategies in cryptocurrency markets range from long-term holding (HODLing) to intraday trading, arbitrage, and algorithmic trading. Each strategy carries its own risk-reward profile.
6. Risks Associated with Cryptocurrencies
Investing or trading in cryptocurrencies comes with multiple risks:
Volatility Risk: Prices can swing dramatically within hours.
Regulatory Risk: Governments can impose bans, restrictions, or heavy taxation.
Security Risk: Hacks, scams, and wallet mismanagement can lead to loss of funds.
Liquidity Risk: Smaller cryptocurrencies may have low trading volumes, making it difficult to enter or exit positions.
Technological Risk: Bugs, forks, or software vulnerabilities can compromise networks or assets.
Investors must conduct thorough research, employ security best practices, and consider risk management strategies before entering the crypto market.
Conclusion
Cryptocurrencies as digital assets represent one of the most profound financial innovations of the 21st century. By combining cryptography, decentralized networks, and digital scarcity, they have created a new paradigm for value exchange. Investors, technologists, and regulators continue to explore their potential, benefits, and risks.
While volatility, security, and regulatory uncertainty present challenges, the long-term prospects for cryptocurrencies remain promising. They offer an alternative financial system that is borderless, programmable, and transparent, potentially transforming the way we think about money, investments, and global trade. As adoption grows and technology matures, cryptocurrencies are likely to become an increasingly integral part of both individual portfolios and institutional financial strategies.
Intraday Scalping Tips: A Comprehensive Guide for Traders1. Understanding Intraday Scalping
Intraday scalping is a high-frequency trading strategy where traders aim to exploit minor price movements in highly liquid stocks, indices, or commodities. Scalpers typically hold positions for a few seconds to a few minutes, rarely longer than an hour, focusing on micro-trends.
Key Characteristics of Scalping:
Frequency: Multiple trades per day, often 20-50 or more.
Profit per trade: Small, usually 0.1% to 0.5% of the asset price.
Timeframe: Very short, typically 1-minute, 5-minute, or tick charts.
Tools: Technical indicators, Level 2 data, order books, and high-speed trading platforms.
Scalping is favored by traders who thrive on fast decision-making and have the discipline to follow strict risk management rules.
2. Choosing the Right Market and Instruments
Not all markets are suitable for scalping. The ideal instruments share characteristics like liquidity, volatility, and tight bid-ask spreads.
A. Liquidity
Highly liquid instruments allow traders to enter and exit positions quickly without significant slippage. Examples include:
Stocks: Large-cap equities such as Apple, Microsoft, or Reliance Industries.
Indices: Nifty 50, S&P 500, or Dow Jones futures.
Forex pairs: EUR/USD, GBP/USD, USD/JPY.
Commodities: Gold, crude oil futures.
B. Volatility
Scalpers thrive on small price fluctuations. Moderate volatility ensures there are enough trading opportunities without excessive risk. Instruments with too low volatility may not provide sufficient profit potential, while highly volatile ones can lead to rapid losses.
C. Spreads
Tighter bid-ask spreads reduce trading costs. Scalpers often trade instruments with minimal spreads to maximize net gains.
3. Technical Analysis for Scalping
Technical analysis is the backbone of scalping. Traders rely on charts, indicators, and patterns to make rapid decisions.
A. Timeframes
Scalpers primarily use:
1-Minute Charts: Ideal for ultra-short-term trades.
5-Minute Charts: Better for slightly larger moves and trend confirmation.
Tick Charts: Track each transaction for highly active markets.
B. Indicators
Common indicators for scalping include:
Moving Averages (MA):
Use short-term MAs (5, 10, 20 periods) to identify micro-trends.
Crossovers signal potential entry/exit points.
Relative Strength Index (RSI):
Helps spot overbought or oversold conditions.
RSI above 70 indicates overbought, below 30 indicates oversold.
Bollinger Bands:
Show volatility and potential reversal zones.
Price touching the upper or lower band may indicate a short-term reversal.
Volume Analysis:
Confirms the strength of price movements.
Increasing volume with price momentum strengthens trade signals.
C. Price Action Patterns
Scalpers also rely on candlestick patterns:
Pin Bars: Indicate quick reversals.
Doji: Signal market indecision.
Engulfing Patterns: Show strong directional shifts.
4. Scalping Strategies
A. Momentum Scalping
Momentum scalping involves entering trades in the direction of strong price movements. Traders look for:
Breakouts from consolidation zones.
High volume spikes confirming the trend.
Fast execution to ride the momentum.
Example: A stock breaking above a resistance level with heavy volume may provide a 1-2% intraday profit if timed correctly.
B. Range Trading
Some instruments trade within a defined price range during the day. Scalpers can:
Buy at support and sell at resistance.
Use tight stop-losses to minimize risk.
Confirm trades with oscillators like RSI or Stochastic.
C. News-Based Scalping
Economic reports, corporate announcements, or geopolitical news can trigger rapid price movements. Scalpers exploit this by:
Monitoring economic calendars.
Reacting quickly to breaking news.
Using platforms with low latency execution.
Caution: News-based scalping is high-risk due to unpredictable price swings.
D. Spread Scalping
This strategy is common in Forex or highly liquid markets:
Traders exploit tiny differences in bid-ask spreads.
Requires sophisticated software or a broker offering minimal latency.
5. Risk Management in Scalping
Effective risk management is non-negotiable in scalping. High trade frequency increases exposure, making small losses potentially catastrophic.
A. Position Sizing
Use small position sizes relative to your total capital.
Limit risk to 0.5%-1% per trade.
B. Stop-Loss and Take-Profit
Set tight stop-losses to avoid large losses.
Use risk-reward ratios around 1:1 or 1:1.5 due to the small profit target per trade.
C. Avoid Overtrading
Stick to your strategy, even if tempted to chase small gains.
Overtrading can erode profits and increase emotional stress.
D. Monitor Transaction Costs
Frequent trades mean higher brokerage and fees.
Opt for brokers with low commissions and tight spreads.
6. Common Mistakes to Avoid
Overleveraging: Increases risk of large losses.
Ignoring Transaction Costs: High fees can nullify gains.
Chasing the Market: Jumping into trades without setup leads to losses.
Neglecting Stop-Losses: Can transform small losses into significant drawdowns.
Emotional Trading: Fear and greed are the biggest enemies of scalpers.
Conclusion
Intraday scalping is a high-speed, high-discipline trading strategy that can yield consistent profits if executed correctly. The key to success lies in:
Choosing the right instruments.
Mastering technical analysis and chart patterns.
Implementing strict risk management.
Maintaining emotional control and mental focus.
Leveraging technology to improve speed and efficiency.
Scalping is not for everyone. It requires patience, precision, and resilience. However, for traders willing to invest time in learning and practicing, it can be a highly rewarding strategy in the world of financial markets.
Smart Money Secrets: Unlocking the Strategies of Market Insiders1. Understanding Smart Money
Smart money refers to capital controlled by institutional investors, hedge funds, central banks, high-net-worth individuals, or other financial entities that have access to superior information, resources, and analytical tools. Unlike retail traders, who often react emotionally to market events, smart money acts strategically, often positioning itself ahead of major market moves.
Key Characteristics of Smart Money
Informed Decision-Making: Smart money is guided by deep research, access to non-public or early public information, and advanced analytics.
Long-Term Strategy: While retail traders may chase short-term gains, smart money focuses on sustainable trends and risk-adjusted returns.
Market Influence: Large trades by institutional investors can move entire markets, influencing liquidity, price trends, and volatility.
Contrarian Behavior: Often, smart money goes against public sentiment, buying when retail panic sells and selling when retail greed drives prices up.
The essence of smart money is that it is strategically positioned, informed, and patient, making it a crucial concept for anyone seeking to understand market dynamics.
2. How Smart Money Moves
Smart money doesn’t just jump in randomly; its movements are deliberate, carefully calculated, and often hidden until the right moment.
a. Accumulation Phase
This is when smart money quietly starts buying a stock or asset without attracting attention. Retail traders may not notice, and prices may remain relatively flat. The goal is to accumulate a significant position at favorable prices.
Indicators of accumulation:
Increasing volume without major price movement.
Gradual upward trend after a prolonged downtrend.
Strong institutional buying reported in filings (e.g., 13F filings in the U.S.).
b. Markup Phase
Once enough positions are accumulated, smart money begins to push prices higher. This phase attracts retail traders and media attention. Prices may accelerate as momentum builds.
Indicators of markup:
Rising volume coinciding with price increase.
Breakouts above previous resistance levels.
Positive news and analyst upgrades (sometimes intentionally leaked).
c. Distribution Phase
Smart money slowly exits its positions, often selling to late-coming retail traders who are driven by hype. Despite the selling, the market may still appear bullish.
Indicators of distribution:
Volume spikes with minimal price change (selling into demand).
Repeated price rejection at key resistance levels.
Contradictory market sentiment (euphoria among retail investors).
d. Markdown Phase
Finally, the market corrects sharply as smart money has exited, leaving retail traders exposed. This phase often follows peaks in media coverage and public attention.
Indicators of markdown:
Price declines with increasing volume.
Negative news amplifying fear and panic selling.
Technical breakdowns through key support levels.
3. Tools to Track Smart Money
Identifying smart money movements requires using both technical and fundamental tools. Here are some widely used methods:
a. Volume Analysis
Volume spikes often indicate institutional activity. Unlike retail traders who trade in smaller sizes, large trades by institutions create noticeable volume patterns.
On-Balance Volume (OBV) and Volume Weighted Average Price (VWAP) can reveal buying or selling pressure not immediately visible in price charts.
b. Commitment of Traders (COT) Reports
COT reports, available for commodities and futures markets, show the positions of commercial and non-commercial traders. Sharp increases in commercial positions often signal smart money entering the market.
c. Options Market Activity
Unusual activity in call and put options may indicate that insiders or institutions are hedging large trades or anticipating significant moves.
Open interest changes and implied volatility spikes are useful signals.
d. Insider Trading Filings
In publicly traded companies, insider buying or selling can offer clues about smart money sentiment. While insiders may trade for personal reasons, consistent buying from executives can be a strong bullish signal.
e. Dark Pools
Large institutional trades are sometimes executed in private exchanges called dark pools to avoid affecting public prices. Tracking dark pool activity can give insights into hidden accumulation or distribution.
4. Psychology Behind Smart Money
Understanding smart money isn’t just about charts or filings—it’s also about human behavior and market psychology.
Fear and Greed: Retail traders often act on emotional impulses. Smart money exploits these emotions, buying when others fear and selling when others greed.
Patience and Discipline: Smart money waits for the right setup, unlike retail traders who chase immediate profits.
Contrarian Thinking: Going against the crowd is often a hallmark of smart money. Identifying overbought or oversold conditions allows them to capitalize on market sentiment extremes.
5. Strategies to Follow Smart Money
While replicating institutional strategies directly can be challenging due to scale and access, retail traders can learn and adapt techniques inspired by smart money principles.
a. Trend Following
Identify accumulation zones through volume and price analysis.
Ride trends in the markup phase while managing risk.
Avoid panic during minor corrections, focusing on broader smart money-driven trends.
b. Contrarian Investing
Look for areas where retail sentiment is extremely bullish (potential distribution) or extremely bearish (potential accumulation).
Use indicators like Fear & Greed Index, social media sentiment, and retail positioning metrics.
c. Risk Management
Smart money is always risk-aware. Proper position sizing, stop-loss strategies, and portfolio diversification help protect against unexpected moves.
Using tools like options for hedging can replicate professional risk management approaches.
d. Multi-Timeframe Analysis
Smart money operates across multiple timeframes—from intraday moves to multi-year positions.
Combining short-term and long-term charts can reveal where institutional positions are being built and unwound.
6. Common Smart Money Indicators
Several technical and market indicators are considered proxies for smart money activity:
Volume-Price Trend (VPT): Combines volume and price movement to indicate accumulation or distribution.
Accumulation/Distribution Line: Highlights whether a stock is being accumulated (bought) or distributed (sold).
Money Flow Index (MFI): A volume-weighted RSI that can reveal hidden buying/selling pressure.
VWAP (Volume Weighted Average Price): Tracks the average price weighted by volume—smart money often buys below VWAP and sells above it.
Conclusion
The secrets of smart money are not about mystical insider knowledge—they are about observation, discipline, and strategy. By studying market behavior, volume patterns, institutional filings, and psychological trends, retail traders can gain insights into the movements of the largest and most informed market players. While mimicking smart money directly is impossible for most individuals, understanding their methods, motives, and timing can provide a strategic edge, helping you make more informed and confident investment decisions.
Smart money strategies emphasize preparation, patience, and precision. By applying these principles consistently, retail traders can shift from reactive decision-making to proactive, informed, and strategic market engagement.
Managing Market Volatility Through Smart Trade ExecutionUnderstanding Market Volatility
Before delving into trade execution, it is essential to understand what drives market volatility. Volatility refers to the degree of variation in the price of a security or market index over a given period. High volatility indicates large price swings, while low volatility suggests stability.
Key Drivers of Volatility
Macroeconomic Factors: Interest rate changes, inflation data, GDP growth, and employment figures can cause sharp market reactions. For example, an unexpected hike in interest rates by a central bank can trigger sudden sell-offs in equities.
Geopolitical Events: Political instability, trade disputes, and conflicts often lead to market uncertainty. These events may not directly affect fundamentals but can create panic-driven price movements.
Earnings Announcements: Quarterly earnings reports can lead to significant stock-specific volatility, particularly when results deviate from analyst expectations.
Liquidity Conditions: Thinly traded securities or markets with low liquidity are more prone to extreme price swings.
Market Sentiment and Psychology: Fear and greed are powerful forces. Herd behavior and panic selling amplify volatility, creating both risk and opportunity.
Volatility is not inherently negative. Traders often thrive in volatile markets because price swings can create opportunities for profit—but only if executed with precision.
The Importance of Smart Trade Execution
Trade execution refers to the process of placing and completing buy or sell orders in the market. Smart execution is more than just entering an order; it involves strategically planning when, how, and at what price the trade is executed to minimize risk and maximize efficiency.
Key benefits of smart trade execution include:
Reduced Market Impact: Large orders executed without strategy can move the market against the trader. Smart execution breaks orders into smaller chunks or uses algorithms to minimize price disruption.
Lower Transaction Costs: Strategic execution can reduce costs like bid-ask spreads, slippage, and commissions.
Enhanced Risk Management: By using techniques like limit orders or conditional orders, traders can control exposure and avoid being caught on the wrong side of sudden volatility.
Improved Profitability: Capturing favorable entry and exit points allows traders to take advantage of volatility instead of being hurt by it.
Core Strategies for Managing Volatility Through Trade Execution
Effective trade execution during volatile periods involves a combination of planning, technology, and disciplined decision-making. Here are the core strategies:
1. Algorithmic Trading
Algorithmic trading involves using computer programs to execute orders based on pre-defined rules. These rules may include timing, price, volume, or other market conditions.
Benefits in Volatile Markets:
Precision and Speed: Algorithms can react to market changes faster than humans, executing trades in milliseconds.
Reduced Emotional Bias: Volatile markets often trigger fear or greed, but algorithms stick to the plan.
Customizable Execution Strategies: Traders can use algorithms for Volume Weighted Average Price (VWAP), Time Weighted Average Price (TWAP), or other execution tactics that minimize market impact.
2. Use of Limit Orders
Limit orders allow traders to set a maximum buying price or minimum selling price, providing control over execution.
Advantages:
Protects against unexpected price swings.
Ensures that trades are executed at desired levels.
Reduces the risk of slippage in volatile conditions.
Example: A trader wants to buy shares of a volatile stock priced around ₹500. Instead of placing a market order, they set a limit order at ₹495. If the market dips, the order executes at or below ₹495, preventing overpaying.
3. Risk-Based Position Sizing
Position sizing involves determining the amount of capital allocated to each trade based on risk tolerance and market conditions.
In Volatile Markets:
Reduce position size to manage exposure.
Increase diversification to avoid concentrated risk.
Use risk/reward ratios to guide entry and exit points.
Practical Tip: Traders often risk only 1-2% of their total capital per trade in highly volatile conditions to preserve capital.
4. Stop-Loss and Conditional Orders
Stop-loss orders automatically exit positions when a security reaches a predetermined price. Conditional orders, like stop-limit or trailing stops, provide more sophisticated control.
Benefits:
Prevents catastrophic losses during sudden market swings.
Allows traders to lock in profits automatically.
Reduces the need for constant market monitoring.
Example: In a volatile market, a stock trading at ₹1,000 could quickly drop to ₹900. A stop-loss order at ₹950 automatically exits the position, protecting the trader from larger losses.
5. Diversification Across Assets and Instruments
Diversification is a traditional risk management tool that works well in volatile markets. By spreading exposure across multiple assets—equities, commodities, currencies, or derivatives—traders reduce the impact of adverse moves in any single instrument.
Advanced Approach:
Use hedging strategies such as options or futures to protect positions.
Implement pairs trading, where gains in one asset offset losses in another.
Rotate positions between low-volatility and high-volatility assets based on market cycles.
6. Real-Time Market Data and Analytics
Having access to high-quality, real-time data is critical for smart execution. Price feeds, order book data, and market depth provide insights into liquidity, momentum, and potential price swings.
Advantages:
Identify support and resistance levels in volatile conditions.
Anticipate liquidity gaps that could affect execution.
Adjust trade strategies dynamically based on live market information.
Example: A trader notices that a sudden spike in volume is concentrated in a few price levels. Using this information, they can place limit orders at levels that maximize execution probability while minimizing slippage.
7. Dynamic Hedging
Hedging involves taking positions that offset potential losses in an existing portfolio. In volatile markets, dynamic hedging adjusts hedge positions continuously based on changing market conditions.
Common Techniques:
Options hedging to limit downside risk.
Futures contracts to lock in prices.
Cross-asset hedging, such as balancing equity exposure with commodity or currency positions.
8. Psychological Discipline and Execution Routine
Volatility tests a trader’s mental discipline. Even the best execution strategies fail if emotions dominate decision-making.
Key Practices:
Stick to pre-defined execution rules and risk parameters.
Avoid impulsive trades during sharp market moves.
Review trades post-execution to refine strategies and improve performance.
Technology and Tools for Smart Execution
Modern trading is heavily technology-driven. Smart execution relies on tools that optimize order placement, monitor market conditions, and automate risk management.
1. Trading Platforms
Advanced trading platforms offer features like algorithmic trading, conditional orders, market scanning, and portfolio management.
2. Execution Management Systems (EMS)
EMS are designed for professional traders to manage high-volume orders across multiple markets and venues efficiently. They optimize order routing and reduce execution costs.
3. Market Analytics and AI
Artificial intelligence and machine learning algorithms analyze historical and real-time market data to identify patterns and predict short-term volatility. This information can be integrated into execution strategies.
4. Low-Latency Infrastructure
Speed is critical in volatile markets. Low-latency connections to exchanges and co-located servers enable faster order execution, reducing slippage and improving profitability.
Best Practices for Managing Volatility Through Execution
Plan Before You Trade: Define entry, exit, and risk parameters before market opens.
Use Technology Wisely: Integrate algorithmic strategies and analytics tools.
Control Position Size: Adjust exposure based on market conditions.
Diversify: Spread risk across instruments and asset classes.
Stay Disciplined: Avoid emotional trading; stick to pre-defined rules.
Continuously Monitor: Track execution performance and adjust strategies dynamically.
Conclusion
Managing market volatility is both an art and a science. While volatility introduces uncertainty, it also creates opportunities for informed traders and investors. Smart trade execution—leveraging technology, disciplined strategies, and risk management—serves as the bridge between potential risk and profitable outcomes.
By understanding market drivers, using advanced execution techniques, and maintaining psychological discipline, traders can navigate volatile markets with confidence, protect capital, and achieve long-term success. In today’s fast-moving financial landscape, mastering smart trade execution is not just advantageous; it is essential.
Volatility may never disappear from financial markets, but with intelligent execution, it becomes a tool for growth rather than a source of fear.
Option Trading 1. Introduction to Options
In the world of financial markets, investors and traders are always looking for instruments that allow them flexibility, leverage, and opportunities to manage risks. One of the most popular derivatives that provide such opportunities is options trading.
An option is a financial contract between two parties: a buyer and a seller. The buyer of the option gets the right, but not the obligation, to buy or sell an underlying asset (like stocks, indices, or commodities) at a predetermined price within a specified time. The seller (also called the option writer) has the obligation to fulfill the contract if the buyer decides to exercise it.
This feature—right without obligation—is what makes options unique compared to other financial instruments.
2. Basic Terminology
Before diving deeper, let’s clarify some key terms:
Call Option: Gives the buyer the right to buy the underlying asset at a fixed price (strike price).
Put Option: Gives the buyer the right to sell the underlying asset at a fixed price.
Strike Price: The pre-agreed price at which the buyer can buy or sell the underlying.
Premium: The cost paid by the option buyer to the seller for the right.
Expiration Date: The last date the option is valid.
In the Money (ITM): When exercising the option is profitable (e.g., stock price above strike for calls, below strike for puts).
Out of the Money (OTM): When exercising leads to a loss, so the buyer won’t exercise.
At the Money (ATM): When the stock price is very close to the strike price.
3. How Options Work – An Example
Suppose stock ABC Ltd. is trading at ₹100.
You expect the stock to rise.
You buy a Call Option with a strike price of ₹105 for a premium of ₹3, expiring in one month.
Scenario 1: Stock rises to ₹115
You exercise your right to buy at ₹105 and immediately sell at ₹115.
Profit = (115 – 105) – 3 = ₹7 per share.
Scenario 2: Stock stays at ₹100
Buying at ₹105 makes no sense, so you let the option expire.
Loss = premium paid = ₹3.
This shows the limited loss (premium only) but unlimited profit potential for an option buyer.
4. Types of Options Trading Participants
There are broadly four categories:
Call Buyers – bullish traders expecting price rise.
Put Buyers – bearish traders expecting price fall.
Call Sellers – take opposite side of call buyers, hoping price stays flat or falls.
Put Sellers – take opposite side of put buyers, hoping price stays flat or rises.
Buyers take on risk by paying premiums, while sellers assume obligations but earn premiums upfront.

Part 2 Support and ResistanceHow Options Work
Options allow traders to speculate or hedge in different market conditions. For example:
Buying a Call Option: If an investor expects a stock’s price to rise, they can buy a call option. If the stock price exceeds the strike price, the option holder can either sell the option at a profit or exercise it to buy the stock at a lower price.
Buying a Put Option: If an investor anticipates a decline in the stock price, they can buy a put option. If the stock price falls below the strike price, the option holder can sell the stock at a higher-than-market price or sell the option for a profit.
Options can also be sold/written, allowing traders to earn the premium as income. However, selling options carries significant risk because the seller may have unlimited loss potential if the market moves against them.
Options Pricing and Valuation
The value of an option is influenced by intrinsic value and time value:
Intrinsic Value: The difference between the underlying asset’s current price and the strike price. For example:
Call Option: Intrinsic Value = Max(0, Current Price – Strike Price)
Put Option: Intrinsic Value = Max(0, Strike Price – Current Price)
Time Value: The portion of the premium that accounts for the time remaining until expiry and the expected volatility of the underlying asset. Options with more time until expiration generally have higher premiums because there’s a greater chance for the underlying asset to move favorably.
Additionally, models such as the Black-Scholes model are used by traders and institutions to estimate theoretical option prices, considering factors like the underlying price, strike price, time to expiration, volatility, and interest rates.
Benefits of Options Trading
Options trading offers several advantages compared to traditional stock trading:
Leverage: Options allow investors to control a large number of shares with a relatively small investment. This amplifies potential gains (and losses).
Flexibility: Traders can use options to speculate, hedge, or generate income, offering multiple strategic possibilities.
Risk Management: Options can act as insurance for existing positions. For instance, buying a put option can protect a stock holding from a sharp decline.
Profit in Any Market Condition: Options strategies can be designed to profit in bullish, bearish, or even neutral markets.

Sentiment-Driven Surges: Understanding Modern Market Explosions1. Market Sentiment: Definition and Importance
1.1 What is Market Sentiment?
Market sentiment refers to the overall attitude of investors toward a particular security or financial market. It represents the collective feelings, perceptions, and expectations of market participants about future price movements. Unlike fundamental analysis, which evaluates intrinsic value based on financial metrics, sentiment analysis focuses on how participants feel and act.
Market sentiment can be bullish (positive, expecting price increases) or bearish (negative, expecting price declines). It often drives momentum trades—buying when others buy, selling when others sell—creating self-reinforcing feedback loops.
1.2 Why Sentiment Matters
While fundamentals provide the baseline value, sentiment often dictates short-term market dynamics. Stocks with strong earnings may stagnate if investor sentiment is negative, while speculative assets can skyrocket without fundamental support, as seen in numerous “meme stock” rallies.
Key points:
Sentiment amplifies price volatility.
It can override fundamental signals in the short term.
It often creates market bubbles and flash crashes.
2. Drivers of Sentiment-Driven Surges
Several factors can trigger sentiment-driven market explosions. Understanding these drivers is essential for anticipating sudden price movements.
2.1 Social Media and Retail Trading Communities
In the digital era, platforms like Twitter, Reddit, Telegram, and Discord allow retail investors to coordinate actions rapidly. The 2021 GameStop saga is a prime example:
Retail traders organized online to push the stock price upward.
Short sellers were forced to cover positions, creating a short squeeze.
Price movement was largely independent of fundamentals.
Impact: Social media has transformed market psychology into a highly visible, amplifiable force. Viral narratives can trigger mass buying or selling within hours.
2.2 Algorithmic and High-Frequency Trading (HFT)
Algorithms react to market sentiment indicators, news, and price trends faster than humans can. Sentiment-based trading algorithms scan news feeds, tweets, and financial forums to predict market direction.
Positive sentiment triggers buying algorithms, increasing upward momentum.
Negative sentiment triggers selling algorithms, exacerbating declines.
Impact: HFT accelerates sentiment-driven surges, making them more extreme and less predictable.
2.3 Economic Data and Policy Announcements
Macroeconomic events, central bank policy changes, or earnings announcements can shape sentiment quickly.
Rate hikes: Markets may panic or rally based on perceived economic impact.
Inflation data: Surprising figures can trigger bullish or bearish sentiment.
Earnings surprises: Positive surprises can ignite rapid buying in stocks, sometimes overshooting intrinsic values.
2.4 Herding Behavior
Humans have an innate tendency to follow the crowd. Once a price starts moving, others often join in, creating momentum:
Fear of missing out (FOMO) amplifies upward surges.
Panic selling accelerates downward crashes.
Impact: Herding behavior often turns small sentiment shifts into large market movements.
3. Mechanisms Behind Market Explosions
Market surges do not occur in isolation. They are the result of interconnected feedback loops that magnify sentiment.
3.1 Momentum and Feedback Loops
When investors see prices rising, they buy more, driving prices higher—a self-reinforcing loop. Conversely, negative sentiment triggers rapid sell-offs. Feedback loops are amplified by:
Social media chatter
Trading algorithms
News coverage emphasizing price movements
3.2 Short Squeezes and Gamma Squeezes
Short positions are vulnerable during sentiment surges:
Short squeeze: Short sellers must buy back shares as prices rise, pushing prices further upward.
Gamma squeeze: Options market hedging by institutions forces more buying as underlying stock prices rise.
These mechanisms can make sentiment-driven surges explosive, often detached from fundamentals.
3.3 Liquidity and Market Depth
In low-liquidity conditions, small buy or sell orders can cause large price swings. Market sentiment can exploit these situations, leading to sharp, short-term surges.
Retail-driven markets often exhibit low liquidity, enhancing volatility.
Institutional players can manipulate perception to induce sentiment-driven movements.
4. Case Studies: Modern Market Explosions
4.1 GameStop (GME) – 2021
Coordinated retail buying triggered a massive short squeeze.
Price rose from $20 to over $400 in weeks.
Media coverage further fueled sentiment, creating global awareness.
Lesson: Social media combined with short vulnerabilities can cause extreme surges.
4.2 AMC Entertainment – 2021
Retail investors used sentiment-driven strategies to push stock prices up.
Options trading amplified the impact via gamma squeezes.
Fundamental financial health was largely irrelevant during the surge.
Lesson: Sentiment can dominate fundamentals, especially in low-liquidity assets.
4.3 Cryptocurrencies
Bitcoin and altcoins frequently experience sentiment-driven surges.
Tweets from influential figures (e.g., Elon Musk) can trigger massive price swings.
Speculative trading, FOMO, and global access make crypto highly sentiment-sensitive.
Lesson: Digital assets are extremely prone to narrative-driven price explosions.
5. Measuring Market Sentiment
To understand and anticipate surges, traders need reliable sentiment metrics.
5.1 Technical Indicators
Relative Strength Index (RSI): Measures overbought or oversold conditions.
Moving averages: Trends combined with sentiment data can indicate momentum.
Volume spikes: Often signal emerging sentiment-driven activity.
5.2 Social Media Analytics
Tweet volume and sentiment analysis: High positive mention frequency can indicate bullish momentum.
Reddit/Discord monitoring: Large posts and discussions can foreshadow retail-driven surges.
5.3 News and Media Sentiment
AI-powered sentiment analysis scans headlines and financial news.
Positive coverage often triggers short-term buying, negative coverage triggers selling.
5.4 Options Market Sentiment
High open interest and unusual options activity often precede price surges.
Call/put ratios indicate market expectations.
6. Trading Strategies Around Sentiment Surges
Traders can leverage sentiment-driven dynamics, but risk management is crucial.
6.1 Momentum Trading
Buy when sentiment is strongly bullish and prices are rising.
Use technical indicators for entry and exit points.
Watch volume and volatility for confirmation.
6.2 Contrarian Trading
Identify overextended sentiment-driven rallies.
Sell into extreme optimism or buy during panic.
Requires careful risk management and timing.
6.3 Event-Driven Sentiment Trades
Track scheduled events like earnings releases, policy announcements, or influencer posts.
Anticipate sentiment reactions and position accordingly.
6.4 Risk Management
Set stop-loss and take-profit levels to manage volatility.
Avoid over-leveraging during explosive surges.
Diversify exposure to minimize emotional decision-making.
7. Risks and Challenges
While sentiment-driven surges offer opportunities, they carry significant risks:
Volatility: Prices can reverse sharply, leading to losses.
Speculation vs. fundamentals: Trading purely on sentiment ignores intrinsic value.
Market manipulation: Pump-and-dump schemes exploit sentiment.
Psychological pressure: FOMO and panic can cloud judgment.
Traders must balance the allure of explosive gains with the discipline of risk control.
Conclusion
Sentiment-driven surges represent a paradigm shift in modern financial markets. While traditional fundamentals remain important, the rapid dissemination of information, social media influence, algorithmic trading, and psychological behaviors have created conditions where sentiment alone can trigger explosive market moves.
Understanding these surges requires a multi-dimensional approach—blending behavioral finance, technical analysis, social media monitoring, and risk management. For traders, recognizing sentiment signals, anticipating herding behavior, and using disciplined strategies can turn volatility into opportunity.
Ultimately, modern markets are no longer just about what a company is worth—they are about what investors feel it is worth, and sometimes, those feelings can move the market faster than any earnings report ever could.
Event-Driven Trading: Strategies Around Quarterly Earnings1. Understanding Event-Driven Trading
Event-driven trading refers to strategies that seek to exploit short-term price movements caused by corporate or macroeconomic events. These events can include mergers and acquisitions (M&A), regulatory announcements, dividend announcements, product launches, and, most notably, quarterly earnings reports. Event-driven traders operate on the principle that markets do not always price in the full implications of upcoming news, creating opportunities for alpha generation.
Earnings announcements are particularly potent because they provide concrete, quantifiable data on a company’s financial health, guiding investor expectations for revenue, profit margins, cash flow, and future outlook. Given the structured release schedule of quarterly earnings, traders can plan their strategies in advance, combining statistical, fundamental, and technical analyses.
2. Anatomy of Quarterly Earnings Reports
Quarterly earnings reports typically contain several key components:
Revenue and Earnings Per Share (EPS): Core indicators of company performance. Earnings surprises—positive or negative—often trigger substantial stock price moves.
Guidance: Management projections for future performance can influence market sentiment.
Margins: Gross, operating, and net margins indicate operational efficiency.
Cash Flow and Balance Sheet Metrics: Provide insight into liquidity, debt levels, and overall financial health.
Management Commentary: Offers qualitative insights into business strategy, risks, and opportunities.
Understanding these elements is critical for traders seeking to anticipate market reactions. Historically, stocks tend to exhibit heightened volatility during earnings releases, creating both opportunities and risks for traders.
3. Market Reaction to Earnings
The stock market often reacts swiftly to earnings announcements, with price movements reflecting the degree to which actual results differ from expectations. The reaction is influenced by several factors:
Earnings Surprise: The difference between actual earnings and analyst consensus. Positive surprises often lead to price spikes, while negative surprises can trigger sharp declines.
Guidance Changes: Upward or downward revisions to guidance significantly impact investor sentiment.
Sector Trends: A company’s performance relative to industry peers can amplify market reactions.
Market Conditions: Broader economic indicators and market sentiment affect the magnitude of earnings-driven price movements.
Traders must understand that markets may overreact or underreact initially, presenting opportunities for both short-term and medium-term trades.
4. Event-Driven Trading Strategies Around Earnings
4.1 Pre-Earnings Strategies
Objective: Position the portfolio ahead of anticipated earnings to profit from expected price movements.
Straddle/Strangle Options Strategy
Buy both call and put options with the same expiration (straddle) or different strike prices (strangle).
Profitable when stock exhibits significant volatility regardless of direction.
Works well when implied volatility is lower than expected post-earnings movement.
Directional Bets
Traders with conviction about earnings outcomes may take long or short positions in anticipation of the report.
Requires robust fundamental analysis and sector insights.
Pairs Trading
Involves taking offsetting positions in correlated stocks within the same sector.
Reduces market risk while exploiting relative performance during earnings season.
4.2 Post-Earnings Strategies
Objective: React to market inefficiencies created by unexpected earnings results.
Earnings Drift Strategy
Stocks that beat earnings expectations often continue to trend upward in the days following the announcement, known as the “post-earnings announcement drift.”
Conversely, negative surprises may lead to sustained declines.
Traders can exploit these trends using momentum-based techniques.
Volatility Arbitrage
Earnings reports increase implied volatility in options pricing.
Traders can exploit discrepancies between expected and actual volatility post-announcement.
Fade the Initial Reaction
Sometimes markets overreact to earnings news.
Traders take contrarian positions against extreme initial moves, anticipating a correction.
5. Analytical Tools and Techniques
Successful event-driven trading relies heavily on data, models, and analytical frameworks.
5.1 Fundamental Analysis
Study revenue, EPS, margins, guidance, and sector performance.
Compare against historical data and analyst consensus.
Evaluate macroeconomic factors affecting the company.
5.2 Technical Analysis
Identify key support and resistance levels.
Use indicators like Bollinger Bands, RSI, and moving averages to gauge price momentum pre- and post-earnings.
5.3 Sentiment Analysis
Monitor social media, news releases, and analyst reports for market sentiment.
Positive sentiment can amplify price moves, while negative sentiment can exacerbate declines.
5.4 Quantitative Models
Statistical models can predict probability of earnings surprises and subsequent price movements.
Machine learning algorithms are increasingly used to forecast earnings-driven volatility and trade outcomes.
6. Risk Management in Earnings Trading
Event-driven trading carries elevated risk due to volatility and uncertainty. Effective risk management strategies include:
Position Sizing
Limit exposure per trade to manage potential losses from unexpected moves.
Stop-Loss Orders
Predefined exit points prevent catastrophic losses.
Diversification
Spread trades across sectors or asset classes to reduce idiosyncratic risk.
Hedging
Use options or futures contracts to offset directional risk.
Liquidity Assessment
Ensure sufficient market liquidity to enter and exit positions without excessive slippage.
Conclusion
Event-driven trading around quarterly earnings offers substantial opportunities for informed traders. By combining fundamental analysis, technical tools, options strategies, and disciplined risk management, traders can capitalize on the predictable yet volatile nature of earnings season. While challenges exist, a structured and strategic approach allows market participants to profit from both anticipated and unexpected outcomes.
The key to success lies in preparation, flexibility, and understanding market psychology. Traders who master earnings-driven strategies can achieve consistent performance, turning periodic corporate disclosures into actionable investment opportunities.
Market Reform Fallout: Opportunities Hidden in UncertaintyIntroduction
In the ever-evolving landscape of global finance, market reforms—whether initiated by governments, central banks, or supranational entities—often usher in periods of heightened uncertainty. While such reforms aim to enhance economic stability, competitiveness, and growth, they can also lead to market volatility and investor apprehension. However, history has shown that amidst this uncertainty lie opportunities for those with the acumen to identify and capitalize on them.
This article delves into the multifaceted impacts of market reforms, exploring both the challenges they present and the avenues they open for astute investors and policymakers.
The Nature of Market Reforms
Market reforms encompass a broad spectrum of policy changes, including:
Deregulation: Reducing government intervention in markets to foster competition.
Privatization: Transferring state-owned enterprises to private ownership.
Trade Liberalization: Lowering tariffs and non-tariff barriers to encourage international trade.
Monetary and Fiscal Adjustments: Altering interest rates, taxation, and government spending to influence economic activity.
While these reforms are designed to stimulate economic growth and efficiency, their implementation can lead to short-term disruptions as markets adjust to new realities.
Fallout from Market Reforms
The immediate aftermath of market reforms often includes:
Market Volatility: Sudden policy shifts can lead to sharp market reactions, affecting asset prices and investor sentiment.
Sectoral Disruptions: Industries that were previously protected may face increased competition, leading to restructuring or closures.
Regulatory Uncertainty: Ambiguities in new policies can create a challenging environment for businesses and investors.
For instance, the European Union's ongoing review of merger policies has created uncertainty in the corporate sector, as companies await clearer guidelines before pursuing consolidation strategies
Identifying Opportunities Amidst Uncertainty
Despite the challenges, periods of uncertainty following market reforms can present unique opportunities:
Emerging Market Investments: Countries undergoing reforms often experience growth in sectors like infrastructure, technology, and consumer goods. For example, South Africa's financial markets have soared despite weak economic data and slow reforms, indicating potential in emerging markets
Strategic Mergers and Acquisitions: Regulatory changes can lead to consolidation in certain industries, presenting opportunities for mergers and acquisitions. BNP Paribas anticipates future opportunities in European investment banking driven by expected restructuring and refinancing
Policy-Driven Sectors: Reforms in areas like renewable energy, healthcare, and education can create investment opportunities in companies aligned with new policy directions.
Diversification Strategies: Investors can mitigate risks by diversifying portfolios across regions and sectors that are less affected by the reforms.
Case Studies of Reform-Induced Opportunities
South Africa: Despite slow economic growth and high unemployment, South Africa's financial markets have performed strongly, with the Johannesburg Stock Exchange reaching record highs. Analysts attribute this optimism to strong commodity prices and perceived political stability
European Union: The EU's review of merger policies has created uncertainty, but also potential for consolidation in industries like technology and manufacturing. Companies that can navigate the regulatory landscape may find opportunities for growth.
United States: The Federal Reserve's balancing act in a politically volatile landscape presents both risks and opportunities. Sectors sensitive to interest rates, such as real estate and high-yield bonds, remain vulnerable, while defensive assets like Treasury securities and gold may gain allure as hedging tools
Strategies for Navigating Reform-Induced Uncertainty
Investors and policymakers can adopt several strategies to navigate the uncertainties arising from market reforms:
Scenario Planning: Developing multiple scenarios to anticipate potential outcomes and prepare accordingly.
Stakeholder Engagement: Engaging with policymakers to influence the design and implementation of reforms.
Risk Management: Employing hedging techniques and diversifying investments to mitigate potential losses.
Monitoring Indicators: Keeping an eye on key economic and political indicators that signal changes in the reform trajectory.
Conclusion
While market reforms can lead to periods of uncertainty, they also create avenues for growth and innovation. By adopting a proactive and informed approach, investors and policymakers can turn potential challenges into opportunities, driving progress and prosperity in the evolving global market landscape.
Part 4 Institutional Trading Key Terms in Options Trading
Understanding options requires familiarity with several technical terms:
Strike Price: The predetermined price at which the underlying asset can be bought (call) or sold (put).
Expiration Date: The last date on which the option can be exercised. Options lose value after this date.
Premium: The price paid to purchase the option, influenced by intrinsic value and time value.
Intrinsic Value: The difference between the underlying asset’s price and the strike price if favorable to the option holder.
Time Value: The portion of the premium reflecting the probability of the option becoming profitable before expiration.
In-the-Money (ITM): A call is ITM if the underlying price > strike price; a put is ITM if the underlying price < strike price.
Out-of-the-Money (OTM): A call is OTM if the underlying price < strike price; a put is OTM if the underlying price > strike price.
At-the-Money (ATM): When the underlying price ≈ strike price.
How Options Trading Works
Options trading involves buying and selling contracts on exchanges like the National Stock Exchange (NSE) in India, or over-the-counter (OTC) markets globally. Each contract represents a fixed quantity of the underlying asset (e.g., 100 shares per contract in equity options).
The price of an option, called the option premium, is determined by multiple factors:
Underlying Price: Directly impacts call and put options differently. Calls gain value as the underlying price rises; puts gain as it falls.
Strike Price: The relationship of the strike to the current asset price defines intrinsic value.
Time to Expiration: More time increases the option’s potential to become profitable, adding to the premium.
Volatility: Higher expected price fluctuations increase the chance of profit, making options more expensive.
Interest Rates and Dividends: Slightly affect option pricing, especially for longer-term contracts.
Options traders use strategies to profit in various market conditions. They can combine calls and puts to create complex structures like spreads, straddles, strangles, and iron condors.
Popular Options Trading Strategies
Covered Call: Holding the underlying asset and selling a call option to earn premium. It generates income but limits upside potential.
Protective Put: Buying a put on a held asset to limit losses during downturns. Essentially an insurance policy.
Straddle: Buying a call and a put at the same strike price and expiry, betting on high volatility regardless of direction.
Strangle: Similar to a straddle but with different strike prices, cheaper but requires larger movements to profit.
Spreads: Simultaneously buying and selling options of the same type with different strikes or expiries to reduce risk or capitalize on specific movements. Examples include bull call spreads and bear put spreads.
These strategies allow traders to tailor risk/reward profiles, hedge portfolios, or speculate with leverage.

Volatility Index (India VIX) Trading1. Introduction to Volatility and VIX
Volatility is the statistical measure of the dispersion of returns for a given security or market index. In simpler terms, it indicates how much the price of an asset swings, either up or down, over a period of time. Volatility can be driven by market sentiment, economic data, geopolitical events, or unexpected corporate announcements.
The India VIX, or the Volatility Index of India, is a real-time market index that represents the expected volatility of the Nifty 50 index over the next 30 calendar days. It is often referred to as the "fear gauge" because it tends to rise sharply when the market anticipates turbulence or uncertainty.
High VIX Value: Indicates high market uncertainty or expected large swings in Nifty.
Low VIX Value: Indicates low expected volatility, reflecting a stable market environment.
India VIX is calculated using the Black–Scholes option pricing model, taking into account the price of Nifty options with near-term and next-term expiry. This makes it a forward-looking indicator rather than a retrospective measure.
2. Significance of India VIX in Trading
India VIX is not a tradeable index itself but a crucial sentiment and risk gauge for traders. Its applications in trading include:
Market Sentiment Analysis:
Rising VIX indicates fear and uncertainty. Traders may reduce equity exposure or hedge portfolios.
Falling VIX suggests calm markets and often coincides with bullish trends in equity indices.
Risk Management:
Portfolio managers and traders use VIX levels to determine stop-loss levels, hedge sizes, and option strategies.
Predictive Insights:
Historical data shows that extreme spikes in VIX often precede market bottoms, and extremely low VIX levels may indicate complacency, often preceding corrections.
Derivative Strategies:
India VIX futures and options are actively traded, providing opportunities for hedging and speculative strategies.
3. How India VIX is Calculated
Understanding the calculation of VIX is essential for professional trading. India VIX uses a methodology similar to the CBOE VIX in the U.S., which focuses on expected volatility derived from option prices:
Step 1: Option Selection
Nifty call and put options with near-term and next-term expiries are chosen, typically out-of-the-money (OTM).
Step 2: Compute Implied Volatility
Using the prices of these options, the market’s expectation of volatility is derived through a modified Black–Scholes formula.
Step 3: Weighting and Smoothing
The implied volatilities of different strike prices are combined and weighted to produce a single expected volatility for the next 30 days.
Step 4: Annualization
The resulting number is annualized to reflect volatility in percentage terms, expressed as annualized standard deviation.
Key Point: India VIX does not predict the direction of the market; it only predicts the magnitude of expected moves.
4. Factors Influencing India VIX
India VIX moves based on a variety of market, economic, and geopolitical factors:
Market Events:
Sudden crashes or rallies in Nifty significantly affect VIX.
For example, a 2–3% overnight fall in Nifty can spike VIX by 10–15%.
Economic Data:
GDP growth announcements, inflation data, interest rate decisions, and corporate earnings influence volatility expectations.
Global Events:
US Fed decisions, crude oil volatility, geopolitical tensions (e.g., wars, sanctions) impact India VIX.
Market Liquidity:
During thin trading sessions or holidays in global markets, implied volatility in options rises, increasing VIX.
Investor Behavior:
Panic selling, FII flows, and retail sentiment shifts can drive VIX up sharply.
5. Trading Instruments Related to India VIX
While you cannot directly trade India VIX like a stock, several instruments allow traders to gain exposure to volatility:
5.1. India VIX Futures
Traded on NSE, futures contracts allow traders to speculate or hedge against volatility.
Futures are settled in cash based on the final India VIX value at expiry.
Contract months are usually current month and next two months, allowing short- to medium-term strategies.
5.2. India VIX Options
Like futures, VIX options are European-style options, cash-settled at expiry.
Traders can use calls and puts to bet on rising or falling volatility.
Options provide leveraged exposure, but risk is high due to volatility’s non-directional nature.
5.3. Equity Hedging via VIX
VIX can be used to structure protective strategies like buying Nifty puts or using collars.
When VIX is low, hedging costs are cheaper; when high, it is expensive.
6. Types of India VIX Trading Strategies
6.1. Directional Volatility Trading
Buy VIX Futures/Options when anticipating a sharp market drop or increased uncertainty.
Sell VIX Futures/Options when expecting market stability or a decrease in fear.
6.2. Hedging Equity Portfolios
Traders holding Nifty positions may buy VIX calls or futures to protect against sudden drops.
Example: If you hold long Nifty positions and expect a 1-week correction, buying VIX futures acts as an insurance.
6.3. Spread Trading
Calendar Spreads: Buy near-month VIX futures and sell next-month futures to profit from volatility curve changes.
Option Spreads: Buying a call spread or put spread on VIX options reduces risk while maintaining exposure to expected volatility moves.
6.4. Arbitrage Opportunities
Occasionally, disparities between VIX and realized volatility in Nifty options create arbitrage opportunities.
Advanced traders monitor mispricing to exploit short-term inefficiencies.
6.5. Mean Reversion Strategy
India VIX is historically mean-reverting. Extreme highs (>30) often come down, while extreme lows (<10) eventually rise.
Traders can adopt counter-trend strategies to capitalize on reversion toward the mean.
7. Risk Factors in VIX Trading
High Volatility:
While VIX measures volatility, the instrument itself is volatile. Sharp reversals can occur without warning.
Complex Pricing:
Futures and options on VIX depend on implied volatility, making pricing sensitive to market dynamics.
Liquidity Risk:
VIX options and futures have lower liquidity than Nifty, potentially leading to wider spreads.
Non-Directional Nature:
VIX measures magnitude, not direction. A rising market can spike VIX if the potential for sharp swings exists.
Event Risk:
Unexpected macroeconomic or geopolitical events can lead to sudden spikes.
8. Conclusion
India VIX trading is a highly specialized, nuanced field combining market sentiment analysis, technical skills, and risk management acumen. While it offers opportunities to profit from volatility and hedge equity exposure, it also carries substantial risks due to its non-linear, non-directional, and highly sensitive nature.
To succeed in India VIX trading, one must:
Understand the underlying calculation and drivers of volatility.
Combine VIX insights with market structure and macroeconomic analysis.
Adopt disciplined risk management practices, including stop-losses and position sizing.
Stay updated with global and domestic events impacting market sentiment.
For traders and investors, India VIX is more than a “fear gauge.” It is a strategic tool that provides a unique window into market psychology, enabling better-informed decisions in both trading and portfolio management.
US Fed Policies & Indian Markets1. Introduction to U.S. Federal Reserve Policies
The U.S. Federal Reserve, as the central bank of the United States, plays a pivotal role in shaping global economic conditions through its monetary policy decisions. The primary tools at its disposal include:
Interest Rate Adjustments: Modifying the federal funds rate to influence borrowing costs.
Open Market Operations: Buying or selling government securities to regulate money supply.
Quantitative Easing: Purchasing longer-term securities to inject liquidity into the economy.
These policies aim to achieve the Fed's dual mandate: maximum employment and stable prices. However, their repercussions extend beyond U.S. borders, impacting emerging markets like India.
2. Transmission Mechanisms to Indian Markets
2.1 Foreign Capital Flows
The differential between U.S. and Indian interest rates significantly influences foreign institutional investments (FIIs) in India. When the Fed raises interest rates, U.S. assets become more attractive due to higher returns, leading to capital outflows from emerging markets, including India. Conversely, a rate cut by the Fed can make U.S. assets less appealing, prompting FIIs to seek higher returns in Indian equities and debt markets.
For instance, after the Fed's recent 25 basis point rate cut, Indian stock markets experienced a positive response, with indices like the BSE Sensex and Nifty 50 showing gains, driven by increased foreign investor interest
Reuters
.
2.2 Currency Exchange Rates
The U.S. dollar's strength is inversely related to the attractiveness of emerging market currencies. A rate hike by the Fed typically strengthens the dollar, leading to depreciation of the Indian rupee. This depreciation can increase the cost of imports and contribute to inflationary pressures within India. On the other hand, a rate cut can weaken the dollar, potentially leading to a stronger rupee and easing import costs
Reuters
.
2.3 Inflationary Pressures
U.S. monetary policy indirectly affects global commodity prices. A stronger dollar, resulting from Fed rate hikes, can lead to higher prices for commodities priced in dollars, such as oil. Since India is a major importer of oil, increased global oil prices can lead to higher domestic inflation, impacting the cost of living and economic stability.
3. Sectoral Impacts in India
3.1 Information Technology (IT) Sector
The Indian IT sector is significantly influenced by U.S. demand, as a substantial portion of its revenue is derived from American clients. A rate cut by the Fed can stimulate the U.S. economy, leading to increased IT spending and benefiting Indian IT companies. For example, after the recent Fed rate cut, Indian IT stocks experienced a surge, reflecting investor optimism
Reuters
.
3.2 Banking and Financial Services
Indian banks with substantial foreign borrowings are directly affected by changes in U.S. interest rates. A rate cut can reduce their borrowing costs, improving profitability. Additionally, lower U.S. yields can make Indian debt instruments more attractive to global investors, potentially leading to capital inflows and strengthening the banking sector.
3.3 Export-Oriented Industries
A stronger rupee, resulting from a weaker dollar due to Fed rate cuts, can make Indian exports more expensive and less competitive in the global market. This can adversely affect industries such as textiles, pharmaceuticals, and engineering goods.
4. Macroeconomic Implications
4.1 Economic Growth
The Fed's policies can influence global economic growth trajectories. A rate cut can stimulate global demand, benefiting Indian exports and economic growth. However, if the rate cut is perceived as a response to economic weakness, it may signal global economic challenges, potentially dampening investor sentiment in India.
4.2 Monetary Policy Coordination
The Reserve Bank of India (RBI) monitors U.S. monetary policy closely, as it may need to adjust its own policies in response. For example, if the Fed's rate cut leads to significant capital inflows into India, the RBI may intervene to prevent excessive appreciation of the rupee, which could harm export competitiveness.
5. Case Studies
5.1 2013 Taper Tantrum
In 2013, when the Fed signaled the reduction of its bond-buying program, global markets experienced turmoil. India was among the countries most affected, with the rupee depreciating sharply and foreign capital outflows escalating. This episode underscored the vulnerability of emerging markets to U.S. monetary policy shifts.
5.2 Post-2020 Pandemic Response
In response to the COVID-19 pandemic, the Fed implemented aggressive monetary easing, including rate cuts and quantitative easing. These measures led to a global liquidity surge, benefiting Indian markets through increased foreign investments and a stable currency environment.
6. Conclusion
The U.S. Federal Reserve's monetary policy decisions are instrumental in shaping global financial landscapes. For emerging markets like India, these decisions influence capital flows, currency stability, inflation, and sectoral performance. Understanding the transmission mechanisms of U.S. monetary policy is crucial for policymakers, investors, and businesses in India to navigate the complexities of the global economic environment.

Options Greeks & Advanced Hedging Strategies1. Introduction to Options
Options are derivative instruments that provide the right, but not the obligation, to buy or sell an underlying asset at a predetermined price before or on a specified expiry date. There are two main types:
Call Options – Give the holder the right to buy the underlying asset.
Put Options – Give the holder the right to sell the underlying asset.
Unlike equities, options are inherently more complex because their value is influenced by multiple variables such as underlying price, strike price, time to expiration, volatility, interest rates, and dividends. This multidimensionality is captured by the Greeks, which form the backbone of options risk management.
2. Understanding Options Greeks
The Greeks quantify the sensitivity of an option’s price to various market factors. They are indispensable for assessing risk and structuring trades. The primary Greeks are Delta, Gamma, Theta, Vega, and Rho, each serving a specific purpose.
2.1 Delta (Δ) – Price Sensitivity
Delta measures the rate of change of an option's price with respect to the price movement of the underlying asset.
Call Delta ranges from 0 to 1.
Put Delta ranges from -1 to 0.
Interpretation:
A delta of 0.6 for a call option indicates that if the underlying asset moves up by ₹1, the call option price will increase by ₹0.60.
Traders use delta to gauge the directional exposure of their portfolio, often referred to as delta exposure.
Delta Hedging:
Delta hedging is a strategy where traders neutralize the delta of a position by taking an offsetting position in the underlying asset. For example, if you hold a call option with a delta of 0.6 on 100 shares, you can short 60 shares of the underlying to make the position delta-neutral.
2.2 Gamma (Γ) – Rate of Change of Delta
Gamma measures the rate of change of delta with respect to changes in the underlying asset price.
High Gamma indicates that delta changes rapidly with underlying price movement.
Low Gamma implies delta is stable.
Importance of Gamma:
Gamma is crucial for understanding convexity risk, especially near the option’s expiry or at-the-money options.
Traders use gamma to anticipate how delta hedges will change as the market moves.
Gamma Hedging:
Gamma hedging involves balancing a portfolio such that it remains neutral to delta changes. Typically, it requires frequent adjustments because gamma fluctuates as underlying prices move.
2.3 Theta (Θ) – Time Decay
Theta represents the rate at which an option loses value as time passes, holding other factors constant.
Options are decaying assets, losing value every day due to time erosion.
Call and put options experience negative theta for holders (long positions) and positive theta for writers (short positions).
Applications:
Long options traders must account for theta decay, especially in volatile markets.
Strategies like calendar spreads or selling options exploit theta decay to generate income.
2.4 Vega (ν) – Volatility Sensitivity
Vega measures an option’s sensitivity to changes in implied volatility of the underlying asset.
Options prices increase with higher volatility (for both calls and puts).
Vega is higher for at-the-money options and long-dated options.
Volatility Trading:
Traders can take positions purely on expected volatility changes without relying on directional movement.
Long Vega positions profit from volatility spikes, while short Vega strategies benefit from declining volatility.
2.5 Rho (ρ) – Interest Rate Sensitivity
Rho measures sensitivity to changes in the risk-free interest rate.
More significant for long-term options.
A call option’s price rises with increasing interest rates, while put options decline.
Practical Relevance:
Rho is relatively minor compared to delta or vega but becomes crucial in macroeconomic shifts, especially for options with long maturities.
3. Combining Greeks for Portfolio Management
While each Greek provides specific insights, professional traders consider multiple Greeks simultaneously to manage comprehensive risk. This multidimensional approach allows traders to:
Maintain delta neutrality – minimize directional risk.
Control gamma exposure – manage rapid changes in delta.
Optimize theta decay – benefit from time erosion.
Manage vega risk – protect against volatility shocks.
Monitor rho impact – for long-term interest-sensitive trades.
Example:
A trader holding a long call may delta-hedge by shorting the underlying. If gamma is high, the hedge needs frequent adjustments. Additionally, they must consider theta decay, particularly if the position is near expiry.
4. Advanced Hedging Strategies
Hedging with options is a way to protect portfolios from adverse movements while retaining profit potential. Advanced hedging strategies involve using combinations of options, futures, and the underlying asset.
4.1 Delta Neutral Hedging
Objective: Make a portfolio insensitive to small price movements.
Method: Offset delta of options with underlying asset or other derivatives.
Example: Long call delta of 0.6 → Short 60 shares of the underlying.
Advantages:
Reduces directional risk.
Can be dynamically adjusted to changing deltas.
Limitations:
Frequent rebalancing is required due to gamma exposure.
4.2 Gamma Scalping
Objective: Profit from price swings in the underlying asset while remaining delta neutral.
Method: Buy options with high gamma. As underlying moves, delta changes are hedged dynamically, locking in profits from volatility.
Applications: Used by market makers and professional traders to extract profit from intraday volatility.
4.3 Vega Hedging
Objective: Neutralize exposure to volatility changes.
Method: Offset vega by taking positions in options with opposite volatility sensitivity (e.g., long a call and short a call with different strike prices or maturities).
Applications: Useful during earnings announcements, geopolitical events, or expected market turbulence.
4.4 Calendar and Diagonal Spreads
Calendar Spread: Buy a long-dated option and sell a short-dated option of the same strike.
Diagonal Spread: Combine different strikes and expiries.
Purpose: Exploit theta decay and volatility differences while limiting directional risk.
Example: A trader expecting stable markets but rising volatility may buy a long-term call and sell a near-term call.
4.5 Protective Puts & Collars
Protective Put: Buying a put option to safeguard a long stock position.
Collar: Combining a protective put with a covered call to limit downside while capping upside.
Applications: Hedging large equity positions during uncertain markets.
4.6 Ratio & Backspread Strategies
Ratio Spread: Buy/sell unequal number of options to balance cost and risk.
Backspread: Sell a small number of near-term options and buy a larger number of far-term options.
Use Case: Profitable in high volatility expectations, providing leveraged exposure with hedged downside.
5. Greeks-Based Risk Management
A sophisticated options trader actively monitors Greeks to:
Adjust positions dynamically – react to price, time, and volatility changes.
Measure risk-reward tradeoffs – understand potential loss in extreme scenarios.
Stress-test portfolios – simulate scenarios like sharp price jumps or volatility spikes.
Optimize hedging costs – reduce capital expenditure while maintaining protection.
Conclusion
Options Greeks are the foundation for advanced options trading and risk management. Understanding delta, gamma, theta, vega, and rho enables traders to quantify risk, structure trades, and implement sophisticated hedging strategies. By combining these metrics with advanced approaches like delta neutral hedging, gamma scalping, vega hedging, spreads, and collars, traders can protect portfolios against adverse movements while seizing opportunities in volatile markets.
For Indian traders, these strategies are highly relevant in indices like Nifty, Bank Nifty, and sectoral options, as well as in individual stocks. Mastery of Greeks and hedging not only enhances risk management but also opens avenues for strategic income generation, volatility trading, and portfolio optimization.
In an increasingly complex and volatile market environment, leveraging Options Greeks and advanced hedging strategies is no longer optional—it is essential for any serious options trader aiming for consistent, risk-adjusted returns.
Blockchain & Tokenized Assets in Trading1. Understanding Blockchain in Trading
1.1 Blockchain Fundamentals
Blockchain is a decentralized ledger that records transactions across multiple computers, ensuring that records cannot be altered retroactively. Key characteristics include:
Decentralization: No single entity controls the network, reducing the risk of centralized failures or manipulation.
Immutability: Once recorded, transactions cannot be altered, enhancing transparency and trust.
Consensus Mechanisms: Networks use methods like Proof of Work (PoW) or Proof of Stake (PoS) to validate transactions.
Smart Contracts: Self-executing contracts with rules encoded directly on the blockchain automate processes, reducing human intervention.
In trading, these features eliminate many traditional inefficiencies, such as delayed settlement, dependency on intermediaries, and manual record-keeping.
1.2 Blockchain vs Traditional Trading Systems
Traditional trading systems, such as stock exchanges and commodity markets, are centralized and rely heavily on brokers, clearinghouses, and custodians. These systems often involve:
Settlement delays: Trades typically settle in T+2 or T+3 days.
Limited accessibility: Small investors may face restrictions due to high entry barriers.
Manual reconciliation: Back-office operations are labor-intensive and prone to errors.
Blockchain addresses these issues by providing:
Real-time settlement: Transactions can be settled almost instantly using digital tokens.
Global accessibility: Anyone with an internet connection can participate in tokenized markets.
Reduced costs: Automation through smart contracts lowers administrative and operational expenses.
2. Tokenized Assets: Definition and Scope
2.1 What Are Tokenized Assets?
Tokenized assets are digital tokens issued on a blockchain that represent ownership rights to real-world assets. These tokens can be broadly categorized into:
Security Tokens: Represent traditional securities like stocks, bonds, or real estate shares. They are often regulated and provide legal rights to holders, including dividends or interest payments.
Utility Tokens: Provide access to a service or platform rather than ownership of an asset. For example, tokens used in decentralized exchanges for transaction fees.
Commodity Tokens: Represent tangible assets like gold, oil, or other commodities.
NFTs as Assets: While traditionally linked to art and collectibles, NFTs can represent ownership of unique financial contracts or intellectual property.
2.2 Benefits of Tokenization
Fractional Ownership: High-value assets, like real estate or rare art, can be divided into smaller tokens, allowing retail investors to participate.
Liquidity: Tokenization enables trading of illiquid assets in secondary markets, improving asset liquidity.
Transparency and Security: Ownership and transaction history are recorded immutably on the blockchain.
Global Market Access: Investors worldwide can buy and sell tokenized assets without geographic restrictions.
Programmability: Smart contracts automate payouts, compliance, and corporate actions.
3. Blockchain-Powered Trading Platforms
3.1 Decentralized Exchanges (DEXs)
Decentralized exchanges allow peer-to-peer trading without intermediaries. Examples include Uniswap, Sushiswap, and PancakeSwap. Key advantages:
Users retain custody of their assets.
Automated Market Makers (AMMs) provide liquidity using smart contracts.
Cross-border and 24/7 trading is possible.
3.2 Security Token Exchanges
Security token exchanges, like tZERO and OpenFinance, cater to regulated security tokens. Features include:
Compliance with KYC/AML regulations.
Integration with traditional financial systems.
Fractional trading of securities like real estate, bonds, or shares.
3.3 Hybrid Trading Platforms
Hybrid platforms combine centralized and decentralized elements to provide regulatory compliance, liquidity, and efficient execution. Examples include Binance and FTX (prior to its collapse). They often provide:
Custody services.
Access to tokenized securities.
Integration with fiat onramps.
4. Applications of Tokenized Assets in Trading
4.1 Equity Tokenization
Companies can issue shares as digital tokens, making fundraising faster and accessible globally. Benefits include:
Reduced costs of IPOs and share issuance.
Increased liquidity for traditionally illiquid stocks.
Fractional ownership for small investors.
4.2 Bond Tokenization
Tokenized bonds offer programmable interest payouts and shorter settlement cycles. This reduces operational costs and increases market efficiency.
4.3 Commodity Tokenization
Gold, silver, and oil can be tokenized, allowing traders to buy small fractions of physical commodities. Advantages:
Reduced storage and transport costs.
Global access to commodities markets.
Instant settlement and 24/7 trading.
4.4 Real Estate Tokenization
Tokenizing real estate allows multiple investors to co-own properties without traditional paperwork. Benefits:
Liquidity in traditionally illiquid markets.
Diversification across geographies and asset types.
Automated rental income distribution via smart contracts.
4.5 Derivatives and Synthetic Assets
Blockchain enables tokenized derivatives and synthetic assets that mirror the price movements of traditional assets. Traders can gain exposure to equities, commodities, or currencies without holding the underlying asset.
5. Advantages of Blockchain and Tokenization in Trading
Efficiency and Speed: Trade settlement occurs almost instantly compared to traditional T+2/T+3 systems.
Reduced Counterparty Risk: Smart contracts automate settlement, reducing reliance on third parties.
Cost Reduction: Fewer intermediaries and automation lower transaction and operational costs.
Transparency: All transactions are recorded on a public ledger, reducing fraud risk.
Global Access: Investors across the world can participate without geographical restrictions.
Programmable Assets: Smart contracts allow automation of dividends, interest, or royalties.
6. Challenges and Risks
While the benefits are significant, blockchain and tokenized assets face several challenges:
6.1 Regulatory Challenges
Regulatory frameworks for tokenized assets are still evolving worldwide.
Different countries have varying rules for securities, taxation, and investor protection.
Compliance with anti-money laundering (AML) and know-your-customer (KYC) standards is mandatory but complicated in decentralized systems.
6.2 Security Concerns
Smart contract vulnerabilities can lead to hacks and loss of assets.
Private key management is critical; loss of keys results in irreversible loss.
6.3 Market Liquidity
Tokenized asset markets are still emerging; liquidity may not always match traditional markets.
Low liquidity can lead to price volatility and market manipulation.
6.4 Technological Risks
Blockchain scalability and transaction speed are ongoing challenges, especially during periods of high demand.
Interoperability between different blockchain networks is limited.
9. Conclusion
Blockchain technology and tokenized assets are reshaping the landscape of trading. By combining decentralization, transparency, and programmability, they address the inefficiencies of traditional financial markets. Investors can now access fractional ownership of assets, trade globally, and benefit from faster settlement cycles.
However, challenges remain—regulation, security, liquidity, and technological limitations need resolution for mainstream adoption. Despite these hurdles, the trajectory is clear: tokenized trading is moving from niche innovation to an integral part of global financial markets. The future may see fully decentralized exchanges for stocks, bonds, commodities, and real estate, offering unprecedented access, efficiency, and democratization of financial markets.
Blockchain and tokenized assets do not merely represent a new way to trade—they signal a paradigm shift in how value is represented, transferred, and monetized in the digital era. For traders, investors, and institutions, embracing this evolution is no longer optional; it is essential for staying ahead in the rapidly changing financial landscape.
Technology & Innovation in Trading1. Historical Context: From Open Outcry to Digital Platforms
1.1 The Open-Outcry Era
Traditionally, trading took place in physical exchanges using open-outcry systems, where traders would shout and use hand signals to execute orders. While this method facilitated human interaction and negotiation, it had significant limitations:
Time and geographical constraints: Trading required physical presence on the floor.
Limited access: Retail investors found it difficult to participate.
Risk of human error: Manual execution often resulted in mistakes.
1.2 Advent of Electronic Trading
The 1980s and 1990s marked the transition from floor-based trading to electronic systems. Exchanges like NASDAQ pioneered automated order matching, allowing trades to be executed faster and more efficiently. The introduction of electronic trading platforms democratized market access and laid the foundation for further innovations.
Key innovations included:
Real-time quotes and order books.
Electronic order matching.
Automated risk management tools for brokers and traders.
2. Algorithmic and High-Frequency Trading (HFT)
2.1 Algorithmic Trading
Algorithmic trading (algo trading) uses computer programs to execute trades based on predefined criteria. These algorithms analyze vast amounts of market data to identify patterns, trends, and opportunities that humans may overlook.
Advantages:
Increased execution speed.
Reduced transaction costs.
Minimized human bias and emotional decision-making.
Applications:
Trend-following strategies.
Arbitrage opportunities.
Market-making operations.
2.2 High-Frequency Trading
High-Frequency Trading represents a subset of algorithmic trading characterized by ultra-fast execution and extremely short holding periods. HFT relies on sophisticated algorithms, co-location facilities near exchange servers, and ultra-low latency networks.
Impact of HFT:
Liquidity provision: HFT firms often act as market makers.
Market volatility: While providing liquidity, HFT can amplify short-term volatility.
Technological arms race: Firms compete to reduce latency by microseconds, driving continuous innovation in network and hardware technology.
3. Artificial Intelligence and Machine Learning in Trading
3.1 Predictive Analytics
Artificial intelligence (AI) and machine learning (ML) enable predictive analytics in trading. By analyzing historical price patterns, market sentiment, and macroeconomic indicators, AI models can forecast market movements with increasing accuracy.
Applications:
Sentiment analysis: AI analyzes news articles, social media, and financial reports to gauge market sentiment.
Pattern recognition: ML algorithms identify recurring patterns that signal potential buy or sell opportunities.
Portfolio optimization: AI helps traders optimize asset allocation based on risk-return profiles.
3.2 Reinforcement Learning
Reinforcement learning, a branch of AI, is increasingly applied to trading. Here, algorithms learn through trial and error, optimizing strategies over time. These models are particularly useful in dynamic markets where traditional rule-based algorithms may fail.
4. Big Data and Market Intelligence
The explosion of digital information has given rise to big data, which is transforming trading decisions. Financial markets generate enormous volumes of structured and unstructured data, including:
Price and volume data.
News and macroeconomic indicators.
Social media trends.
Alternative data sources like satellite imagery, shipping logs, and consumer behavior metrics.
Big data technologies in trading:
Real-time data processing frameworks.
Advanced analytics platforms.
Data visualization tools for actionable insights.
Traders now leverage these tools to gain competitive advantages, optimize strategies, and identify market anomalies before competitors.
5. Blockchain and Decentralized Finance (DeFi)
5.1 Blockchain Technology
Blockchain introduces decentralized, immutable ledgers that enhance transparency and security in trading. Its applications in trading are vast:
Cryptocurrency exchanges: Platforms like Binance and Coinbase rely on blockchain for secure transactions.
Tokenized assets: Traditional assets such as stocks, bonds, and real estate can now be tokenized for fractional ownership and global trading.
5.2 Decentralized Finance
DeFi platforms use smart contracts to execute trades without intermediaries, reducing costs and settlement times. Innovations like automated market makers (AMMs) and decentralized exchanges (DEXs) are reshaping the conventional trading ecosystem.
6. Mobile Trading and Retail Empowerment
The proliferation of smartphones has democratized access to trading. Mobile trading apps enable retail investors to trade anytime, anywhere. Innovations include:
Real-time price alerts and notifications.
Fractional share trading.
Integration with AI-based advisory services.
Gamification features to enhance engagement and financial literacy.
This trend has increased market participation and encouraged the growth of retail trading, particularly among younger investors.
Conclusion
Technology and innovation have fundamentally reshaped trading, making it faster, more accessible, and more sophisticated. From algorithmic trading and AI-driven insights to blockchain, DeFi, and mobile platforms, the financial markets of today are more interconnected and data-driven than ever. While these innovations create unprecedented opportunities, they also pose challenges related to security, regulation, and systemic risk. The future of trading lies in the continuous interplay of technology, human ingenuity, and robust regulatory frameworks—ensuring that markets remain efficient, inclusive, and resilient.
The next decade promises even more radical transformations, as AI, quantum computing, and immersive technologies converge with finance. Traders, institutions, and regulators must adapt proactively to leverage opportunities while mitigating risks, ensuring that the financial markets continue to thrive in an era of rapid technological change.
XAGUSD Step-by-step entry plan for XAGUSD
1. We have our Daily Point of Interest (POI)
- On the daily a zone that contains:
* a fair value gap (FVG),
* a break of structure (BOS) that previously acted as resistance and is now expected to act as support, and
* support from the 44 SMA.
2. Wait for price to return to the Daily POI
- Only consider the setup if price actually comes back into that daily POI zone.
3. Switch to the 1-hour timeframe to refine the entry
- Look for a shift in structure on the 1-hour (i.e., evidence that momentum is shifting bullish: BOS to the upside, higher highs/higher lows).
4. Confirm a 1-hour fair value gap forms
- The structure shift on 1-hour should create a 1-hour FVG (a short intraday imbalance).
5. Wait for the 1-hour FVG to be filled
- Let price fill that 1-hour FVG (price moves into/through the gap).
6. Look for a bullish confirmation on the filled 1-hour FVG
- After the fill, require a clear bullish formation on 1-hour (examples: bullish engulfing candle, strong demand candle, a higher-low + rejection wick).
7. Enter on the 1-hour bullish confirmation
- Enter when price breaks the confirmation level (e.g., breaks above the local 1-hour high formed by the bullish setup) or on a confirmed bullish candle close per your entry rules.
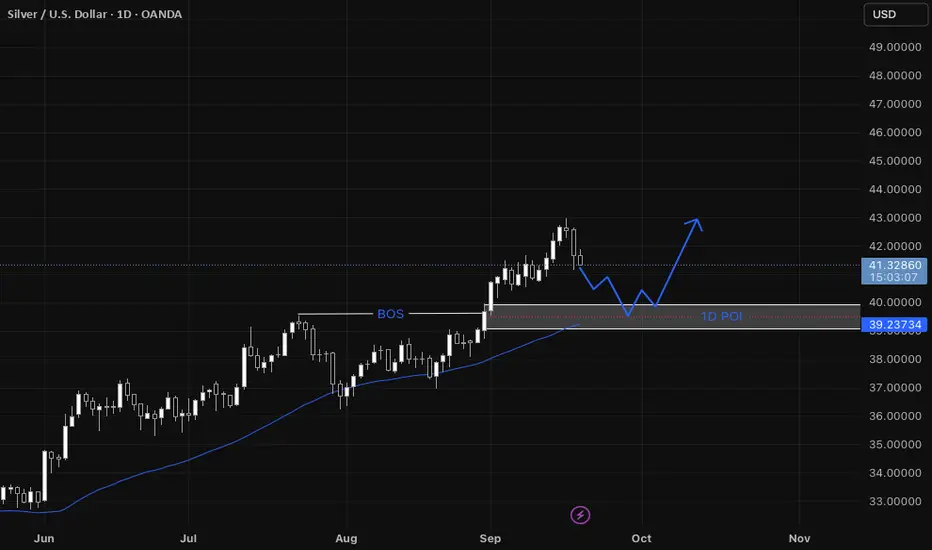
Breakout Stock For Swing Trading Banco india is a very good stock in his secret. It's given breakout with high volume.
It's looking good for Swing trading tgt 5 -8%
SL 5% . then Trail SL.
It's given good breakout.
You can Visit my Tradingview Profile for more information.
Consult your financial advisor before making any position in stock market.
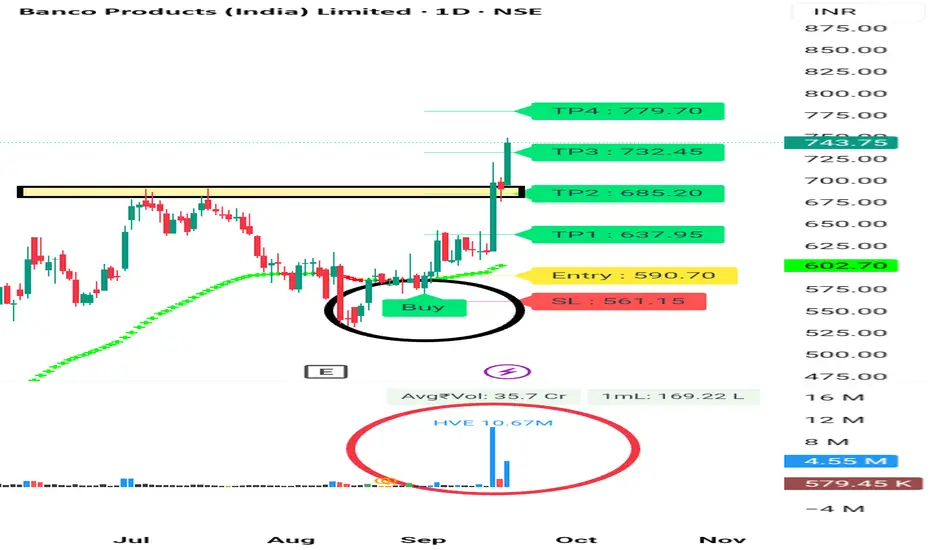
Divergence SecretsLong Straddle
Setup: Buy 1 Call + Buy 1 Put (same strike & expiry).
When to Use: Expect huge volatility but uncertain direction.
Logic: Profit if stock makes big move either way.
Example: Stock at ₹100. Buy Call 100 for ₹4 + Put 100 for ₹4 (total ₹8). If stock goes to ₹115, Call worth ₹15 (profit ₹7). If stock goes to ₹85, Put worth ₹15 (profit ₹7). Loss if stock stays near ₹100.
Long Strangle
Setup: Buy Out-of-the-Money Call + Buy Out-of-the-Money Put.
When to Use: Expect big move but cheaper than Straddle.
Logic: Profitable in strong moves but needs bigger movement than Straddle.
Example: Stock at ₹100. Buy Call 105 for ₹3 + Put 95 for ₹3. Total cost ₹6. Profit only if stock moves above 111 or below 89.
Bull Call Spread
Setup: Buy Call at lower strike + Sell Call at higher strike.
When to Use: Moderately bullish.
Logic: Reduces cost compared to naked Call.
Example: Stock ₹100. Buy Call 100 for ₹5, Sell Call 110 for ₹2. Net cost ₹3. Max profit = ₹7 (if stock > ₹110).
Bear Put Spread
Setup: Buy Put at higher strike + Sell Put at lower strike.
When to Use: Moderately bearish.
Logic: Cheaper than long Put.
Example: Stock ₹100. Buy Put 100 for ₹5, Sell Put 90 for ₹2. Net cost ₹3. Max profit = ₹7 (if stock < ₹90).
Iron Condor
Setup: Sell Out-of-the-Money Call Spread + Sell Out-of-the-Money Put Spread.
When to Use: Expect sideways movement with low volatility.
Logic: Earn premium as long as stock stays in range.
Example: Stock ₹100. Sell 90 Put, Buy 85 Put, Sell 110 Call, Buy 115 Call. Net premium collected ₹4. Profit if stock stays between 90–110.
Butterfly Spread
Setup: Buy 1 Call (low strike) + Sell 2 Calls (middle strike) + Buy 1 Call (high strike).
When to Use: Expect very low volatility, price near middle strike.
Logic: Profits if stock stays near center strike.
Example: Stock ₹100. Buy Call 95 for ₹7, Sell 2 Calls 100 for ₹4 each, Buy Call 105 for ₹2. Net cost = ₹1. Max profit at ₹100 = ₹4.
Collar Strategy
Setup: Buy stock + Buy Put + Sell Call.
When to Use: Want to protect downside while capping upside.
Logic: Provides range-bound protection.
Example: Stock ₹100. Buy Put 95 for ₹3, Sell Call 110 for ₹3. Net zero cost. Loss limited below ₹95, profit capped above ₹110.
Calendar Spread
Setup: Sell short-term option + Buy long-term option (same strike).
When to Use: Expect stock to remain stable short-term but move long-term.
Logic: Benefit from time decay in near-term option.
Example: Stock ₹100. Sell 1-month Call 100 for ₹3, Buy 3-month Call 100 for ₹6. Net cost ₹3.

Option Trading Introduction to Options Trading Strategies
Options trading is one of the most versatile areas of financial markets. Unlike buying and selling stocks directly, options allow traders to take advantage of different market conditions—whether bullish, bearish, neutral, or highly volatile. An option is essentially a financial contract that gives the buyer the right, but not the obligation, to buy (Call option) or sell (Put option) an underlying asset at a predetermined price (strike price) within a certain time (expiry).
While options can be used for speculation, hedging, or income generation, their real power lies in combining them into strategies. A strategy is nothing but a structured position involving one or more options (and sometimes the underlying asset) to create a favorable risk–reward setup.
Why are strategies important? Because trading options without a plan is risky—premiums decay, volatility shifts, and market direction can change suddenly. With the right strategy, a trader can limit losses, protect gains, and even profit when the market doesn’t move much.
This is why professional traders, institutions, and hedge funds rely on well-designed options strategies to manage risk and generate consistent returns.
Why Strategies Are Needed in Options
Options are unique compared to equities or futures. While buying a stock means unlimited upside and downside exposure, options introduce time decay (theta), volatility risk (vega), and sensitivity to price changes (delta). Without strategies, a trader might:
Lose money despite being directionally correct.
Face unlimited risk when shorting naked options.
Fail to take advantage of sideways or volatile markets.
For example: Suppose you are bullish on a stock trading at ₹100. You buy a Call at strike ₹105 for ₹5. If the stock moves to ₹110, you gain ₹5. But if it just stays at ₹100 till expiry, you lose the entire premium—even though your view wasn’t wrong about stability. This is why strategies like spreads, straddles, and condors exist—they help fine-tune payoffs.
Thus, option strategies allow you to customize risk and reward as per your market outlook.

Part 2 Support and Resistance Advantages of Options Trading
Leverage: Control a large position with limited capital.
Hedging: Protect stock holdings from adverse movements.
Flexibility: Multiple strategies for different market conditions.
Income Generation: Sell options for premium income.
Speculation: Profit from both rising and falling markets.
Market Dynamics and Participants
Options markets involve diverse participants:
Retail Traders – Individual investors trading for speculation or hedging.
Institutional Traders – Hedge funds, mutual funds, and banks use options for portfolio strategies.
Market Makers – Ensure liquidity by continuously quoting bid-ask prices.
Regulators – SEBI in India, SEC in the US, maintain fair and transparent trading practices.
Options trading occurs in exchanges like NSE, BSE, CBOE, offering standardized contracts. Indian markets primarily trade in equity options and index options.
Practical Tips for Options Trading
Start Small – Begin with limited capital while learning strategies.
Understand Greeks – They help manage risk and strategy adjustments.
Focus on Liquid Options – Avoid thinly traded contracts for better execution.
Use Stop Loss and Risk Management – Limit losses in volatile markets.
Monitor Time Decay – Be aware of how options lose value as expiration nears.
Combine Strategies – Mix calls, puts, and spreads for hedging or speculation.
Stay Updated on Market News – Earnings, policy changes, and global events impact volatility.

Part 1 Support and Resistance Option Trading Strategies
Options are highly versatile, allowing traders to implement strategies for bullish, bearish, or neutral markets. Some key strategies include:
a) Basic Strategies
Long Call – Buy a call option expecting price rise.
Long Put – Buy a put option expecting price fall.
Covered Call – Own the underlying stock and sell a call for income.
Protective Put – Own the stock and buy a put for downside protection.
b) Intermediate Strategies
Straddle – Buy both call and put with the same strike to profit from volatility.
Strangle – Buy out-of-the-money call and put to capture larger moves.
Bull Call Spread – Buy a lower strike call and sell a higher strike call to reduce premium.
Bear Put Spread – Buy a higher strike put and sell a lower strike put to limit risk.
c) Advanced Strategies
Iron Condor – Sell an out-of-the-money call and put while buying further OTM options to limit loss; profits in low volatility.
Butterfly Spread – Use multiple calls/puts to profit from minimal movement.
Calendar Spread – Sell a near-term option and buy a long-term option to profit from time decay differences.
Risk and Reward in Options
Options provide leverage, meaning a small price movement can result in substantial gains or losses. Understanding risk is crucial:
For Buyers
Maximum loss is the premium paid.
Potential profit can be unlimited (for calls) or substantial (for puts).
For Sellers (Writers)
Maximum loss can be unlimited if uncovered (naked) calls.
Premium received is the maximum gain.
Key Risks
Time decay (Theta) erodes value.
Volatility risk (Vega) can reduce option price.
Liquidity risk if the option is thinly traded.
