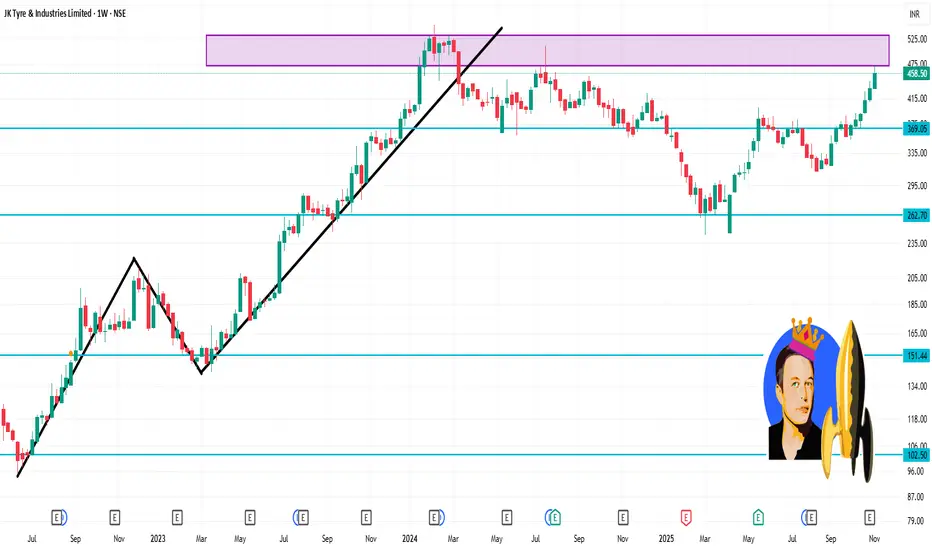
JKTYRE 1 Week Time Frame 🧮 Key support & resistance levels for the week ahead
Based on pivot/fibonacci calculations and support/resistance studies:
Resistance levels
~ ₹466 – primary resistance in the immediate zone.
Further resistance ~ ₹474-₹486 zone.
Support levels
First support: ~ ₹446-₹454 region.
Lower support (if deeper pull-back): ~ ₹408-₹390 range.
Trade
Part 7 Trading Master ClassBasic Terminology
To understand option trading, one must know a few key terms:
Strike Price: The price at which the underlying asset can be bought (call) or sold (put).
Premium: The price paid by the buyer to the seller for the option contract.
Expiration Date: The date on which the option contract expires. In India, options typically expire every Thursday (for weekly options) or the last Thursday of the month (for monthly options).
In-the-Money (ITM): A call option is ITM when the market price is above the strike price; a put option is ITM when the market price is below the strike price.
Out-of-the-Money (OTM): A call is OTM when the market price is below the strike, and a put is OTM when the market price is above the strike.
At-the-Money (ATM): When the market price and strike price are roughly equal.

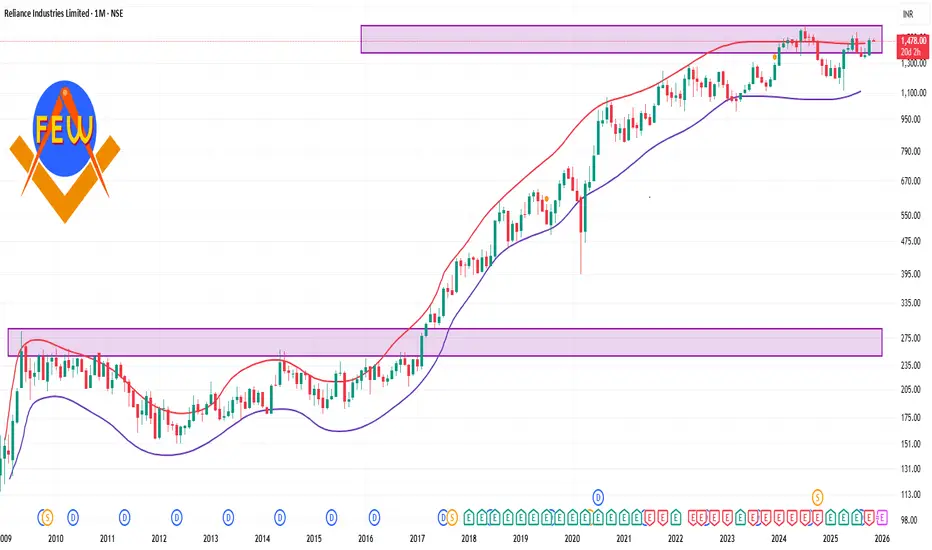
Reliance 1 Month Time Frame ✅ What we know
RIL’s current price is around ₹1,478 per share.
Over the past month, the stock has had a positive return according to some sources: ~ +5–8 %.
Recent support/resistance behaviour: In late Oct/early Nov the stock was fluctuating in the ~₹1,480-₹1,500 range.
The 52-week high is ~₹1,551, and the 52-week low ~₹1,114.85.
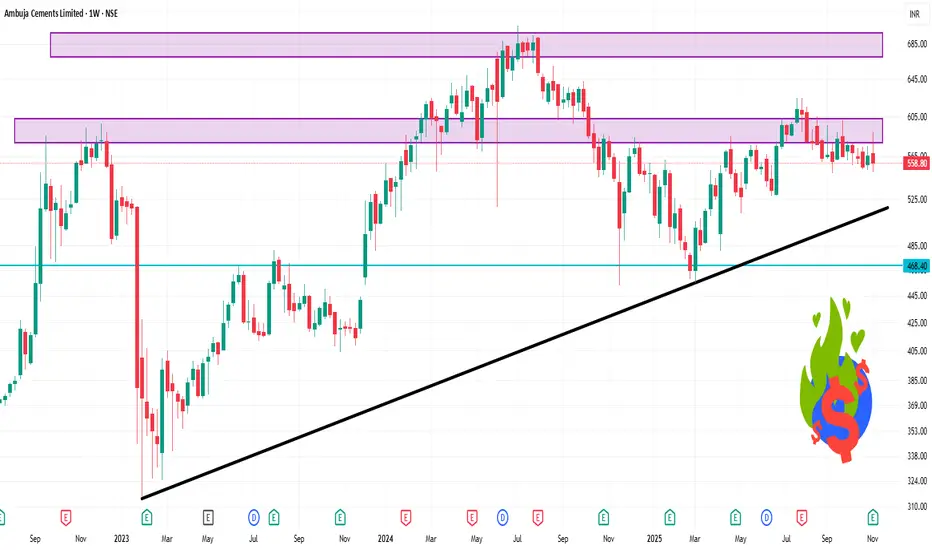
AMBUJACEM 1 Week Time Frame 📊 Key support / resistance & pivot levels
According to Market Screener, short-term support is around ₹554.95 and resistance around ₹591.40.
Weekly pivot levels from one source: Standard pivot ~ ₹575.17, support S1 ~ ₹554.03, resistance R1 ~ ₹587.83.
Daily pivot for a shorter time frame: Pivot ~ ₹582.32, S1 ~ 575.69, R1 ~ 585.64.
🎯 Key levels to watch (for the upcoming week)
Here are approximate levels you might monitor:
Support: ~ ₹555–560 — if price dips, this zone may provide a floor.
Resistance: ~ ₹590–595 — breaking above could open further upside.
Pivot / midpoint: ~ ₹568–570 — the “centre” where short-term bias may shift.
HINDALCO 1 Day Time Frame Current price: ~ ₹ 758.05.
Day’s range: Data varies; one source shows a high around ₹ 842.60 and low around ₹ 855.95, though this appears inconsistent.
52-week range: ~ ₹ 546.45 (low) to ~ ₹ 864.00 (high).
Key levels to watch (approximate):
Support: ~ ₹ 750 – ₹ 760
Resistance: ~ ₹ 830 – ₹ 860

XAUUSD – H4 PERSPECTIVE: WAIT FOR LIQUIDITY TEST BEFORE DEEP...💛 XAUUSD – H4 PERSPECTIVE: WAIT FOR LIQUIDITY TEST BEFORE DEEP DECLINE 🎯
🌤 1. Overview
Hello everyone 💬
Gold just ended the week with a candle closing at the 4001 region, after a slight rise and then holding steady in the upward channel on the H4 frame.
The current sideways movement is making it difficult for many traders to find short-term entry points.
However, the 4090 area still has an unfilled liquidity gap (FVG), which coincides with the upper edge of the price channel. This could be the next short-term destination before the market adjusts for a deeper decline.
From my perspective, gold might rise another leg to sweep the liquidity in the upper region, then adjust back to the 3785 area – an important Fibonacci Retracement zone, where a strong reaction from buyers is highly likely.
💹 2. Technical Analysis
📈 The price structure is still maintaining an upward trend within the H4 price channel, with each subsequent low being higher than the previous one.
🟣 The 4090–4102 area is a liquidity region yet to be swept, located at the channel's peak – a high probability of a downward reaction.
🔹 The potential Buy zone around 3785–3789 coincides with Fibonacci 0.618 and a strong historical support area.
💫 Main scenario: Price might test the upper liquidity region, then adjust down to the Buy Zone before forming a larger upward momentum.
🎯 3. Reference Trading Plan
💢 SELL scenario (short-term)
Entry: 4098–4102 | SL: 4112
TP: 4078 – 4025 – 3998 – 3920 – 3875 – 3785
💖 BUY scenario (long-term strategy)
Entry: 3785–3789 | SL: 3777
TP: 3810 – 3865 – 3925 – 3988
⚠️ 4. Important Notes
Prioritize short-term Sell if there is a strong reaction at the 4090–4100 region.
Long-term Buy only if the price adjusts deeply to the 3785–3790 region.
Limit emotional trading – this is a liquidity accumulation phase before major volatility.
🌷 5. Conclusion & Interaction with LanaM2
Gold is following the accumulation path before forming a major wave 💛
Be patient and observe reactions at the two critical regions 4090 and 3785, as these could be the pivot points for the coming week.

Advanced Chart Patterns in Technical Analysis1. Introduction to Advanced Chart Patterns
In trading, patterns repeat because human behavior is repetitive. Fear, greed, and hope drive market movements, and these emotions get imprinted in price charts. Advanced chart patterns are an extension of classical technical formations, combining structure, volume, and momentum to forecast price trends. Mastering them helps traders differentiate between false breakouts and genuine opportunities.
Advanced patterns generally fall into two main categories:
Continuation Patterns – Indicating a pause before the prevailing trend continues.
Reversal Patterns – Signaling the end of a trend and the beginning of a new one.
2. Head and Shoulders (Reversal Pattern)
The Head and Shoulders pattern is one of the most reliable reversal signals. It indicates a change in trend direction — from bullish to bearish (standard form) or from bearish to bullish (inverse form).
Structure:
Left shoulder: A price rise followed by a decline.
Head: A higher peak than the left shoulder, followed by another decline.
Right shoulder: A lower rise, followed by a breakdown through the neckline.
Neckline: Connects the lows between the shoulders and serves as a key breakout level.
Once the price breaks below the neckline, it confirms a bearish reversal. The target is estimated by measuring the distance from the head to the neckline and projecting it downward.
Inverse Head and Shoulders works similarly but in the opposite direction — signaling a bullish reversal after a downtrend.
3. Cup and Handle Pattern
The Cup and Handle is a bullish continuation pattern resembling a teacup. It was popularized by William O’Neil in his book How to Make Money in Stocks.
Formation:
Cup: A rounded bottom, showing a gradual shift from selling to buying.
Handle: A short pullback or consolidation that follows the cup, forming a downward-sloping channel.
When the price breaks above the handle’s resistance with strong volume, it often signals a continuation of the prior uptrend.
Target: The depth of the cup added to the breakout point.
This pattern is often seen in growth stocks and long-term bullish markets.
4. Double Top and Double Bottom
These patterns are classic but essential to advanced technical traders due to their reliability and frequency.
Double Top:
Appears after a strong uptrend.
Price makes two peaks at similar levels separated by a moderate decline.
A breakdown below the “neckline” confirms a bearish reversal.
Double Bottom:
Appears after a downtrend.
Two troughs form around the same level with a peak in between.
A breakout above the neckline signals a bullish reversal.
Volume confirmation is crucial — rising volume on the breakout adds credibility to the pattern.
5. Flag and Pennant Patterns
Flags and Pennants are short-term continuation patterns that often appear after a strong price movement, known as the “flagpole.”
Flag: Forms as a small rectangular channel sloping against the main trend.
Pennant: Appears as a small symmetrical triangle following a sharp move.
These patterns typically consolidate the market before the next strong move in the same direction.
Breakout Rule:
When price breaks in the direction of the previous trend, accompanied by high volume, it confirms continuation.
Target Projection:
Length of the flagpole added to the breakout point.
6. Wedge Patterns
Wedges are advanced chart patterns signaling either continuation or reversal depending on their position and direction.
Rising Wedge:
Forms when price makes higher highs and higher lows, but the slope narrows upward.
Typically appears in an uptrend and indicates weakening bullish momentum — a bearish reversal signal.
Falling Wedge:
Forms with lower highs and lower lows converging downward.
Usually appears in a downtrend, indicating a potential bullish reversal.
Volume generally declines during formation and expands during breakout, confirming the move.
7. Symmetrical, Ascending, and Descending Triangles
Triangles represent consolidation phases and serve as reliable continuation patterns.
Symmetrical Triangle:
Characterized by converging trendlines with no clear direction bias.
Breakout direction typically follows the prior trend.
Ascending Triangle:
Horizontal resistance with rising support.
Usually forms during an uptrend, signaling bullish continuation.
Descending Triangle:
Horizontal support with declining resistance.
Typically bearish, indicating continuation of a downtrend.
Triangles are volume-sensitive patterns — declining volume during formation and surge during breakout strengthens reliability.
8. Rectangle Pattern
A Rectangle or Trading Range represents a period of indecision between buyers and sellers.
Formation: Price oscillates between horizontal support and resistance.
Interpretation:
Breakout above resistance → bullish signal.
Breakdown below support → bearish signal.
Traders often trade within the rectangle until a confirmed breakout occurs, using stop-losses near the opposite boundary.
9. Diamond Pattern
The Diamond Top is an advanced reversal pattern that forms after a prolonged uptrend. It begins as a broadening formation (wider price swings) and ends with a narrowing triangle — resembling a diamond shape.
Indicates distribution and market exhaustion.
Once price breaks below the support line, it confirms a bearish reversal.
This pattern is rare but highly reliable when spotted correctly.
10. Harmonic Patterns (Advanced Category)
Harmonic patterns use Fibonacci ratios to predict potential reversals with high precision. These include Gartley, Bat, Butterfly, and Crab patterns.
Gartley Pattern: Indicates retracement within a trend, typically completing at the 78.6% Fibonacci level.
Bat Pattern: Uses deeper retracement levels (88.6%) to identify precise turning points.
Butterfly Pattern: Suggests a reversal near 127% or 161.8% Fibonacci extensions.
Crab Pattern: Known for extreme projections (up to 224% or more), signaling deep retracements.
These patterns require advanced understanding of Fibonacci tools and are used by professional traders for precision entries.
11. Rounding Bottom and Top
Rounding Bottom:
Gradual shift from bearish to bullish sentiment.
Indicates long-term accumulation before a breakout.
Typically seen in major trend reversals in large-cap stocks.
Rounding Top:
Slow shift from bullish to bearish sentiment.
Represents distribution and is often followed by a sustained downtrend.
These patterns form over long durations (weeks or months) and are reliable for positional traders.
12. Broadening Formation
Also known as a megaphone pattern, it shows increasing volatility and investor uncertainty.
Formation: Two diverging trendlines — one ascending, one descending.
Meaning: Early sign of market instability; may precede major reversals.
Trade Setup: Enter once a confirmed breakout occurs beyond the pattern boundaries.
13. Volume and Confirmation in Chart Patterns
Volume plays a critical role in confirming pattern validity. Key principles include:
Decreasing volume during consolidation or pattern formation.
Increasing volume during breakout, confirming institutional participation.
False breakouts often occur on low volume, trapping retail traders.
Combining volume indicators (like OBV or Volume Oscillator) with pattern analysis enhances accuracy.
14. Practical Application and Risk Management
Even the most reliable patterns fail without proper risk management and confirmation strategies.
Wait for breakout confirmation with candle close beyond key levels.
Use stop-loss slightly below support or above resistance.
Combine patterns with momentum indicators like RSI or MACD for confirmation.
Avoid overtrading; focus on quality setups with clear symmetry and volume validation.
15. Conclusion
Advanced chart patterns bridge the gap between price action and trader psychology. They help traders interpret market behavior and anticipate future movements with a structured approach. Patterns like the Cup and Handle, Head and Shoulders, and Wedges reveal not just the direction but also the strength and conviction of trends.
Mastering these patterns requires practice, discipline, and confirmation through indicators and volume. When used correctly, advanced chart patterns empower traders to make informed, high-probability decisions — transforming random price data into profitable trading opportunities.
Banknifty Premium ChartWhat is Option Premium?
It’s the cost of an option contract.
When you buy an option, you pay the premium upfront.
Example: If you buy a Call Option of Reliance ₹2800 at ₹50 premium — you pay ₹50 × lot size.
Who Receives It?
The option seller (writer) receives the premium income immediately when they sell (write) the option.

Part 4 Learn Institutional TradingAdvantages of Option Trading
Leverage:
Options allow control over large quantities of an asset with a small investment (premium). This magnifies potential profits.
Limited Risk for Buyers:
When buying options, the maximum loss is limited to the premium paid.
Hedging Capability:
Options can offset potential losses in the underlying portfolio.
Flexibility:
Options can be combined in various strategies to suit market outlooks—bullish, bearish, or neutral.
Multiple Strategies:
Options offer numerous strategies like straddles, strangles, spreads, collars, and iron condors, giving traders the ability to profit in different market conditions.

Part 3 Learn Institutional Trading Purpose of Option Trading
Option trading serves three main purposes:
Hedging (Risk Management):
Investors use options to protect their portfolios against adverse price movements. For instance, if you hold a stock, buying a put option acts as insurance—allowing you to sell the stock at a predetermined price even if the market crashes.
Speculation:
Traders use options to bet on future market direction. Options allow traders to gain exposure with limited capital, as the premium is usually a fraction of the asset’s full price.
Income Generation:
Investors can sell (write) options to earn premiums. For example, selling covered calls against owned stocks generates additional income, even if the stock price remains stable.

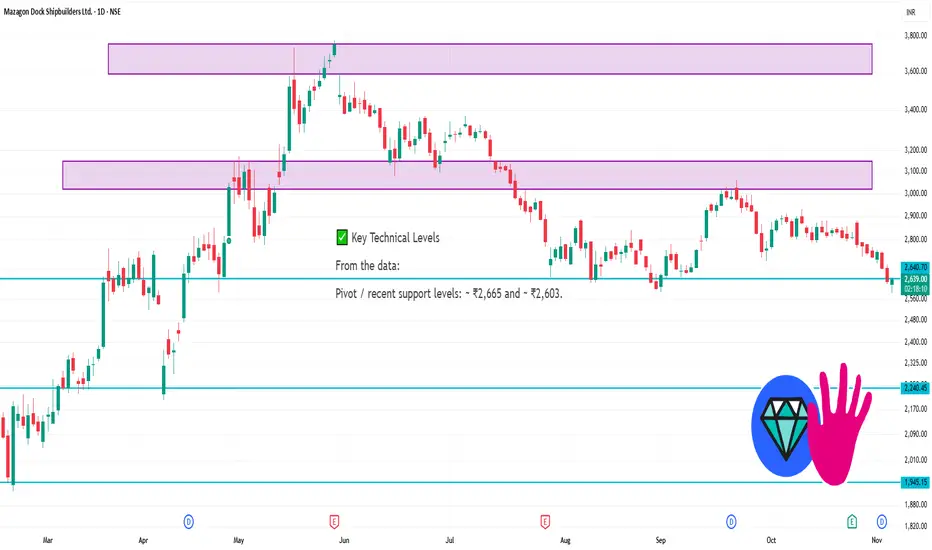
MAZDOCK 1 Day Time Frame ✅ Key Technical Levels
From the data:
Pivot / recent support levels: ~ ₹2,665 and ~ ₹2,603.
Resistance levels: ~ ₹2,837.6 (short term) and ~ ₹3,121.9.
Moving averages: The price (~ ₹2,729) is below the 20‑day / 50‑day / 100‑day MAs.
Technical indicators: RSI ~ 37.6 (low/neutral), MACD negative, trend strength weak (ADX ~11).
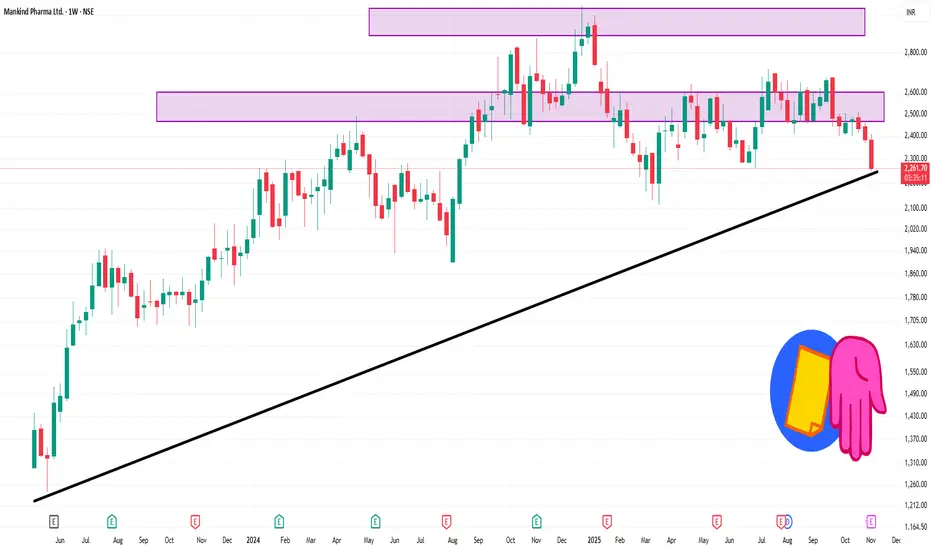
MANKIND 1 Week Time Frame 📌 Key Levels (Weekly Framework)
Support zone: ~ ₹2,287 (a strong weekly support identified)
Next lower support: ~ ₹2,201 (in case of breakdown below primary support)
Resistance zone: ~ ₹2,518 (first major weekly resistance)
Higher resistance area: ~ ₹2,696 to ₹2,937 in a medium‐term context.
🔍 Weekly Outlook & Notes
If price remains above ~₹2,287 and starts building volume/structure, there is upside potential toward ~₹2,518.
If the price breaks below ~₹2,287 decisively on the weekly chart, then watch for further drop toward ~₹2,201.
RADICO 1 Month Time Frame 📌 Current data snapshot
Latest price ~ ₹ 3,220.
52-week range: ~ ₹ 1,845.50 – ₹ 3,423.00.
Technical rating (1-month) on platforms shows “Buy” / “Strong Buy”.
🔍 Key support & resistance for ~1-month horizon
Support zone: ~ ₹ 3,050-3,100 — around current price minus some buffer.
Stronger support: ~ ₹ 2,900-3,000 — if the above zone fails.
Resistance zone: ~ ₹ 3,300-3,350 — near recent highs.
Possible breakout target: > ~ ₹ 3,400 — if it breaks resistance convincingly.
These levels are derived from recent chart data and pivot-analysis (for example, support ~₹3,052.5 seen on one chart).

Introduction: India’s Infrastructure Revolution and Market Impac1. The Infrastructure Revolution: A Historical Turning Point
Infrastructure has always been the backbone of economic growth. However, India’s earlier attempts at large-scale infrastructure expansion often suffered from policy bottlenecks, inadequate funding, and execution delays. The recent decade marks a fundamental shift — from fragmented planning to integrated development.
Under initiatives like the National Infrastructure Pipeline (NIP), PM Gati Shakti, and Smart Cities Mission, India is modernizing its roads, railways, ports, and energy networks with unprecedented scale and coordination. The NIP alone envisions an investment of over ₹111 lakh crore across sectors such as energy, transport, water, and social infrastructure by 2025.
This surge is not limited to government spending. Public-Private Partnerships (PPPs), sovereign wealth funds, and global investors are increasingly financing infrastructure projects, drawn by India’s growth potential and improving regulatory frameworks.
2. Policy Push: The Catalyst for Change
The infrastructure revolution owes much to strategic policy direction. The government has implemented structural reforms aimed at accelerating project execution, reducing red tape, and ensuring transparency in tendering and funding.
Some of the most influential initiatives include:
PM Gati Shakti National Master Plan (2021): A digital platform that integrates 16 ministries to ensure coordinated planning and implementation of infrastructure projects.
Bharatmala and Sagarmala Projects: Focused on improving road and port connectivity to enhance logistics efficiency.
Dedicated Freight Corridors (DFCs): Designed to ease congestion on railway lines and boost freight movement.
Smart Cities and AMRUT: Targeted towards urban transformation through improved utilities, mobility, and housing.
National Monetization Pipeline (NMP): Monetizing existing assets to fund new projects, reducing fiscal burden while attracting private capital.
Together, these programs mark a shift from infrastructure “creation” to infrastructure “optimization,” ensuring long-term economic dividends.
3. Economic Impact: A Multiplier for Growth
The infrastructure push has a ripple effect across the economy. Each rupee invested in infrastructure generates a multiplier impact of approximately 2.5 to 3 times on GDP.
Here’s how:
Employment Generation: Large-scale projects create millions of direct and indirect jobs, particularly in construction, manufacturing, and logistics sectors.
Improved Productivity: Efficient logistics and transport reduce travel time, lower costs, and boost competitiveness for businesses.
Urbanization and Real Estate Growth: Enhanced connectivity fuels urban expansion, leading to increased demand for housing, retail, and industrial spaces.
Investment Magnet: Stable infrastructure attracts foreign direct investment (FDI), especially in sectors like manufacturing, renewable energy, and technology parks.
Regional Development: Projects in tier-2 and tier-3 cities are reducing regional disparities, promoting balanced growth.
According to estimates, infrastructure could contribute nearly 10% to India’s GDP by 2030, transforming the nation into a global manufacturing and logistics hub.
4. Stock Market Impact: The Infrastructure Theme Takes Center Stage
India’s stock markets have responded positively to this infrastructure wave. Investors see this as a multi-decade opportunity across several interconnected sectors.
a. Core Infrastructure Stocks
Companies in construction, engineering, and heavy machinery — such as Larsen & Toubro, IRB Infrastructure, KNR Construction, and NBCC — are witnessing strong order inflows and improved margins.
b. Cement and Steel
Demand for building materials is soaring. Cement majors like UltraTech, ACC, and Dalmia Bharat, and steel producers like Tata Steel and JSW Steel, have benefited from the government’s spending spree.
c. Capital Goods and Equipment
Firms like Siemens, ABB India, and Cummins are riding the wave of infrastructure electrification, metro projects, and industrial automation.
d. Logistics and Transport
The development of multi-modal transport networks boosts companies in logistics and warehousing, such as Container Corporation of India, TCI Express, and Adani Ports.
e. Ancillary Sectors
Power, renewable energy, and urban development firms are integral beneficiaries of the infrastructure ecosystem. For instance, NTPC, Power Grid Corporation, and Adani Energy Solutions are vital to India’s grid modernization.
Thus, the infrastructure theme has become one of the strongest investment narratives in India’s equity market, attracting both domestic and foreign institutional investors.
5. Financing the Boom: Innovative Funding Models
Financing India’s infrastructure ambitions requires creativity beyond traditional budget allocations. To address this, the government and private sector are leveraging multiple instruments:
Infrastructure Investment Trusts (InvITs) and Real Estate Investment Trusts (REITs) are unlocking liquidity by monetizing assets like roads, power transmission lines, and commercial real estate.
Green Bonds and Masala Bonds are mobilizing international capital for sustainable projects.
Sovereign Wealth Funds and Pension Funds from countries like Canada, Singapore, and the UAE are increasingly investing in long-term Indian infrastructure assets.
Development Finance Institutions (DFIs), such as the National Bank for Financing Infrastructure and Development (NaBFID), provide specialized financing for large-scale projects.
This diversification of funding sources ensures that India’s infrastructure revolution is both financially sustainable and globally integrated.
6. Challenges on the Road Ahead
Despite remarkable progress, several challenges persist:
Execution Delays: Land acquisition, environmental clearances, and litigation can slow project timelines.
Cost Overruns: Inflation in construction materials and logistical inefficiencies can erode profitability.
Private Participation Risks: Uncertain returns and policy changes can deter private investment.
Skill Shortage: The sector still faces a lack of skilled labor, especially in high-tech construction and project management.
Environmental Concerns: Balancing rapid development with ecological sustainability remains a critical challenge.
Addressing these issues will require continued policy refinement, institutional strengthening, and technological innovation.
7. Future Outlook: India’s Infrastructure Decade
Looking ahead, the 2020s are likely to be remembered as India’s “Infrastructure Decade.” The focus is now expanding beyond traditional construction to include digital infrastructure, green mobility, renewable energy, and sustainable cities.
Digital India and 5G rollout will connect even the remotest regions, enabling inclusive growth.
Renewable energy projects, targeting 500 GW by 2030, will redefine India’s energy landscape.
High-speed rail networks and metro expansion will modernize urban transport.
Smart logistics parks and industrial corridors will make India a global manufacturing powerhouse.
With urbanization accelerating and global investors viewing India as a growth engine, infrastructure will continue to be the foundation of the nation’s economic narrative.
Conclusion: The Market’s Golden Era of Infrastructure
India’s infrastructure revolution is more than a construction story — it’s a transformation of the nation’s economic DNA. It intertwines policy reform, financial innovation, and market opportunity. As roads, railways, ports, and data highways connect the nation, they are also connecting investors to one of the most promising growth stories in the world.
The infrastructure-led growth model not only drives GDP expansion but also deepens India’s capital markets, generates employment, and enhances global competitiveness. For investors and policymakers alike, India’s infrastructure revolution represents both an opportunity and a responsibility — to build a future that is strong, sustainable, and inclusive.
In essence, this is not merely an infrastructure boom; it’s the building of “New India” — brick by brick, byte by byte, and vision by vision.
LiamTrading – Gold confirms medium-term uptrendLiamTrading – Gold confirms medium-term uptrend
Gold has officially broken the downward trendline, confirming the transition phase to a medium-term uptrend. After a prolonged accumulation phase, the market is beginning to show clear buying power, and the potential for an extended rally is gradually forming.
Macro – Fundamental Analysis
The latest report from the World Gold Council (WGC) shows that central banks continued to increase gold purchases significantly in September, totalling 39 tonnes, the highest level since the beginning of the year.
Most notably, the Central Bank of Brazil – for the first time this year – added 15 tonnes of gold to its national reserves.
Since the beginning of the year, the net purchases by central banks have reached 200 tonnes, clearly reflecting the trend of moving away from the USD amidst global economic and geopolitical instability. This capital flow provides a solid foundation for the medium and long-term uptrend of gold.
Technical Analysis
On the H2 chart, gold prices have broken the downward trendline, signaling a reversal and establishing a new upward structure.
The 3985–3988 zone is acting as dynamic support, potentially serving as a retest point before prices continue to rise.
The POC of the Volume Profile at the 4015–4017 zone is a short-term resistance, where the market may see profit-taking reactions before breaking higher.
The 4046 mark is considered a decisive zone; if surpassed and held, the medium-term uptrend will be strongly reinforced.
Today's Trading Scenarios
Scenario 1 – Buy in line with the uptrend:
Entry: 3986–3988 (may wait for retest confirmation)
SL: 3980
TP: 4020 – 4045 – 4090
Scenario 2 – Short sell at resistance:
Entry: 4015–4017
SL: 4023
TP: 4002 – 3986
Summary
Gold is giving clear signals of establishing a medium-term uptrend, supported by buying flows from central banks. Traders should prioritise buying positions at strategic support zones and observe price reactions around the POC to confirm the next direction.

XAUUSD – INTRADAY BULLISH SCENARIO – TARGET 4050💛 XAUUSD – INTRADAY BULLISH SCENARIO – TARGET 4050 🎯
🌤 1. Overview
Hello everyone 💬
Although the larger timeframe for gold still leans towards a bearish trend, today in the short term, I prioritise a bullish scenario.
On the M30 timeframe, the price structure is gradually increasing, indicating that short-term capital is shifting to the buying side.
Zone 3990 is a very important area – where a Break of Structure (BOS) has just appeared and is also a strong resistance that has reacted multiple times before.
Price needs to confirm breaking this zone to continue expanding the bullish trend.
💹 2. Technical Analysis (ICT Perspective)
📈 An ascending structure (BOS) has formed on M30.
🟣 Buy Zone 3977–3979 coincides with the support trendline – a beautiful confluence point for buyers.
🔹 Resistance zone 3990–4000 is the area to confirm the main direction.
💫 Higher target: Fibonacci Extension 1.618 around 4049–4050, coinciding with the psychological resistance 4050.
🎯 3. Trading Plan Reference
💖 MAIN BUY (priority)
Entry: 3977–3979 | SL: 3970
TP: 3988 – 4000 – 4022 – 4040 – 4050
💢 SHORT SELL (when price reacts strongly at resistance)
Entry: 4012–4014 | SL: 4020
TP: 4002 – 3988 – 3965
⚠️ 4. Important Notes
Price needs to confirm through zone 3990 to reinforce the bullish trend.
If it breaks below 3970, the ascending structure is temporarily invalidated.
Today, prioritise buying according to the capital flow, sell only when there is a clear signal at the resistance zone.
🌷 5. Conclusion & Interaction with LanaM2
Gold is showing positive signals 💛
Patiently wait for reactions at the Buy Zone 3977–3979, this could be the starting point for a new upward move towards 4050.
This is not investment advice, just a personal perspective according to the ICT method.
If you find it useful, please 💛 like – 💬 comment – 🔔 follow LanaM2 to update gold analysis with me every day ✨

PCR Trading Strategies Common Option Strategies
Options can be combined in multiple ways to design strategies for any market condition:
Covered Call: Selling a call option against owned shares to earn premium income.
Protective Put: Buying a put to hedge against potential downside on owned shares.
Straddle: Buying both a call and put at the same strike and expiration to profit from volatility.
Strangle: Similar to a straddle but with different strike prices.
Iron Condor: A complex strategy selling two OTM options (one call, one put) and buying two further OTM options for limited risk and profit.
Butterfly Spread: Combines multiple options to profit from minimal price movement.
Each strategy balances risk, reward, and probability differently.

Part 2 Master Candle Stick Pattern Option Trading Styles
There are two primary styles of options:
American Options: Can be exercised at any time before the expiration date.
(Common in U.S. markets)
European Options: Can only be exercised on the expiration date.
(Common in index options and global markets)

Part 2 Intraday Master ClassKey Concepts and Terminology
Before understanding how option trading works, it’s important to grasp some basic terms:
Call Option: Gives the holder the right to buy an asset at a specific price (called the strike price) before a set date.
Put Option: Gives the holder the right to sell an asset at a specific strike price before a set date.
Strike Price: The predetermined price at which the underlying asset can be bought or sold.
Premium: The price paid to purchase an option contract. It represents the cost of owning the right to buy or sell.
Expiration Date: The date on which the option contract expires. After this date, the option becomes void.
In-the-Money (ITM): When exercising the option would result in a profit.
Out-of-the-Money (OTM): When exercising the option would not be profitable.
At-the-Money (ATM): When the asset’s market price is equal (or nearly equal) to the strike price.
Underlying Asset: The financial instrument on which the option is based—commonly a stock, index, or commodity.

Positional Trading and Swing Trading in the Indian Market1. What Is Positional Trading?
Positional trading is a strategy where traders hold their positions for several weeks to months, depending on the trend and potential price movement. It’s based on the belief that once a trend starts, it will continue for a considerable period. Traders focus on identifying such long-lasting trends and patiently ride them out, ignoring short-term volatility.
Unlike intraday trading, positional trading doesn’t require constant monitoring. Traders rely heavily on fundamental analysis and technical indicators to determine the stock’s overall direction. The idea is simple — find fundamentally strong companies or technical setups that show signs of an uptrend or downtrend and hold them until the trend matures.
For example, if a trader notices a breakout on a weekly chart with strong volume and expects the stock to rise due to positive earnings or sectoral growth, they may hold the position for weeks or even months.
2. What Is Swing Trading?
Swing trading, on the other hand, is a short- to medium-term trading strategy aimed at capturing price “swings” that occur within a trend. These swings typically last from a few days to a few weeks. Swing traders don’t aim to catch the entire trend; instead, they seek to profit from smaller, predictable moves within the broader market direction.
In the Indian context, swing traders often focus on stocks with high liquidity, such as those in the Nifty 50 or Bank Nifty, since these provide enough volatility and volume to generate consistent opportunities.
Swing traders rely heavily on technical analysis, using indicators such as moving averages, RSI (Relative Strength Index), MACD, Fibonacci retracements, and candlestick patterns to time their entries and exits.
3. Tools and Analysis Methods
Both strategies depend on technical analysis, but positional traders often combine it with fundamental research, while swing traders primarily depend on price action.
For Positional Traders:
Fundamental Analysis: Checking company earnings, management quality, sectoral growth, and macroeconomic indicators.
Technical Tools: Weekly charts, long-term moving averages (50-day, 200-day), support and resistance zones, and trendlines.
Volume Analysis: Confirmation of trend strength through increased trading volume.
Sentiment Indicators: Market breadth or institutional buying trends.
For Swing Traders:
Technical Indicators: RSI, MACD, Bollinger Bands, Fibonacci retracements, and pivot points.
Candlestick Patterns: Reversals (Hammer, Shooting Star, Engulfing), breakouts, or continuation patterns.
Momentum Indicators: Used to identify short bursts of price action.
News Flow & Events: Earnings announcements, RBI policy, or global cues that can move prices quickly.
4. Risk and Reward Dynamics
Risk management is central to both trading styles, but the approach differs:
Positional Trading Risks:
Since positions are held for weeks or months, traders face overnight risk and gap-up/gap-down openings due to news, results, or global market movements. However, since the focus is on the bigger trend, small fluctuations are ignored. Positional traders often use stop losses based on weekly chart structures and risk smaller capital per trade.
Swing Trading Risks:
Swing traders face short-term volatility and need to manage tight stop losses. Since they target quick gains, even a minor reversal can affect profits. The advantage is limited exposure time — positions are not held too long, reducing prolonged uncertainty.
Reward-wise, positional trades often yield higher returns per trade but take time to materialize, while swing trades produce frequent smaller gains that can compound effectively.
5. Market Conditions for Each Strategy
Market conditions greatly influence which strategy works best:
Positional Trading Works Best In:
Trending markets — either bullish or bearish. Stocks or indices showing clear breakouts or breakdowns after consolidation phases.
Example: During a sectoral bull run (like IT in 2020–21 or PSU banks in 2023), positional traders could hold positions for months and ride the trend.
Swing Trading Works Best In:
Range-bound or moderately volatile markets. When the Nifty oscillates between support and resistance, swing traders capitalize on those moves.
Example: When Nifty trades between 22,000–23,000 for several weeks, swing traders buy near the support zone and sell near resistance.
6. Capital and Margin Requirements
In India, both strategies can be implemented using cash or futures and options (F&O).
Positional Trading: Typically requires more capital because trades are held longer, and margin funding costs can add up. Investors in delivery mode (cash segment) need full capital but have no daily margin calls.
Swing Trading: Requires less capital since traders can use leverage or trade in F&O. However, due to short holding periods, frequent transaction costs and taxes can slightly reduce profits.
7. Emotional and Psychological Factors
Positional Trading Psychology:
Demands patience and discipline. Traders must tolerate price pullbacks and avoid reacting to daily market noise. Emotional stability and conviction in analysis are crucial.
Swing Trading Psychology:
Requires quick decision-making and emotional agility. Traders must be comfortable with fast-paced setups, quick exits, and booking partial profits. Impulsiveness or hesitation can lead to missed opportunities.
8. Examples in the Indian Context
Let’s understand through two practical examples:
Positional Trade Example:
Suppose Tata Motors shows a breakout above ₹950 on a weekly chart after months of consolidation with rising volumes and improving earnings outlook. A positional trader buys and holds, targeting ₹1,200–₹1,300 over 2–3 months while keeping a stop loss at ₹880.
Swing Trade Example:
HDFC Bank rebounds from support near ₹1,450 with bullish candles and RSI divergence. A swing trader buys and holds for 4–6 trading days, aiming for a move to ₹1,520–₹1,550, keeping a tight stop loss at ₹1,435.
9. Which Strategy Is Better for Indian Traders?
There is no universal answer — the better strategy depends on one’s capital base, personality, and time commitment.
Choose Positional Trading if you:
Have a full-time job and cannot monitor markets daily.
Prefer fundamental strength and long-term trend riding.
Can tolerate drawdowns and be patient.
Choose Swing Trading if you:
Can actively watch markets for setups.
Enjoy technical analysis and momentum trading.
Prefer quicker profits and short-term engagement.
Many successful Indian traders blend both — they maintain positional trades in trending sectors and take swing trades for short-term opportunities.
10. Conclusion
Positional and swing trading are two of the most practical and flexible trading styles in the Indian market. While positional trading is about patience, conviction, and trend-following, swing trading emphasizes timing, agility, and momentum capture. Both demand disciplined risk management, a solid understanding of technicals, and awareness of market sentiment.
In essence, positional trading builds wealth gradually, while swing trading builds income through active participation. A balanced trader who understands when to switch between the two — depending on market conditions — can truly harness the best of both worlds in India’s dynamic stock market.

Volume Secrets in TradingThe Hidden Force Behind Price Movements
In the world of trading, price often grabs all the attention. Traders talk about chart patterns, moving averages, and candlestick formations — but behind every price move lies the true driving force: volume. Volume is the heartbeat of the market, showing how many participants are involved and how strong or weak a move really is. Understanding the secrets hidden in volume can dramatically improve your trading accuracy and timing.
1. What is Volume in Trading?
Volume represents the number of shares, contracts, or lots traded during a specific time period. For example, if 10 lakh shares of Reliance Industries are traded on a given day, its daily volume is 10 lakh.
In simple terms, volume tells you how active the market is. Higher volume means more participation, stronger conviction, and greater liquidity. Lower volume, on the other hand, indicates weaker interest and often signals indecision or the end of a move.
Volume can be applied to any market — equities, futures, forex, or cryptocurrencies — and remains one of the most reliable indicators of institutional activity.
2. The Relationship Between Price and Volume
The secret of volume lies in understanding how it interacts with price. Volume confirms price moves and gives hints about whether a trend is genuine or fake.
Here’s how different combinations reveal the market’s true intent:
Rising Price + Rising Volume → Bullish confirmation. This shows strong buying interest and supports a sustainable uptrend.
Rising Price + Falling Volume → Weak rally. The uptrend may lack conviction and could soon reverse.
Falling Price + Rising Volume → Bearish confirmation. Indicates strong selling pressure and continuation of a downtrend.
Falling Price + Falling Volume → Weak decline. The downtrend may be losing strength and nearing a reversal.
By observing these relationships, traders can filter out false breakouts and spot trend reversals early.
3. Volume as a Measure of Strength
Volume acts like a polygraph for price action — it tells you whether the price is lying. A breakout without volume is like a car without fuel — it won’t go far. When price moves on heavy volume, it shows genuine interest from big players.
For instance, suppose a stock breaks a long resistance level at ₹500. If the breakout happens with double or triple the average volume, it means large institutions are accumulating. But if it happens on thin volume, it’s often a trap to lure retail traders before reversing.
4. Volume Patterns that Reveal Market Intent
A. Volume Spikes (Climactic Volume)
A sudden and massive surge in volume often signals a turning point. This is called climactic volume. It occurs when a trend reaches an emotional extreme — everyone wants in or out.
At market tops, climactic volume shows buying exhaustion — smart money is selling while the crowd is buying.
At market bottoms, climactic volume signals selling exhaustion — smart money starts accumulating as others panic.
B. Volume Dry-Up (Low Volume Areas)
Periods of low or drying volume often precede big moves. When a market becomes quiet and volume contracts, it shows that volatility is compressing — energy is building for the next strong move.
C. Volume Divergence
When price continues to move in one direction but volume doesn’t confirm it, it’s a warning signal. For example, if price keeps rising but volume declines, it shows weakening demand — a potential reversal is near.
5. Using Volume with Technical Indicators
Volume can be combined with other indicators to strengthen your analysis.
A. On-Balance Volume (OBV)
OBV adds volume on up days and subtracts it on down days. It helps to identify whether money is flowing in or out of a stock. If OBV rises while price stays flat, it suggests accumulation before a potential breakout.
B. Volume Moving Average
This shows average traded volume over a period, such as 20 days. A sudden rise above the average volume indicates unusual activity — often a sign that smart money is taking positions.
C. Volume Profile
A more advanced tool, Volume Profile shows how much volume traded at different price levels (not over time). It reveals price zones of heavy activity, known as High Volume Nodes (HVN), where market participants agree on value, and Low Volume Nodes (LVN), where price tends to move quickly through.
6. Secrets of Institutional Volume
Big institutions like mutual funds and FIIs cannot buy or sell massive quantities at once — they leave footprints in volume. Smart traders watch these clues to trade alongside them.
Accumulation Phase: Price stays in a range, but volume slowly builds. Institutions are quietly buying without moving the price much.
Breakout Phase: Once accumulation is done, price breaks out sharply with a surge in volume.
Distribution Phase: After a rally, volume remains high but price stops rising. Institutions start selling gradually.
Recognizing these volume footprints helps traders spot where big money is flowing.
7. Volume in Intraday Trading
In day trading, volume gives instant clues about short-term momentum.
The first hour usually shows the highest volume — a reflection of overnight news and institutional action.
Sudden volume bursts during the day often precede strong intraday breakouts.
Traders use Volume-Weighted Average Price (VWAP) to gauge institutional participation. If price stays above VWAP with strong volume, buying pressure dominates.
8. Secrets of Volume Confirmation
The biggest mistake traders make is to ignore volume confirmation during entries. Before taking any trade:
Check if the move is supported by above-average volume.
Watch for volume spikes at support or resistance zones.
Look for divergence between price and volume to detect traps.
A trade backed by strong volume has a higher probability of success because it reflects real participation.
9. Practical Tips to Use Volume Effectively
Track Average Daily Volume: Avoid illiquid stocks where volume is too low — they can show false moves.
Compare Relative Volume: Look at current volume vs. the average to spot unusual activity.
Use Volume in Multiple Timeframes: Confirm whether daily volume supports weekly or monthly trends.
Watch Breakouts and Pullbacks: Real breakouts always occur on high volume; healthy pullbacks often show lower volume.
Combine with Price Action: Never analyze volume in isolation — always relate it to what price is doing.
10. Conclusion: The Hidden Language of the Market
Volume is not just a number on your chart — it is the language of the market’s heartbeat. It reveals the story behind every price movement — who is in control, where smart money is active, and when trends are about to reverse.
By learning to read volume, traders gain a major edge. Price tells you what is happening, but volume tells you why it’s happening and whether it will continue. Mastering this hidden dimension transforms trading from guesswork into intelligent market reading.
In short, price is the headline, but volume is the truth behind it.
Geopolitical Energy TradingThe Intersection of Power, Politics, and Global Markets
Energy is the lifeblood of the global economy. Every modern industry—from manufacturing and transportation to technology and agriculture—relies on steady energy supplies. Yet, energy trading is not simply a matter of market forces like supply and demand. It is deeply shaped by geopolitics—the strategic and political relationships among nations. Geopolitical energy trading refers to the global buying, selling, and movement of energy resources such as oil, gas, coal, and renewables, influenced by political decisions, regional alliances, conflicts, and national interests.
In the 21st century, as countries compete for energy security, control over resources, and technological dominance in renewables, the geopolitical stakes of energy trading have never been higher.
1. The Foundation of Geopolitical Energy Trading
Energy trading is the mechanism through which countries and corporations buy and sell energy commodities across borders. Traditional markets have been dominated by fossil fuels—crude oil, natural gas, and coal. However, as the world moves toward cleaner energy, renewable energy credits, carbon permits, and electricity are becoming new instruments of trade.
Geopolitics enters this equation because energy resources are unevenly distributed. For instance:
The Middle East holds massive oil reserves.
Russia dominates natural gas exports to Europe.
The United States has become a major exporter of LNG (liquefied natural gas) and crude oil.
China is the world’s largest energy importer and a leading investor in renewable technologies.
This imbalance of resources creates dependencies, alliances, and rivalries that shape global energy flows.
2. Oil and Geopolitics: The Old Power Game
Crude oil has long been the most geopolitically sensitive commodity. The Organization of the Petroleum Exporting Countries (OPEC), formed in 1960, was one of the first examples of nations using collective control over energy supply to influence global politics and prices.
Oil’s strategic role became clear during events such as:
The 1973 Oil Crisis, when Arab OPEC members imposed an embargo on Western nations supporting Israel, causing oil prices to quadruple.
The Iran-Iraq War (1980s) and the Gulf War (1991), which disrupted oil production and transportation.
Russia-Ukraine tensions, where energy pipelines became tools of political leverage over Europe.
Oil prices often rise during conflicts in major producing regions, as traders fear supply disruptions. In response, consuming nations build strategic petroleum reserves (SPRs) to guard against shortages.
3. Natural Gas: The New Energy Weapon
Natural gas, once considered a regional fuel due to its transportation challenges, has become a global commodity thanks to LNG technology. Pipelines and LNG terminals now connect producers and consumers across continents.
However, gas also holds strong geopolitical weight. For decades, Europe’s dependence on Russian gas shaped diplomatic relations. When Russia invaded Ukraine in 2022, it used gas supply cuts as a political tool, leading to an energy crisis in Europe. European countries had to rapidly diversify, importing LNG from the US, Qatar, and Australia.
Similarly, China has built extensive energy partnerships through its Belt and Road Initiative (BRI), investing in pipelines from Central Asia and maritime terminals across Asia and Africa. These moves aim to secure long-term energy supplies while expanding China’s geopolitical influence.
4. The Rise of Energy Independence
Geopolitical energy trading also involves efforts by countries to reduce dependency on foreign suppliers. This strategy is known as energy independence.
For example:
The United States experienced an energy revolution through shale oil and gas extraction (fracking), turning it from a major importer into an exporter.
India is investing heavily in solar and green hydrogen to reduce crude import dependence.
European nations are accelerating renewable adoption to minimize reliance on unstable regions like the Middle East and Russia.
Energy independence reshapes global trade routes and weakens traditional energy powerhouses, redistributing influence among nations.
5. Renewables and the New Geopolitics
As the world transitions toward clean energy, a new form of geopolitical competition is emerging. Instead of fighting over oil wells, countries now compete for lithium, cobalt, rare earth elements, and solar panel technology—key inputs for renewable energy systems and electric vehicles.
For instance:
China dominates over 70% of the global solar panel and battery manufacturing market.
Chile, Australia, and Bolivia hold vast lithium reserves essential for EV batteries.
Africa is becoming a crucial player due to its mineral wealth.
This creates a new type of “green geopolitics” where nations with renewable technologies and resources hold strategic leverage. Control over energy transition technologies—such as grid infrastructure, hydrogen systems, and battery supply chains—could define the next era of energy dominance.
6. Energy Trading Hubs and Routes
Energy trading also depends on strategic chokepoints and hubs that influence transportation and pricing. Some of the world’s most vital routes include:
The Strait of Hormuz (linking Persian Gulf oil to global markets)
The Suez Canal (connecting Europe and Asia)
The Malacca Strait (key route for China and East Asia)
The Panama Canal (connecting Atlantic and Pacific trade flows)
Disruptions in any of these routes—due to war, piracy, or blockades—can send shockwaves through global markets.
Major trading hubs such as Singapore, Rotterdam, Houston, and Dubai facilitate physical energy trade and derivatives trading. They serve as price benchmarks and logistics centers for global traders.
7. Political Sanctions and Market Volatility
Sanctions are one of the most powerful geopolitical tools in energy trading. When major producers like Iran, Venezuela, or Russia face international sanctions, their oil and gas exports are restricted, affecting global supply and prices.
For example:
Sanctions on Iran reduced its oil exports, tightening supply in the Asian market.
Restrictions on Russian crude and gas after 2022 reshaped global flows, with Russian energy redirected to China and India at discounted rates.
These sanctions also triggered a surge in “shadow fleets”—unregulated tankers trading sanctioned oil covertly.
Geopolitical uncertainty creates volatility, which traders exploit through derivatives like futures and options, betting on price movements influenced by political developments.
8. Role of International Organizations
Several institutions influence the global energy trade’s geopolitical balance:
OPEC+, including Russia, coordinates oil output to stabilize prices.
The International Energy Agency (IEA) advises consumer nations on energy policy and emergency stockpiles.
The World Trade Organization (WTO) and United Nations mediate energy-related disputes and environmental regulations.
COP summits set climate targets that reshape long-term energy investment patterns.
Thus, energy trading is not only an economic system but also a diplomatic and regulatory framework managed through multilateral negotiations.
9. Emerging Trends and the Road Ahead
The next decade will redefine geopolitical energy trading through several key trends:
Decarbonization Pressure: Countries are racing to meet net-zero targets, creating demand for carbon trading and green hydrogen.
Regional Energy Blocs: Alliances like the BRICS and EU Energy Union are forming to coordinate energy policy and trade.
Digital Energy Markets: Blockchain and AI-based trading platforms are making energy exchange more transparent and efficient.
Energy Storage Wars: Control over battery production and recycling will become as critical as oil reserves once were.
As energy systems become more diversified, geopolitics will revolve around technology, supply chains, and environmental diplomacy rather than just resource control.
Conclusion
Geopolitical energy trading is a complex dance between power, economics, and survival. Nations leverage energy as both a weapon and a tool of cooperation. While fossil fuels continue to dominate global trade, the rise of renewables, electric mobility, and digital infrastructure is redrawing the geopolitical map.
In this evolving landscape, countries that balance energy security, diversification, and innovation will hold the upper hand. The transition from oil-based geopolitics to a multi-energy world will not end energy rivalries—but it will transform them into a new contest over clean technologies, supply chains, and strategic influence.
Small-Cap Index Funds Volatility Explained1. Understanding Small-Cap Index Funds
Small-cap index funds track market indices composed of small-cap stocks—companies typically valued between ₹5,000 crore and ₹20,000 crore in India (or between $300 million and $2 billion globally). Examples include the Nifty Smallcap 100 in India or the Russell 2000 Index in the U.S.
Unlike actively managed funds, index funds do not attempt to pick specific stocks; they simply mirror the performance of a predefined index. This makes them cost-effective and diversified, offering investors exposure to a wide range of small companies in one investment vehicle.
While this diversification helps reduce the risk of individual company failure, it doesn’t eliminate market-level volatility, especially in the small-cap segment.
2. Why Small-Cap Stocks Are Volatile
The key reason behind small-cap fund volatility lies in the nature of the underlying small companies. They are in the growth or expansion phase of their business cycle, which makes their earnings, cash flows, and valuations less stable than those of large, established firms.
Let’s break down the main causes:
a) Limited Financial Resources
Small-cap companies often have restricted access to credit and lower cash reserves. During economic downturns or credit crises, they struggle more than large firms to raise funds or maintain operations, which can cause sharp price declines.
b) Low Liquidity
Shares of small-cap companies are traded less frequently. When investors rush to buy or sell, prices can swing widely because there are fewer buyers or sellers in the market. This low liquidity amplifies short-term price movements.
c) Higher Business Risk
Many small-cap firms operate in niche markets or rely on a limited set of products. This lack of diversification in business models means that any disruption—such as regulatory changes, technological shifts, or a key customer loss—can severely impact their earnings and, consequently, stock prices.
d) Sensitivity to Economic Cycles
Small caps are considered economic barometers. They perform strongly during expansions when demand and growth rise, but they can fall sharply during recessions or when interest rates rise. This cyclical nature adds to their volatility.
e) Market Sentiment
Investor perception plays a significant role in small-cap stock movements. In bullish phases, investors often become overly optimistic, driving prices to unsustainable levels. Conversely, during market corrections, fear can lead to steep declines. Hence, sentiment swings are more pronounced in small-cap segments.
3. Historical Perspective: Volatility Patterns
Looking at historical data, small-cap indices have shown higher annualized volatility compared to large-cap indices. For instance, over long periods, the Nifty Smallcap 100 has displayed greater short-term fluctuations compared to the Nifty 50, though it has also offered higher potential returns over a 10-year horizon.
Periods of extreme volatility often follow market corrections or macroeconomic uncertainty—like the 2008 global financial crisis or the 2020 pandemic. However, in recovery phases, small caps tend to rebound faster and outperform, as investors return to riskier growth opportunities.
4. Measuring Volatility in Small-Cap Funds
Volatility can be measured using several metrics:
a) Standard Deviation
It measures how much a fund’s returns deviate from its average over time. A higher standard deviation indicates greater volatility. Small-cap index funds typically have a higher standard deviation than mid- or large-cap funds.
b) Beta
Beta measures a fund’s sensitivity to the overall market. A beta greater than 1 indicates that the fund is more volatile than the market. Small-cap funds usually have betas ranging from 1.2 to 1.5, meaning they move more sharply in both directions compared to broader market indices.
c) Sharpe Ratio
This metric shows how much excess return a fund provides per unit of risk. Although small-cap funds may have high volatility, if they generate proportionately higher returns, they can still deliver a favorable Sharpe ratio.
5. Short-Term vs Long-Term Volatility
Volatility matters most in the short term. Over days, weeks, or months, small-cap index funds can experience large swings—sometimes 5–10% in a single session during turbulent times.
However, over long investment horizons (5–10 years), these fluctuations tend to average out. Historically, investors who remained invested through multiple market cycles often benefited from the compounding effect of growth in small companies that later became mid- or large-cap giants.
6. Benefits of Volatility: Hidden Opportunities
While volatility often sounds negative, it also presents opportunities for disciplined investors:
Higher Growth Potential: Small companies have more room to grow their earnings, and as their valuations expand, investors benefit from capital appreciation.
Mean Reversion: After sharp sell-offs, small-cap indices often recover quickly, offering attractive entry points.
Diversification Advantage: Adding a small-cap index fund to a portfolio primarily composed of large-cap stocks can improve overall portfolio returns and balance risk.
Thus, for long-term investors who can tolerate fluctuations, volatility can be a friend, not a foe.
7. Managing Volatility: Smart Investment Strategies
To navigate small-cap volatility effectively, investors can adopt several strategies:
a) Long-Term Approach
Holding investments for 7–10 years allows time for small-cap companies to grow and for short-term volatility to even out.
b) Systematic Investment Plan (SIP)
Investing through SIPs helps average out the cost of purchase across market cycles, reducing the impact of volatility.
c) Diversification
Balancing small-cap exposure with mid-cap and large-cap funds creates a more stable portfolio. This helps cushion against sudden declines in the small-cap space.
d) Regular Review
Monitoring fund performance relative to benchmarks ensures that the fund continues to align with your risk tolerance and financial goals.
e) Avoid Market Timing
Trying to predict highs and lows in volatile segments often backfires. Staying invested consistently usually yields better results than frequent trading.
8. Who Should Invest in Small-Cap Index Funds?
Small-cap index funds are not suitable for everyone. They best fit investors who:
Have a high risk tolerance
Seek long-term capital growth
Can withstand temporary market declines
Understand that volatility is part of the journey toward higher returns
For conservative investors or those nearing financial goals, it’s advisable to keep small-cap allocation limited (say 10–15% of the equity portfolio).
9. Real-World Example
Consider the Nifty Smallcap 100 Index. Between March 2020 and November 2021, it surged over 150%, reflecting a massive post-pandemic recovery. Yet, in 2022, the same index dropped around 25% due to global inflation concerns and rate hikes. This wide swing highlights the volatility inherent in small caps—but also their recovery power.
10. Conclusion
Volatility in small-cap index funds is not inherently bad—it’s a reflection of the growth potential and risk embedded in smaller businesses. These funds fluctuate more because they mirror the economic pulse of emerging companies—dynamic, ambitious, and vulnerable.
For patient, informed, and risk-tolerant investors, small-cap index funds can be powerful tools for long-term wealth creation. However, success requires discipline: understanding the market cycles, managing emotions during downturns, and staying invested long enough for volatility to transform into opportunity.