Part 11 Trading Master Class With Experts What Are Options?
An option is a financial derivative contract that gives the holder the right, but not the obligation, to buy or sell an underlying asset (such as stocks, indices, or commodities) at a predetermined price (called the strike price) before or on a specific date (called the expiry date).
Unlike futures, which obligate both parties to transact, options provide flexibility. The buyer of the option pays a premium to the seller (writer) for this right.
Trade

Fundamental Analysis and Technical Analysis for Traders1. Introduction to Market Analysis
Market analysis helps traders evaluate the future price movements of assets like stocks, commodities, or currencies. The goal is to determine whether to buy, sell, or hold a security.
Fundamental Analysis focuses on intrinsic value — the “true worth” of a company or asset based on its financial and economic data.
Technical Analysis focuses on market behavior — analyzing charts, price movements, and patterns to predict future trends.
Both methods are valuable, and many professional traders use a blend of the two to confirm their strategies.
2. Understanding Fundamental Analysis
Fundamental Analysis is based on the belief that every asset has an intrinsic value determined by underlying financial and economic factors. If the market price is below this value, the asset is considered undervalued (a buy signal). If it’s above, it’s overvalued (a sell signal).
a. Purpose of Fundamental Analysis
The main goal is to determine whether a security is trading at a fair price. It answers the question: “Is this asset worth investing in for the long term?”
b. Key Components of Fundamental Analysis
Economic Analysis
Traders study macroeconomic indicators such as GDP growth, inflation, interest rates, employment levels, and fiscal policies. For example, lower interest rates often encourage borrowing and investment, boosting corporate earnings and stock prices.
Industry Analysis
Each company operates within an industry that affects its performance. Analysts evaluate industry trends, competition, growth potential, and regulatory environment. For example, the renewable energy sector may have strong prospects due to global sustainability trends.
Company Analysis
This involves studying a company’s financial health, management efficiency, and competitive position. Key financial statements used include:
Income Statement – reveals profitability.
Balance Sheet – shows assets, liabilities, and equity.
Cash Flow Statement – measures cash generation and spending.
c. Key Ratios Used in Fundamental Analysis
Price-to-Earnings (P/E) Ratio: Compares a company’s current price to its earnings per share.
Earnings Per Share (EPS): Measures profit allocated to each share.
Price-to-Book (P/B) Ratio: Compares market value to book value.
Debt-to-Equity Ratio: Indicates financial leverage and risk.
Return on Equity (ROE): Measures profitability relative to shareholder equity.
By combining these indicators, traders estimate whether the stock’s current price reflects its actual performance and growth potential.
3. Understanding Technical Analysis
Technical Analysis focuses on studying price action and market psychology through charts and indicators. The key belief is that “price discounts everything” — meaning all fundamental factors are already reflected in the market price.
a. Purpose of Technical Analysis
TA helps traders identify trends, entry and exit points, and potential reversals. It answers the question: “When should I buy or sell?”
b. Core Principles of Technical Analysis
Price Discounts Everything:
All news, earnings, and expectations are already factored into the price.
Prices Move in Trends:
Markets tend to move in identifiable trends — upward (bullish), downward (bearish), or sideways (consolidation).
History Repeats Itself:
Market behavior is influenced by human psychology, and price patterns often repeat over time.
c. Tools and Techniques in Technical Analysis
Charts and Patterns
Line Charts: Simplest form, showing closing prices.
Bar Charts: Show open, high, low, and close (OHLC).
Candlestick Charts: Visual representation of price action using candles.
Common patterns include:
Head and Shoulders: Indicates a reversal trend.
Triangles: Signal continuation or breakout.
Double Top/Bottom: Suggest trend reversal.
Indicators and Oscillators
Moving Averages (MA): Smooth out price data to identify trends.
Relative Strength Index (RSI): Measures overbought or oversold conditions.
MACD (Moving Average Convergence Divergence): Detects momentum and trend reversals.
Bollinger Bands: Measure market volatility.
Volume Profile: Shows traded volumes at different price levels, identifying strong support and resistance zones.
Support and Resistance Levels
Support is where the price tends to stop falling; resistance is where it tends to stop rising. These levels guide traders in planning entries and exits.
4. Comparison Between Fundamental and Technical Analysis
Aspect Fundamental Analysis Technical Analysis
Objective Determines intrinsic value Identifies price trends
Approach Based on financial & economic data Based on charts & indicators
Time Horizon Long-term Short-term to medium-term
Data Used Earnings, assets, economic growth Price, volume, patterns
Focus “Why” the price moves “When” the price moves
Best for Investors Traders
Drawback Slow to react to market moves Can ignore fundamentals
Both methods complement each other. For example, a trader might use fundamental analysis to choose a strong stock and technical analysis to time the entry and exit.
5. How Traders Combine Both Approaches
Many professional traders use a hybrid approach, combining the best of both worlds:
Step 1: Use Fundamental Analysis to select fundamentally strong stocks or currencies with good long-term prospects.
Step 2: Apply Technical Analysis to find the right time to enter or exit trades.
For example, if a company reports rising profits and strong guidance (fundamental strength), but the stock price is currently in a consolidation phase, a trader may wait for a breakout above resistance (technical signal) before buying.
6. Advantages and Limitations
a. Fundamental Analysis
Advantages:
Ideal for long-term investors.
Helps identify undervalued or overvalued assets.
Focuses on financial strength and future potential.
Limitations:
Not effective for short-term trading.
Market prices can remain irrational despite strong fundamentals.
Time-consuming data collection.
b. Technical Analysis
Advantages:
Useful for short-term trading decisions.
Provides clear entry and exit signals.
Reflects real-time market sentiment.
Limitations:
Can give false signals in volatile markets.
Ignores fundamental value.
Requires discipline and experience to interpret correctly.
7. Practical Example
Imagine two traders analyzing Infosys Ltd.
Trader A (Fundamental Analyst): Examines the company’s quarterly earnings, strong IT sector growth, and healthy balance sheet. He believes the stock is undervalued and buys it for the long term.
Trader B (Technical Analyst): Studies price charts, notes a bullish crossover in the MACD, and buys for a short-term rally.
Both traders are profitable but have different objectives and strategies. This shows how FA and TA can coexist effectively.
8. Conclusion
Fundamental and Technical Analysis are two powerful yet distinct methods for understanding market movements.
Fundamental Analysis helps you understand what to buy by identifying assets with strong financial potential.
Technical Analysis helps you decide when to buy or sell by tracking market behavior and sentiment.
In essence, fundamentals tell the story, and technicals tell the timing. Successful traders often combine both — using fundamentals to choose quality assets and technicals to manage entry, exit, and risk. In today’s fast-moving markets, mastering both approaches gives traders a strategic edge and helps them make well-informed, confident trading decisions.
Part 7 Trading Master Class With Experts Option Pricing: Understanding the Premium
Option prices are determined by several variables, most famously modeled using the Black-Scholes formula. The main components are:
Underlying Price: The current price of the asset.
Strike Price: The agreed-upon price for the option.
Time to Expiry: Longer durations increase premium due to higher uncertainty.
Volatility: Measures how much the underlying asset’s price fluctuates; higher volatility increases option prices.
Interest Rates and Dividends: Minor but relevant factors affecting option pricing.
Option premium = Intrinsic Value + Time Value
As expiration approaches, the time value declines—this is called time decay (Theta). This is why option sellers often benefit from the passage of time if prices remain stable.

Part 4 Learn Institutional Trading Key Terminology in Option Trading
To understand options, one must be familiar with some basic terms:
Underlying Asset: The instrument on which the option is based (e.g., stock, index, or commodity).
Strike Price: The price at which the option holder can buy (call) or sell (put) the asset.
Premium: The cost paid by the option buyer to acquire the contract.
Expiration Date: The date when the option contract becomes void.
In-the-Money (ITM): A call option is ITM when the underlying price is above the strike; a put is ITM when the price is below the strike.
Out-of-the-Money (OTM): The opposite of ITM. The call option has no intrinsic value when the price is below the strike; a put option has none when the price is above the strike.
At-the-Money (ATM): When the underlying price and strike price are nearly equal.
Intrinsic Value: The actual profit if the option were exercised immediately.
Time Value: The portion of the premium that reflects the probability of the option gaining value before expiry.

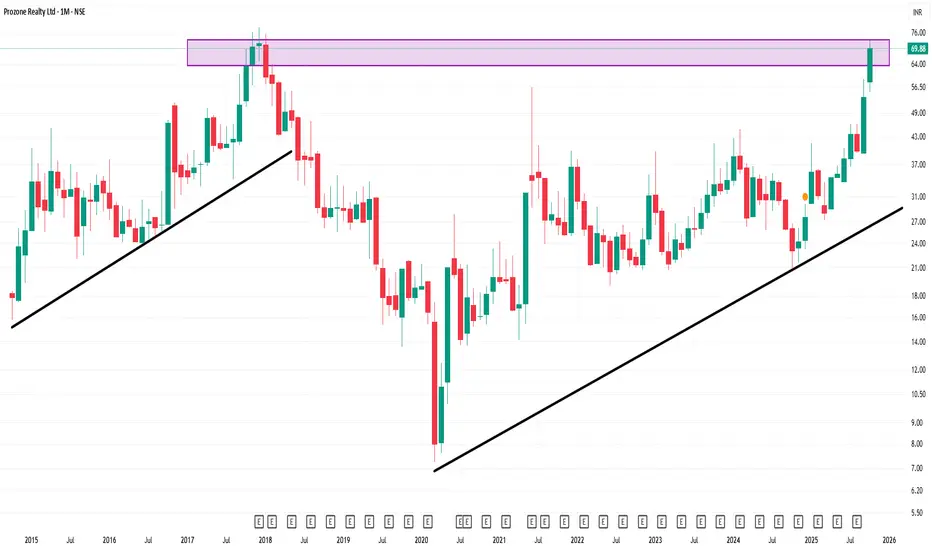
PROZONE 1 Month Time Frame ✅ Key Data Snapshot
Current quoted price: ~ ₹62.87.
52-week range: approximately ₹20.91 – ₹68.18.
Fundamental state: The company has had losses (negative EPS), modest margins in recent Q1 (net profit ₹0.73 cr vs prior loss) but fundamentals are still weak.
Technical / momentum: Recent 1-month return reported ~ +33.95% (per ET) suggesting strong short-term momentum.
AI, Big Data & Predictive Analytics in TradingIntroduction: The Fusion of Technology and Markets
Over the last two decades, the world of trading has evolved from simple human-driven decisions to a technologically advanced ecosystem powered by artificial intelligence (AI), big data, and predictive analytics. Financial markets today generate an immense volume of data every second—from stock prices, news feeds, social media sentiment, and macroeconomic indicators to even satellite imagery and alternative data sources.
The challenge for traders and investors is no longer about accessing information, but rather about interpreting and utilizing it effectively. This is where AI, Big Data, and Predictive Analytics step in. They collectively empower traders to identify opportunities, manage risk, and execute strategies faster and more accurately than ever before.
1. Understanding the Core Concepts
Before diving deeper, it’s important to define the three core components transforming trading:
Artificial Intelligence (AI)
AI refers to computer systems that can perform tasks requiring human-like intelligence—such as recognizing patterns, making decisions, and learning from experience. In trading, AI systems can analyze historical data, detect anomalies, and even make autonomous buy/sell decisions.
Big Data
Big Data represents the massive and complex sets of information generated from multiple sources—market feeds, economic reports, tweets, and even sensor data. This data is often characterized by the three Vs: Volume (massive size), Velocity (speed of generation), and Variety (different data types). Traders use big data analytics tools to uncover hidden correlations and market insights that traditional models often miss.
Predictive Analytics
Predictive analytics involves using statistical algorithms, data mining, and machine learning to forecast future outcomes. In trading, predictive models analyze historical price behavior, market sentiment, and macroeconomic indicators to predict price movements, volatility spikes, or trend reversals.
Together, these three technologies form the backbone of quantitative and algorithmic trading in modern markets.
2. How Big Data Fuels Modern Trading
Every tick, trade, and transaction in the financial market adds to a sea of information. Big Data allows traders to capture this data and extract actionable intelligence.
Key Sources of Big Data in Trading:
Market Data: Price feeds, order book data, volume profiles, and volatility indices.
Fundamental Data: Corporate earnings, balance sheets, macroeconomic indicators.
Alternative Data: Social media sentiment, Google search trends, web traffic analytics.
Geospatial and Satellite Data: Used by hedge funds to monitor industrial activity or crop yields.
Transactional Data: Payment records and credit card spending patterns reflecting consumer sentiment.
How It’s Used:
Big Data analytics tools process petabytes of information to detect correlations—for example, how rising oil prices might affect airline stocks or how social media mentions of a company could influence its short-term price.
For instance, quant funds like Renaissance Technologies or Two Sigma rely heavily on structured and unstructured data sets to find non-obvious relationships that traditional analysis would overlook.
The Competitive Edge:
In today’s markets, possessing more data is not enough; it’s about who can analyze it faster and smarter. Traders equipped with real-time analytics can identify shifts in sentiment or volatility before the rest of the market reacts—turning milliseconds of advantage into millions in profit.
3. The Role of Artificial Intelligence in Trading
AI takes data analysis one step further by enabling systems that learn from experience and adapt to changing market conditions.
Key AI Applications in Trading:
Machine Learning Models
These algorithms train on historical data to recognize patterns—such as when a stock is likely to break out of a price range.
Models like Random Forests, Gradient Boosting, and Neural Networks are frequently used to predict asset prices, volatility, and correlations.
Deep Learning and Neural Networks
Deep learning networks simulate human brain behavior to find intricate nonlinear patterns.
In trading, deep learning models are used for image recognition (chart pattern identification), natural language processing (news sentiment), and time-series forecasting.
Natural Language Processing (NLP)
NLP allows AI systems to “read” and “understand” text-based data—such as earnings reports, news headlines, and tweets.
For example, algorithms can instantly gauge whether a CEO’s statement is positive, neutral, or negative and trade accordingly.
Reinforcement Learning
A type of AI that learns optimal strategies through trial and error.
Used in portfolio optimization, automated trading bots, and dynamic risk management systems.
Robo-Advisors
AI-driven investment platforms that automatically allocate portfolios based on user goals and risk appetite.
They continuously rebalance portfolios as market conditions change—offering accessibility to retail investors at minimal cost.
AI in Decision-Making:
Unlike human traders, AI doesn’t suffer from fatigue or emotions. It executes based purely on logic and data-driven signals. This reduces bias and improves trading consistency, though it introduces new risks, such as algorithmic errors or overfitting.
4. Predictive Analytics: The Power of Forecasting
Predictive analytics bridges the gap between past and future by transforming historical patterns into forecasts.
Techniques Used in Predictive Analytics for Trading:
Regression Models: Estimate the relationship between variables (e.g., GDP growth and stock index performance).
Time-Series Analysis: Forecast price trends using historical data patterns, volatility clustering, and seasonal effects.
Monte Carlo Simulations: Model multiple possible future price paths to estimate risk.
Sentiment Analysis: Assess the emotional tone behind market chatter to predict short-term volatility.
Event-Driven Modeling: Predict market reactions to upcoming earnings, interest rate decisions, or geopolitical events.
For example, predictive analytics might identify that when gold prices rise by 2% and the dollar index falls by 1%, emerging market equities tend to outperform within two weeks. Such insights help traders position themselves ahead of time.
5. Real-World Examples of AI and Data-Driven Trading
High-Frequency Trading (HFT):
Firms like Citadel Securities and Jump Trading use AI-powered algorithms to execute thousands of trades per second. These systems react to micro-changes in prices faster than any human could.
Quantitative Hedge Funds:
Funds such as Renaissance Technologies, Two Sigma, and AQR Capital Management rely on massive datasets and machine learning models to identify repeatable patterns. Their edge lies in continuously retraining models to adapt to new data.
Retail Trading Platforms:
Apps like Robinhood, Zerodha, and eToro integrate AI tools to recommend trades, provide risk alerts, or forecast trends using sentiment indicators and pattern recognition.
Sentiment Analysis Tools:
AI-driven analytics platforms (like Dataminr or Accern) scan millions of online data points in real-time to alert traders to breaking news before it hits mainstream outlets.
6. Advantages of AI, Big Data & Predictive Analytics in Trading
Speed and Efficiency:
Automated systems process millions of data points in milliseconds—far beyond human capability.
Data-Driven Objectivity:
Decisions are made on logic and data, not emotion or intuition.
Pattern Recognition:
AI can detect complex, nonlinear relationships that traditional models miss.
Risk Management:
Predictive analytics can forecast potential drawdowns and volatility spikes, allowing traders to hedge in advance.
Cost Reduction:
AI and automation reduce manual analysis time and the cost of large research teams.
Scalability:
Models can be applied across multiple asset classes and markets simultaneously.
7. Challenges and Limitations
Despite the benefits, AI and Big Data in trading come with certain limitations:
Data Quality and Noise:
Massive datasets often contain errors or irrelevant data, leading to false signals.
Overfitting:
Models trained too specifically on past data may fail in changing market conditions.
Black-Box Models:
Deep learning models often lack transparency—making it hard to explain why a trade was made.
Ethical and Regulatory Risks:
The use of AI raises questions about fairness, accountability, and compliance with financial regulations.
Market Crowding:
When many algorithms follow similar patterns, it can lead to sudden flash crashes or liquidity imbalances.
8. The Future of AI and Predictive Trading
The future of trading lies in integration—where AI, big data, and predictive analytics merge seamlessly to create adaptive, self-learning trading ecosystems.
Emerging Trends:
Explainable AI (XAI): Focus on improving transparency and interpretability of AI decisions.
Quantum Computing: Expected to revolutionize predictive analytics with faster, more complex computations.
Hybrid Models: Combining human intuition with AI precision for balanced decision-making.
Alternative Data Expansion: Use of geolocation, climate, and sentiment data for edge prediction.
Automated Risk Assessment: Real-time portfolio stress testing through predictive algorithms.
Human-AI Collaboration:
While AI excels at processing data, human traders still play a vital role in understanding macro context, ethics, and judgment calls. The most successful trading models of the future will combine human experience with machine intelligence.
9. Conclusion: Data Is the New Alpha
In the modern trading world, data is the new form of “alpha”—the edge that separates winning strategies from the rest. The combination of AI, Big Data, and Predictive Analytics is redefining not just how markets are analyzed, but how decisions are made, risks are managed, and profits are realized.
Traders who harness these technologies gain access to a level of precision, speed, and foresight that was once unimaginable. Yet, the true success lies in balance—using data-driven insights while maintaining human oversight and adaptability.
In essence, the trading floor of the future isn’t just about human intuition or machine learning—it’s about intelligent collaboration between the two, powered by algorithms that see the unseen and predict the unpredictable.
Algorithmic & Quantitative TradingIntroduction
Over the past two decades, the global financial markets have transformed from bustling trading floors filled with human brokers shouting orders to high-speed electronic exchanges dominated by algorithms. This shift represents one of the most profound technological revolutions in finance — the rise of Algorithmic and Quantitative Trading (AQT).
These two closely related fields leverage mathematics, statistics, and computing to make trading more efficient, data-driven, and disciplined. They have not only changed how trades are executed but also how investment decisions are made. Understanding algorithmic and quantitative trading is therefore essential for grasping how modern financial markets truly function today.
1. Understanding Algorithmic Trading
1.1 Definition and Core Concept
Algorithmic trading (Algo trading) refers to the use of computer algorithms — step-by-step sets of coded instructions — to execute trades automatically based on pre-defined criteria such as price, timing, volume, or market conditions.
In simpler terms, instead of a human clicking a buy or sell button, a computer program makes the decision and executes it faster than any human could.
An algorithm can be designed to:
Identify trading opportunities,
Execute trades at optimal prices,
Manage risk through stop-loss or profit-taking rules, and
Adjust its strategy dynamically as the market evolves.
The central goal of algorithmic trading is to eliminate human emotion and delay from the trading process, thereby increasing speed, precision, and consistency.
2. The Evolution of Algorithmic Trading
Algorithmic trading began in the 1970s with electronic trading systems like NASDAQ. The real explosion came in the 1990s and early 2000s with advances in computing power and connectivity. By 2010, a significant portion of trading volume in developed markets such as the U.S. and Europe was algorithmic.
Today, algorithms are responsible for over 70% of equity trades in the U.S. and an increasing share of trades in emerging markets like India. The evolution has moved through stages:
Simple Execution Algorithms – Used to break large institutional orders into smaller parts to minimize market impact.
Statistical Arbitrage and Pairs Trading – Exploiting small price inefficiencies between related securities.
High-Frequency Trading (HFT) – Using ultra-fast systems to exploit millisecond-level market movements.
AI-Driven and Machine Learning Algorithms – Continuously adapting strategies using live market data.
3. How Algorithmic Trading Works
Algorithmic trading operates through a set of coded rules implemented in trading software. A basic algorithm typically includes the following components:
3.1 Strategy Definition
This is where the logic of the trade is specified. For instance:
Buy 100 shares of XYZ if the 50-day moving average crosses above the 200-day moving average (a “Golden Cross”).
Sell a stock if its price falls 2% below the previous day’s close.
3.2 Market Data Input
Algorithms consume real-time and historical data — prices, volumes, order book depth, and even news sentiment — to make decisions.
3.3 Signal Generation
Based on input data, the algorithm identifies a trading opportunity, generating a buy or sell signal.
3.4 Order Execution
The algorithm automatically places orders in the market, sometimes splitting large orders into smaller “child orders” to minimize price impact.
3.5 Risk Management
Modern algorithms include risk controls, such as maximum position size, stop losses, or exposure limits, to prevent major losses.
3.6 Performance Monitoring
Traders or institutions continuously monitor the algorithm’s performance and make parameter adjustments when required.
4. Understanding Quantitative Trading
4.1 Definition
Quantitative trading (Quant trading) focuses on using mathematical and statistical models to identify profitable trading opportunities. While algorithmic trading automates execution, quantitative trading focuses on the design and development of the trading strategy itself.
In essence:
Quantitative Trading = The science of building strategies using data and math.
Algorithmic Trading = The engineering of executing those strategies efficiently.
Most modern trading operations combine both — a quant model discovers the opportunity, and an algorithm executes it automatically.
5. The Building Blocks of Quantitative Trading
5.1 Data Collection and Cleaning
Quantitative trading begins with data — historical prices, volume, fundamentals, economic indicators, sentiment data, etc. This data must be cleaned, normalized, and structured for analysis.
5.2 Hypothesis Development
A quant trader might form a hypothesis such as “small-cap stocks outperform large-caps after earnings surprises.” The model then tests this hypothesis statistically.
5.3 Backtesting
The strategy is simulated on historical data to measure performance, risk, and robustness. Metrics such as Sharpe Ratio, drawdown, and win rate are used to evaluate success.
5.4 Optimization
Parameters are fine-tuned to improve results without overfitting (a common trap where a model performs well historically but fails in live markets).
5.5 Execution and Automation
Once validated, the strategy is deployed through algorithmic systems for live execution.
6. Common Quantitative Strategies
Quantitative trading covers a wide range of strategies, including:
Statistical Arbitrage – Exploiting temporary mispricings between correlated assets.
Mean Reversion – Betting that prices will return to their long-term average after deviations.
Momentum Trading – Riding the wave of stocks showing strong price trends.
Market Making – Providing liquidity by continuously quoting buy and sell prices.
Event-Driven Strategies – Trading based on corporate actions like earnings announcements or mergers.
Machine Learning Models – Using AI to identify hidden patterns or predict price movements.
7. Role of Technology in Algorithmic and Quantitative Trading
Technology is the backbone of AQT.
Key technological pillars include:
7.1 High-Speed Connectivity
Millisecond-level latency can determine profitability in markets dominated by speed.
7.2 Co-location and Proximity Hosting
Firms place their trading servers physically close to exchange servers to minimize transmission delay.
7.3 Advanced Programming Languages
Languages like Python, C++, and Java are used to develop models and execution systems.
7.4 Big Data and Cloud Computing
Handling terabytes of market data requires scalable computing environments.
7.5 Artificial Intelligence and Machine Learning
AI systems can continuously learn from new data, adapt to market changes, and improve their predictive accuracy.
8. Advantages of Algorithmic & Quantitative Trading
8.1 Speed and Efficiency
Algorithms execute trades in microseconds, ensuring optimal entry and exit points.
8.2 Emotion-Free Decisions
Trading based on predefined rules eliminates emotional biases such as fear or greed.
8.3 Better Execution and Reduced Costs
Execution algorithms reduce slippage (difference between expected and actual trade prices) and transaction costs.
8.4 Backtesting and Strategy Validation
Traders can test strategies on historical data before risking capital.
8.5 Diversification
Algorithms can manage multiple strategies and asset classes simultaneously, reducing overall portfolio risk.
9. Challenges and Risks
Despite its sophistication, algorithmic and quantitative trading comes with notable risks:
9.1 Overfitting and Model Risk
A strategy that performs brilliantly on past data might fail miserably in live markets if it’s over-optimized.
9.2 Market Volatility Amplification
Algorithms can sometimes intensify volatility, as seen during events like the 2010 “Flash Crash.”
9.3 Technical Failures
Software glitches, connectivity losses, or coding errors can lead to massive financial losses.
9.4 Competition and Saturation
As more firms adopt similar strategies, profit opportunities diminish — leading to a “race to the bottom.”
9.5 Regulatory and Ethical Issues
Market regulators constantly monitor algorithmic activity to prevent manipulation such as spoofing or layering.
10. Regulation of Algorithmic Trading
Globally, regulators have imposed frameworks to ensure transparency and fairness.
For example:
U.S. SEC & FINRA regulate algorithmic practices under strict risk control requirements.
MiFID II in Europe demands algorithmic systems undergo stress testing and registration.
SEBI (India) has guidelines requiring brokers to seek prior approval before deploying any algo strategy and maintain strong risk controls.
The goal is to ensure that the speed advantage of technology does not compromise market integrity.
11. The Role of Data Science and Machine Learning
The next frontier in AQT lies in Machine Learning (ML) and Artificial Intelligence (AI). These technologies go beyond rule-based systems by allowing algorithms to learn from experience.
For instance:
Neural Networks can predict short-term price direction based on complex non-linear relationships.
Natural Language Processing (NLP) can analyze news headlines or social media sentiment to anticipate market reactions.
Reinforcement Learning allows algorithms to evolve and optimize trading behavior through trial and feedback.
The integration of ML transforms traditional models into adaptive, self-learning systems capable of functioning even in rapidly changing environments.
12. The Human Element in a Quant World
Despite the automation, humans remain central to algorithmic and quantitative trading.
Quantitative analysts (“quants”) design and validate models, while risk managers ensure systems operate within limits.
Moreover, intuition and judgment still matter — particularly in interpreting data, handling market anomalies, or adjusting strategies during unexpected events like geopolitical crises or pandemics.
Thus, the future of AQT is not about replacing humans but enhancing their decision-making power through technology.
13. Future Trends in Algorithmic & Quantitative Trading
The future of AQT is shaped by several emerging trends:
AI-Driven Adaptive Systems: Fully autonomous algorithms capable of evolving in real time.
Quantum Computing: Expected to dramatically enhance processing speeds and optimization capacity.
Blockchain Integration: Smart contracts could enable decentralized, algorithmic trading platforms.
Retail Algorithmic Access: Platforms like Zerodha’s Streak or Interactive Brokers’ APIs are democratizing algo trading for retail investors.
Sustainability and ESG Integration: Algorithms now factor in environmental and social data to align with ethical investing trends.
These innovations will make markets more efficient but also more complex, demanding greater regulatory oversight and risk awareness.
Conclusion
Algorithmic and Quantitative Trading represent the perfect blend of mathematics, technology, and finance. Together, they have revolutionized the way markets operate — making trading faster, more efficient, and more data-driven than ever before.
While algorithms dominate execution, quantitative models drive strategy formulation. The synergy between them defines modern finance’s competitive edge. Yet, success in this domain requires not just technical skill but also rigorous risk control, continuous learning, and a deep understanding of market behavior.
As we look ahead, the boundary between human intelligence and artificial intelligence in markets will continue to blur. The future trader will be part mathematician, part programmer, and part strategist — operating in a world where data is the new currency and algorithms are the engines that power the markets of tomorrow.
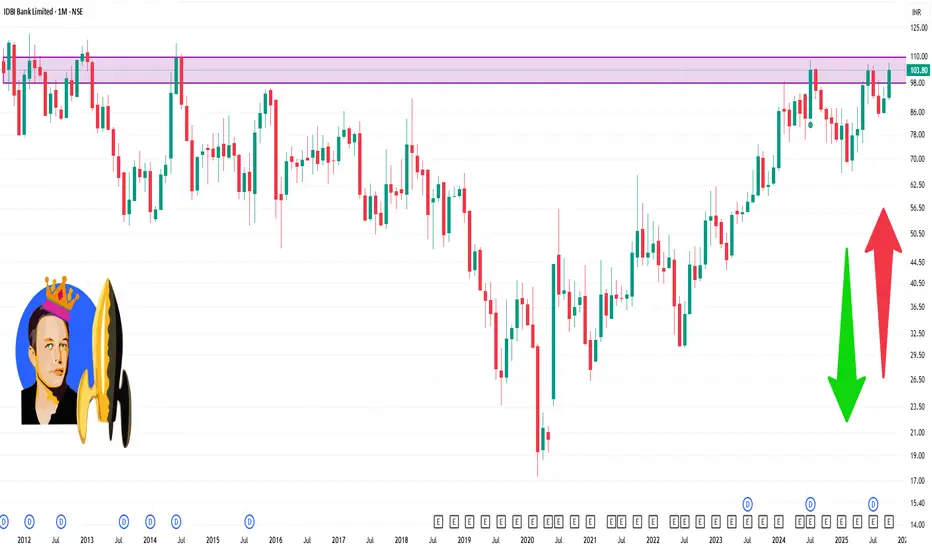
IDBI 1 Month Time Frame ✅ Current snapshot
Stock is trading around ₹ 93-100 (recent levels).
52-week high ~ ₹ 106.3, 52-week low ~ ₹ 65.9.
Technical summary (monthly time-frame) shows indicators leaning “Strong Buy” overall according to one provider.
Fundamentals: P/E ~ ~10-11x, book value ~ ₹63-64 (various sources) and modest dividend yield (~2.2%).
Key development: The government + Life Insurance Corporation of India (LIC) are moving ahead with strategic changes for IDBI (which could provide medium-term tailwinds).
Part 2 Ride The Big Moves Advantages of Option Trading
Option trading offers several benefits:
Leverage: Small premiums control large positions, magnifying potential returns.
Flexibility: Options can be used for income generation, speculation, or hedging.
Limited Risk for Buyers: The maximum loss for option buyers is limited to the premium paid.
Diverse Strategies: Traders can design complex setups for any market condition.
Portfolio Protection: Helps reduce downside risks without liquidating assets.
Because of these advantages, options have become integral to both institutional and retail trading strategies worldwide.

Part 1 Intraday Master ClassParticipants in Option Markets
There are generally four participants in an options market:
Buyers of Call Options – Expect prices to rise.
Sellers (Writers) of Call Options – Expect prices to remain stable or fall.
Buyers of Put Options – Expect prices to fall.
Sellers (Writers) of Put Options – Expect prices to remain stable or rise.
Buyers pay the premium and hold limited risk but unlimited profit potential. Sellers receive the premium but bear potentially unlimited risk, especially in the case of uncovered or “naked” positions. This difference in risk profile defines the strategic balance of the options market.

LiamTrading - XAUUSD: Outlook $5,000 USD and Priority BUY... LiamTrading - XAUUSD: Outlook $5,000 USD and Priority BUY Strategy at POC $3973
Hello traders community,
Gold is positioned between an extremely optimistic long-term outlook (forecast $5,000 USD in the next 12-18 months by Bank of America) and short-term technical adjustments.
Although Gold has broken the upward trendline, a sustainable downward trend has not been confirmed.
BUY positions are still prioritised!
🔥 LONG-TERM CONTEXT & INFLATION
Long-Term Push: Gold prices adjusted for inflation have DOUBLED in the past 4 years.
Highlight: Gold reinforces its role as an anti-inflation asset as real prices soar to all-time highs.
📊 DETAILED TRADING PLAN (ACTION PLAN)
Strategy: Buy at POC Zone to leverage liquidity advantage.
🟢 BUY Scenario (BUY Primary) - Buy at High Value Zone
Logic: The $3973 - 3975$ zone is right above the Buy POC (highest value zone).
Entry (BUY): $3973 - 3975$
SL: $3968$
TP1: $3988$ | TP2: $4000
Buy Up Target 2: Buy when price retests the trendline around $4002$.
🔴 SELL Scenario (SELL Scalping) - Preemptive strike at resistance zone
Entry (SELL): $4032 - 4034$
SL: $4040$
TP1: $4022$ | TP2: $4015
📌 SUMMARY & DISCIPLINE (Liam's Note)With the $5,000 USD forecast and inflation factors, the risk of SELL is increasing.
Focus on BUY at POC $3973$ and absolute SL.
Trade responsibly and with discipline!

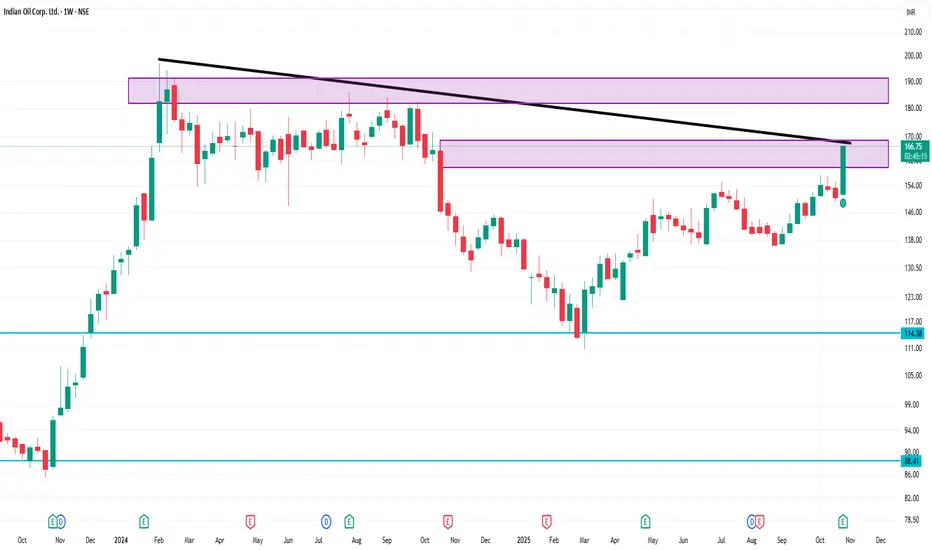
IOC 1 Week Time Frame 📍 Key Levels to Monitor (weekly chart)
Support zone: ~ ₹150-155. This is a region where past moving averages / consolidation occurred (also near 200-week MA).
Near-term support: ~ ₹160. If price dips, watch for reaction around this level.
Resistance / breakout area: ~ ₹166-170. Past highs / pivot region. If price convincingly breaks above this with volume, higher targets could be triggered. In the daily technicals, pivot-classic R1 ~ ₹166.54.
Next upside potential: If breakout happens, next zone maybe ~ ₹175-180 (psychological+historic highs) — but only once structure is confirmed.
Risk trigger: A close below ~ ₹150 might shift trend bias to more neutral/weak.
LUPIN 1 Hour Time Frame📊 Key Levels (1-Hour Timeframe)
Here are rough levels to watch on an intraday/trading base:
Resistance / supply zone: ~ ₹1,970 to ₹2,000
Immediate resistance: ~ ₹1,955 to ₹1,970
Pivot–mid zone: ~ ₹1,920 to ₹1,940
Support / demand zone: ~ ₹1,880 to ₹1,900
Stronger support: ~ ₹1,850 to ₹1,870

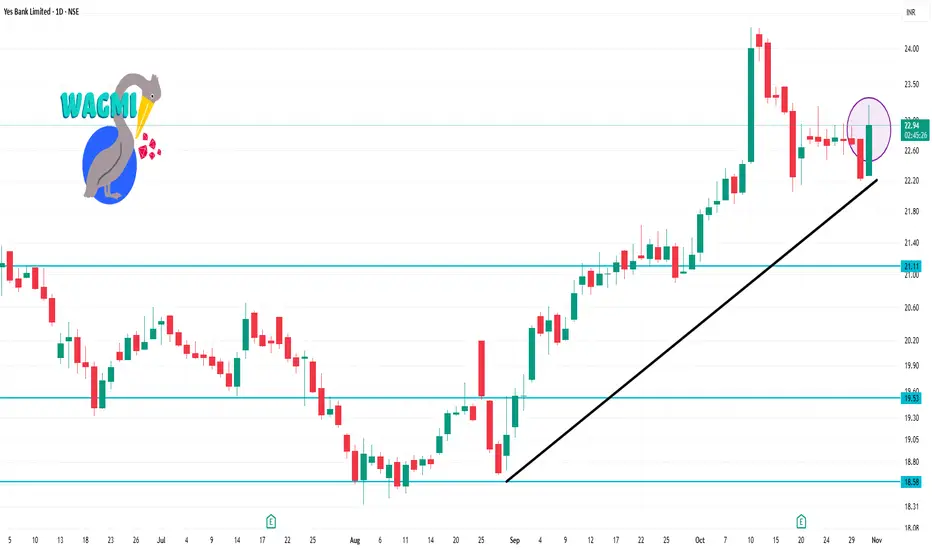
YESBANK 1 Day Time Frame ✅ Key Technical Levels & Indicators
Recent price around ₹22.60–₹22.70.
Support zones: ~ ₹22.22 (short term) and ~ ₹20.97 (medium term) according to MarketScreener.
Resistance: ~ ₹24.03 region.
Pivot (classic) for the day: ~ ₹22.58.
Daily technical indicator summary: Many moving averages show bullish (price above SMA/EMA) for 20/50/200 day on some sites.
Oscillators: RSI in mid-range (~46.6) signalling neither strongly overbought nor oversold.
Short-term trend: Many tools flag “bullish” in short, medium and long term.
Future Outlook: Sustaining the IPO and SME Momentum1. The Current Landscape: A Golden Era of Listings
Over the last few years, India’s IPO market has seen an unprecedented rise in activity. From digital-first startups to traditional manufacturers, companies of all sizes have turned to public markets to raise growth capital. The mainboard has been dominated by big-ticket issues from established corporations, while the SME segment—once overlooked—has emerged as a thriving hub of entrepreneurial listings.
According to data from stock exchanges, the SME IPO segment alone has outperformed expectations, with subscription levels often reaching several hundred times the offer size. The growing investor base, increased participation of retail and HNI investors, and digital platforms simplifying IPO applications have all contributed to this boom.
For SMEs, going public is not just about capital—it is a signal of credibility and stability. Listing on the NSE Emerge or BSE SME platforms allows smaller firms to attract investors, improve transparency, and access long-term funding that can drive business expansion.
2. Drivers Behind the IPO and SME Boom
Several macroeconomic and structural factors have contributed to the ongoing surge:
a. Economic Growth and Confidence
India’s steady GDP growth, expanding middle class, and digital transformation have fostered an environment where both investors and businesses feel optimistic about the future. Companies view the stock market as a vital source of capital, while investors see it as a means to participate in the nation’s growth story.
b. Regulatory Support
The Securities and Exchange Board of India (SEBI) has played a pivotal role by introducing reforms to streamline IPO processes, enhance disclosure norms, and strengthen investor protection. The SME platform, in particular, was designed to give smaller businesses a simplified path to listing without the burden of excessive compliance.
c. Retail Investor Participation
A massive influx of new retail investors, driven by fintech innovations and easy access to trading apps, has transformed the market landscape. The democratization of stock investing has increased demand for new IPOs, especially those offering early-stage growth potential.
d. Favorable Liquidity and Low Interest Rates
In recent years, global liquidity and relatively low domestic interest rates have made equities a preferred asset class. Investors, in search of better returns, have flocked to IPOs—especially those showing strong fundamentals and growth prospects.
e. Rise of Domestic Institutional Investors
Domestic mutual funds, insurance companies, and pension funds have become significant participants in IPOs, lending stability and depth to the market. Their involvement ensures that quality issues receive sustained institutional backing.
3. The SME Edge: Empowering Grassroots Entrepreneurship
The SME platform is not just a mini version of the mainboard—it is a catalyst for grassroots economic growth. For small and medium enterprises, traditional financing options like bank loans are often limited due to lack of collateral or credit history. IPOs provide an alternative route to raise equity without diluting too much control or taking on debt.
Moreover, SMEs listed on the exchange gain visibility, attract partnerships, and establish brand credibility. Sectors such as manufacturing, IT services, pharmaceuticals, textiles, and renewable energy have been particularly active in this space.
The success of SME IPOs also reflects a shift in investor mindset. Investors are no longer solely focused on large-cap blue chips—they are now looking for early-stage growth stories that can multiply wealth over time. This behavioral change is instrumental in sustaining the SME ecosystem.
4. Challenges That Could Test the Momentum
While the outlook appears promising, sustaining the current momentum will not be without challenges.
a. Market Overvaluation
A surge in IPOs often brings with it concerns about inflated valuations. Companies may take advantage of bullish sentiment to price their offerings aggressively, leaving little room for post-listing gains. If too many IPOs underperform after listing, investor confidence can quickly erode.
b. Quality and Governance Concerns
Not all SMEs meet high corporate governance standards. Weak accounting practices, lack of transparency, or promoter-driven decision-making can hurt long-term investor trust. Regulators and exchanges need to ensure strict eligibility norms and monitoring.
c. Investor Overexuberance
Retail investors sometimes chase IPOs purely for short-term listing gains rather than evaluating fundamentals. This speculative behavior can lead to volatility and mispricing, potentially distorting the true value of companies.
d. Global Economic Uncertainty
External shocks—like rising oil prices, interest rate hikes in developed markets, or geopolitical tensions—can impact foreign inflows and dampen market sentiment. The IPO market, being sentiment-driven, is highly sensitive to such macro events.
e. Liquidity Constraints in SME Segment
Despite high subscription levels, secondary market liquidity in SME stocks remains limited. Thin trading volumes can make price discovery difficult, deterring institutional investors from entering the space.
5. The Role of Policy and Regulation in Sustaining Growth
To maintain the momentum in the IPO and SME markets, regulatory foresight and market discipline are crucial.
a. Strengthening Disclosure Norms
SEBI and stock exchanges must continue refining disclosure requirements, ensuring that companies provide detailed, accurate, and timely information. This helps investors make informed decisions and reduces the risk of mispricing.
b. Enhancing Market Infrastructure
Encouraging more market makers, improving liquidity mechanisms, and enabling seamless migration from SME platforms to the mainboard can sustain investor confidence and ensure market depth.
c. Investor Education
Empowering retail investors through awareness programs about risk management, valuation analysis, and long-term investing can reduce speculative tendencies. Financial literacy is vital for a healthy IPO ecosystem.
d. Supporting SME Ecosystem Development
Beyond listing, SMEs require policy support in areas like taxation, innovation funding, and export facilitation. A holistic ecosystem that nurtures entrepreneurship will naturally feed into the SME IPO pipeline.
6. Technological and Digital Innovations: The New Growth Lever
Technology is transforming how IPOs are managed, subscribed, and analyzed. Online platforms and digital brokers now enable seamless IPO participation with UPI integration, faster refunds, and transparent allotment processes.
Moreover, data analytics and AI-driven investment tools are helping investors assess company fundamentals more efficiently.
In the SME segment, digital transformation is allowing small firms to manage compliance, financial reporting, and investor relations more effectively. Blockchain-based record-keeping and e-KYC systems are further reducing operational risks and increasing trust in market systems.
As India continues to digitalize, technology will remain a cornerstone of the IPO ecosystem—driving transparency, reducing costs, and expanding investor access.
7. The Road Ahead: Building Sustainable Growth
Sustaining the IPO and SME momentum requires balance. A mature market is not one that constantly breaks records in listing numbers—but one that ensures the right companies, backed by solid fundamentals, reach investors at the right valuations.
a. Quality over Quantity
Regulators, underwriters, and exchanges should prioritize quality listings over mere volume. Encouraging companies with strong governance, profitability, and long-term growth potential ensures the integrity of the market.
b. Encouraging Long-Term Investment
Tax incentives or special frameworks for long-term investors in SMEs could encourage patient capital. Such measures can stabilize prices and encourage genuine ownership rather than speculative flipping.
c. ESG and Sustainability Focus
As global investors increasingly emphasize Environmental, Social, and Governance (ESG) factors, Indian IPOs and SMEs must align with these trends. Companies that adopt sustainable practices are more likely to attract foreign institutional capital.
d. Regional and Sectoral Diversification
Encouraging listings from tier-2 and tier-3 cities, as well as from sunrise sectors such as green energy, electric mobility, and digital infrastructure, can diversify the IPO landscape. This not only broadens economic participation but also decentralizes wealth creation.
8. Global Lessons: Learning from Mature Markets
India can draw valuable insights from global markets like the U.S. NASDAQ or Japan’s JASDAQ, where smaller enterprises have long leveraged capital markets for growth. These platforms emphasize strict listing standards, investor transparency, and efficient migration to larger exchanges.
Adopting similar best practices can strengthen India’s SME framework, making it globally competitive. Moreover, cross-border listings or foreign investor participation in SMEs can provide additional depth and capital flow.
9. Investor Sentiment and the Cycle of Confidence
At the heart of every IPO wave lies investor sentiment. Confidence breeds participation, and participation fuels growth. As long as investors continue to see tangible value creation—through robust earnings, transparent management, and steady post-listing performance—the momentum will sustain.
However, maintaining this sentiment requires market discipline. Regulators must curb speculative excesses, companies must deliver on promises, and investors must remain rational and informed.
10. Conclusion: The Path to a Resilient IPO and SME Ecosystem
The future of India’s IPO and SME markets is undoubtedly bright, but sustaining their growth demands maturity and foresight. The foundation has been laid—a dynamic entrepreneurial ecosystem, supportive regulations, and a digitally empowered investor base. The next phase must focus on strengthening fundamentals, promoting transparency, and fostering long-term value creation.
If India continues to blend innovation with discipline, its capital markets could evolve into one of the most robust and inclusive ecosystems globally. The IPO and SME momentum, therefore, is not just a passing phase—it represents the evolution of India’s financial identity, empowering both enterprises and investors to participate in the country’s growth journey.
The challenge ahead lies not in maintaining speed, but in ensuring direction—toward a sustainable, transparent, and inclusive market that stands the test of time.
Impact of Macro Events on Financial MarketsIntroduction
Financial markets are highly sensitive ecosystems that respond to a wide range of macroeconomic events. These events — such as changes in inflation, interest rates, GDP growth, geopolitical tensions, trade policies, or natural disasters — influence the way investors perceive risk and return. In simple terms, macro events set the tone of the market. They shape investor confidence, capital flows, and ultimately determine the direction of asset prices across equities, bonds, currencies, and commodities.
Understanding how macro events move markets is essential for traders, investors, and policymakers. This knowledge allows them to anticipate volatility, manage risk, and make informed decisions in a constantly changing global environment.
1. What Are Macro Events?
Macro events are large-scale economic or geopolitical developments that affect the overall economy rather than individual companies or sectors. These can be economic, political, or environmental in nature. Examples include:
Central bank monetary policy decisions (like interest rate hikes or cuts)
Fiscal policies (government spending and taxation)
Inflation and unemployment data releases
Global trade agreements or disputes
Natural disasters or pandemics
Political instability or wars
Technological disruptions or regulatory reforms
Each of these events sends ripples through financial systems — influencing investor sentiment, liquidity, and valuation across global markets.
2. The Economic Indicators That Drive Market Sentiment
Economic indicators are the heartbeat of financial markets. Investors closely monitor data releases to gauge the health of the economy and anticipate future policy moves. Some key indicators include:
a. Gross Domestic Product (GDP)
GDP growth signals the strength of an economy.
Rising GDP usually means higher corporate profits and stock market optimism.
Falling GDP or recessionary signs can push investors toward safer assets like government bonds or gold.
b. Inflation
Inflation reflects the general rise in prices of goods and services.
High inflation erodes purchasing power and prompts central banks to raise interest rates.
Low inflation can indicate weak demand and slow growth.
Both extremes can unsettle investors, as they affect future earnings and the cost of borrowing.
c. Interest Rates
Interest rate changes are one of the most direct macroeconomic influences on markets.
Rising rates make borrowing costlier and reduce the appeal of riskier assets like equities.
Falling rates encourage investment and consumption, often boosting stock prices.
d. Employment Data
Strong employment reports signal a healthy economy, but they can also increase fears of inflation and potential rate hikes. Weak job data, on the other hand, can trigger fears of slowdown but also raise expectations for policy support.
e. Consumer Confidence
This measures how optimistic consumers are about their financial situation and the overall economy. High confidence supports spending and market growth, while low confidence can lead to declines in demand and market pessimism.
3. Central Banks and Monetary Policy
The role of central banks — such as the U.S. Federal Reserve, European Central Bank (ECB), or the Reserve Bank of India (RBI) — cannot be overstated. Through monetary policy tools, they control liquidity and influence interest rates, inflation, and currency value.
Tight Monetary Policy: When inflation rises, central banks often raise interest rates or reduce liquidity. This makes credit more expensive, curbing excessive speculation. Equity markets typically react negatively as borrowing costs rise and corporate profits shrink.
Loose Monetary Policy: When economic growth slows, central banks lower interest rates or engage in quantitative easing (injecting liquidity into the system). This usually boosts market sentiment, as investors chase higher returns in equities and other risk assets.
For instance, the U.S. Federal Reserve’s aggressive rate hikes in 2022 to combat inflation triggered global stock market corrections and strengthened the U.S. dollar — affecting emerging market currencies and global capital flows.
4. Fiscal Policy and Its Market Impact
While central banks handle monetary policy, governments influence markets through fiscal policy — by adjusting taxation and spending.
Expansionary Fiscal Policy: Increased government spending or tax cuts boost economic activity and corporate earnings, supporting stock markets. However, if excessive, it can cause inflation and fiscal deficits.
Contractionary Fiscal Policy: Higher taxes or reduced spending can slow growth but help control inflation or reduce debt.
For example, massive fiscal stimulus packages during the COVID-19 pandemic (2020–2021) helped economies recover quickly but later contributed to inflationary pressures that shook global markets in 2022.
5. Geopolitical Events and Market Reactions
Political instability, wars, or trade conflicts create uncertainty, one of the biggest enemies of market stability.
Wars and Conflicts: Geopolitical tensions can disrupt global supply chains, raise commodity prices (especially oil), and trigger risk aversion.
Trade Wars: The U.S.-China trade war (2018–2019) is a prime example — tariffs and export restrictions hurt corporate earnings, global trade, and investor confidence.
Elections: Markets often react strongly to election outcomes that could change fiscal or regulatory policies.
Investors usually flock to safe-haven assets such as gold, the U.S. dollar, or government bonds during such uncertain times.
6. The Role of Globalization and Cross-Market Connections
Today’s markets are deeply interconnected. A macro event in one country can quickly spread across borders through trade, investment, and capital flows.
For instance:
A slowdown in China’s manufacturing sector affects global commodity prices, impacting countries like Australia, Brazil, and India.
U.S. Federal Reserve policies influence currency and bond markets worldwide, especially in emerging economies dependent on foreign capital.
This interconnection means that investors must think globally — not just about domestic events — to understand market dynamics.
7. Natural Disasters and Pandemics
Events such as earthquakes, floods, or pandemics can have both short-term shocks and long-term consequences on financial markets.
The COVID-19 pandemic caused one of the fastest global market crashes in March 2020 as lockdowns halted economic activity. However, extraordinary monetary and fiscal support led to one of the strongest bull runs soon after.
Similarly, natural disasters can disrupt industries (like agriculture or energy) and affect insurance, logistics, and infrastructure-related stocks.
These events highlight how market resilience and adaptability are tested in the face of global crises.
8. Commodity Prices and Currency Movements
Commodities and currencies are heavily influenced by macroeconomic events:
Oil Prices: Rising oil prices due to geopolitical tensions or supply shortages increase production costs and inflation, hurting equity markets but benefiting energy stocks.
Gold: Acts as a safe haven during economic or political uncertainty.
Currency Fluctuations: A strong domestic currency can hurt exporters but benefit importers. Conversely, a weak currency boosts exports but raises inflation.
For example, the sharp fall in the Indian rupee during periods of rising U.S. interest rates often leads to foreign outflows from Indian equities as investors seek safety in the dollar.
9. Investor Psychology and Behavioral Shifts
Beyond economic logic, human behavior magnifies the effects of macro events.
Markets are driven by fear and greed. When macro events introduce uncertainty, panic selling or herd behavior can exaggerate price swings.
Overreaction: Investors might sell off stocks excessively during economic shocks.
Euphoria: During periods of economic optimism, investors might ignore risks and inflate asset bubbles.
Understanding behavioral finance helps explain why markets sometimes react irrationally to macro news — moving far more than economic fundamentals justify.
10. Technological and Structural Changes
Technological disruptions and financial innovations also qualify as macro events when they reshape entire industries or economic systems.
Fintech and digital currencies have changed how money flows globally.
AI-driven automation affects employment and productivity patterns.
Energy transitions toward renewables influence oil markets and corporate investments.
Each structural shift creates new winners and losers in financial markets, altering the global investment landscape.
11. Case Studies: Macro Events and Market Impact
a. The 2008 Global Financial Crisis
Triggered by the U.S. housing bubble and subprime mortgage defaults, it caused massive global market crashes. Investors fled risky assets, and central banks worldwide adopted unprecedented stimulus policies. This event reshaped global financial regulation and risk management practices.
b. COVID-19 Pandemic (2020)
Markets plunged amid lockdowns, but aggressive fiscal and monetary stimulus soon led to a historic recovery. It demonstrated how quickly policy responses can stabilize markets during crises.
c. Russia-Ukraine War (2022)
The conflict disrupted global energy and grain supplies, spiking inflation worldwide. This led to tighter monetary policies globally and a volatile year for equities and bonds.
Each of these examples shows that macro events can both destroy and create market opportunities, depending on investor perception and timing.
12. How Traders and Investors Adapt
To navigate macro-driven markets, professionals use several strategies:
Diversification: Spreading investments across asset classes and geographies reduces exposure to single-event shocks.
Hedging: Using derivatives (like futures or options) to protect portfolios against adverse moves.
Top-down Analysis: Starting from macroeconomic trends to identify sectors and stocks likely to perform well.
Safe-haven Allocation: Holding assets like gold, U.S. Treasuries, or defensive stocks during uncertain times.
Understanding macro trends helps investors stay proactive rather than reactive.
13. The Role of Communication and Expectations
Sometimes, markets move not because of actual events, but because of expectations.
For example:
A central bank hinting at future rate hikes can move bond yields and stock prices even before the actual policy change.
Similarly, forward guidance from policymakers shapes how investors position themselves.
This psychological and anticipatory nature of markets means that information — not just action — can be a macro driver.
Conclusion
Macro events are the invisible hands guiding the pulse of global financial markets. Whether it’s a shift in central bank policy, a geopolitical crisis, or a breakthrough in technology, these forces determine how capital flows, how risk is priced, and how investors behave.
The ability to interpret macro signals and their potential ripple effects is what separates informed investors from the rest. In a world where markets are more interconnected than ever, no event occurs in isolation. Each policy decision, conflict, or data release sends waves across borders, influencing billions of dollars in market value within seconds.
Ultimately, understanding macro events is not just about predicting price movements — it’s about grasping how the global financial system breathes, reacts, and evolves in response to the constant rhythm of change.

PCR Trading Strategies How Option Trading Works
Let’s take an example. Suppose you believe Infosys stock will go up from ₹1,500 to ₹1,600 soon. You buy a call option with a strike price of ₹1,500 for a premium of ₹20.
If the stock rises to ₹1,600, your option’s value also rises. You can sell it for a profit.
If the stock stays below ₹1,500, the option expires worthless, and you lose only the ₹20 premium.
Risks and Rewards
Option trading can be highly rewarding but also risky. The risk for buyers is limited to the premium paid, but sellers (writers) of options can face unlimited losses if the market moves against them. Hence, it’s important to understand how options work before investing.

Part 2 Master Candle Stick PatternWhy Trade Options?
Options can be used for different purposes:
Speculation – Traders predict whether prices will rise or fall and buy options to profit from that movement.
Hedging – Investors use options to protect their portfolios from potential losses, like insurance for their investments.
Income Generation – Some investors sell options to earn premiums regularly.

Part 1 Master Candle Stick PatternOption trading is a popular part of the financial market that allows investors to buy or sell the right—but not the obligation—to trade a stock or asset at a specific price within a certain time period. It’s a flexible and powerful tool used by traders to make profits, hedge risks, or plan future investments.
What is an Option?
An option is a contract between two parties — the buyer and the seller. It gives the buyer the right to buy or sell an asset (like a stock) at a fixed price, known as the strike price, before a set date called the expiry date. There are two main types of options:
Call Option – Gives the holder the right to buy an asset at the strike price.
Put Option – Gives the holder the right to sell an asset at the strike price.

Part 11 Tradig Master ClassKey Terminologies
Strike Price: The fixed price at which the asset can be bought or sold.
Premium: The cost paid by the buyer to the seller (writer) of the option for the rights granted by the contract.
Expiration Date: The date on which the option contract expires.
In-the-Money (ITM): When exercising the option would result in a profit.
Out-of-the-Money (OTM): When exercising the option would result in a loss.

Part 10 Trade Like Institutions Types of Options
There are two main types of options: Call Options and Put Options.
A Call Option gives the holder the right to buy an asset at a predetermined price, known as the strike price, within a specific time frame. Investors buy calls when they expect the asset’s price to rise.
A Put Option gives the holder the right to sell an asset at the strike price before expiration. Traders buy puts when they anticipate a price decline.

Part 9 Tradig Master ClassOption Trading Explained
Option trading is a form of derivative trading where the value of a contract is based on an underlying asset, such as stocks, indices, commodities, or currencies. Options give traders the right, but not the obligation, to buy or sell an asset at a specific price before or on a certain date. This flexibility makes options powerful tools for both hedging risk and speculating on price movements.
How Option Trading Works
Option trading involves two parties — the buyer (holder) and the seller (writer). The buyer pays a premium for the right to execute the trade, while the seller receives the premium in exchange for the obligation to fulfill the contract if exercised.

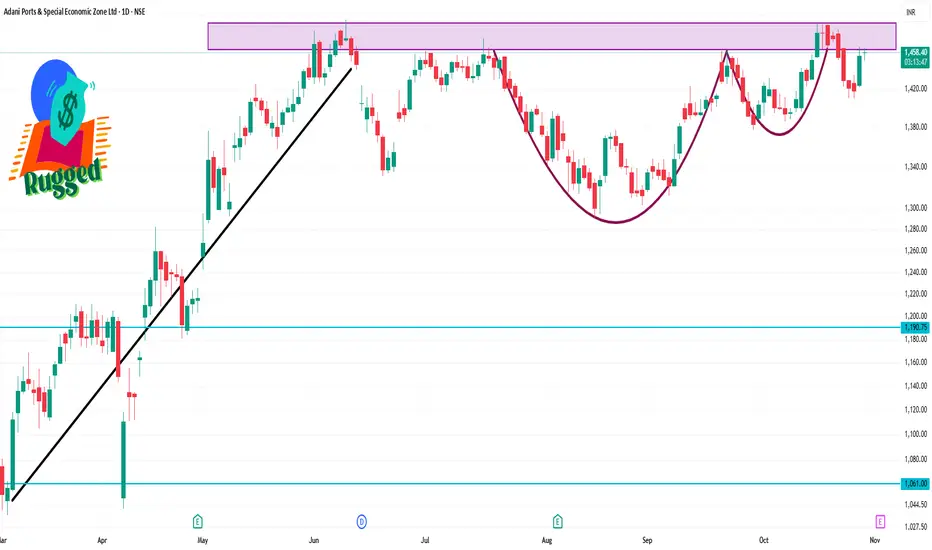
ADANIPORTS 1 Day Time Frame 🧮 Current Reference
Latest price: ₹1,429.00 approx.
Day’s range (recently): ~ ₹1,422.30 – ₹1,463.50
52-week range: ~ ₹995.65 (low) – ₹1,494.00 (high)
📊 Key Daily Support & Resistance Zones
Based on recent technical commentary, here are approximate levels to watch:
Support levels:
Around ₹1,407 – ₹1,396 (short-term support zone)
Deeper support near ₹1,382 as a more conservative anchor.
Resistance levels:
Around ₹1,432 – ₹1,446 as immediate resistance, and ₹1,457 next.
If a breakout happens, watch around the recent high near ₹1,490-₹1,500 zone (from 52-week high) for major structural resistance.