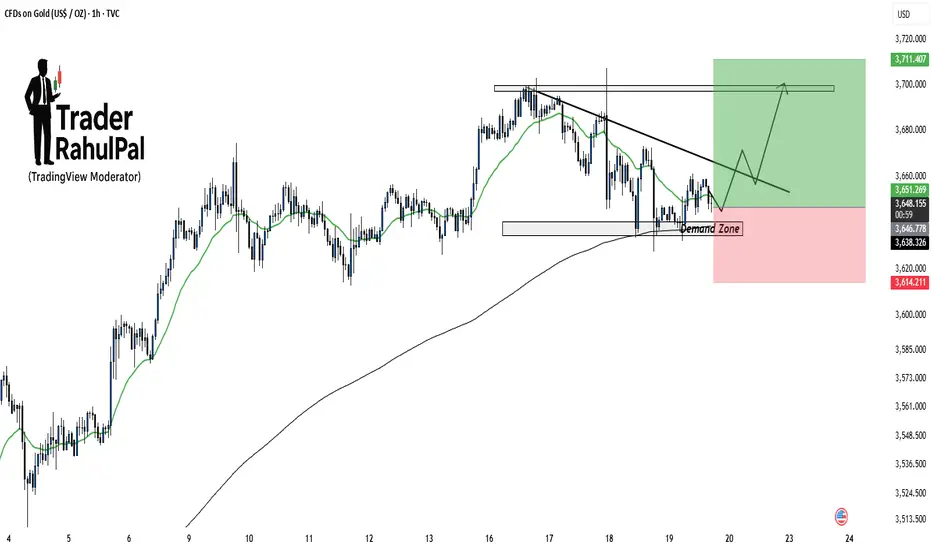
Gold Demand Zone Holding – Upside Potential Toward 3710!Gold is currently testing a demand zone around 3640–3650 , which aligns well with moving average support. As long as this zone holds, price action favors a potential bounce toward the falling trendline and eventually the key resistance area near 3710 . Short-term buyers may look for confirmation inside the demand zone before positioning, while a breakdown below 3614 would invalidate this setup.
Disclaimer: This analysis is for educational purposes only and should not be taken as financial advice. Please do your own research or consult your financial advisor before investing.
Traderrahulpal
What is Pre-Open Market & Why It Decides Opening Price?Hello Traders!
Every morning before the actual market opens, there’s a small window called the pre-open market .
Many traders ignore it, but this session actually decides the official opening price of stocks and indices like Nifty and BankNifty.
Let’s break it down in simple words.
1. What is Pre-Open Market?
The pre-open market runs from 9:00 AM to 9:15 AM on NSE and BSE.
From 9:00 to 9:07: You can place, modify, or cancel orders.
From 9:08 to 9:12: The system matches buy and sell orders to determine the equilibrium price.
From 9:12 to 9:15: Buffer period for smooth transition before normal trading.
So the actual market starts at 9:15 AM, but prices are already decided during pre-open.
2. Why is Pre-Open Market Important?
Price Discovery: It balances demand and supply to find the most fair opening price.
Handles Overnight News: Any news like global market moves, company announcements, or results gets adjusted here before regular trading begins.
Reduces Volatility: Instead of opening with wild gaps, pre-open absorbs much of the shock by adjusting orders.
Sets the Tone: Traders watch pre-open levels to guess the likely direction of Nifty, BankNifty, and major stocks.
3. How Traders Can Use Pre-Open Data
Check which stocks have unusual activity in pre-open. It may signal big news or institutional interest.
Watch Nifty and BankNifty equilibrium prices to prepare your intraday levels.
Don’t rush to place orders blindly in pre-open, volumes are thin, and price can be misleading at times.
Rahul’s Tip:
Pre-open market is like a “warm-up” before the real game starts. Use it for signals, but always confirm with regular session price action.
Conclusion:
The pre-open market may look small, but it plays a big role in deciding how the day begins.
By understanding how it works, you can avoid surprises and be better prepared for the opening bell.
This educational idea By @TraderRahulPal (TradingView Moderator) | More analysis & educational content on my profile
👉 If this post made pre-open clearer for you, like it, share your thoughts in comments, and follow for more simple market education!

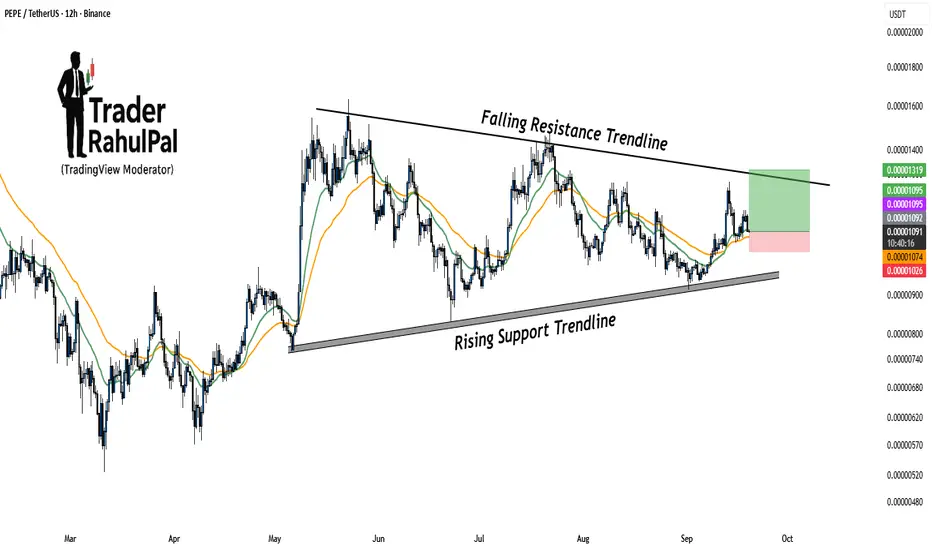
PEPE Getting Ready for a Big Move – Breakout Loading!PEPE is trading within a well-structured range, bounded by a rising support trendline and a falling resistance trendline . This setup indicates that the price is getting squeezed, and a decisive breakout move may be coming soon.
Currently, the price is holding above key moving averages, which adds strength to the bullish bias. As long as the rising support trendline remains intact, buyers will continue to defend dips. A breakout above the falling resistance could trigger a sharp move higher, targeting the next resistance levels near 0.00001319 .
On the downside, if price fails to hold above the rising support, we may see a deeper pullback toward 0.00001074–0.00001026 levels. Traders should closely watch how PEPE reacts near the falling resistance line in the coming sessions.
Disclaimer: This analysis is for educational purposes only and should not be taken as financial advice. Please do your own research or consult your financial advisor before investing.
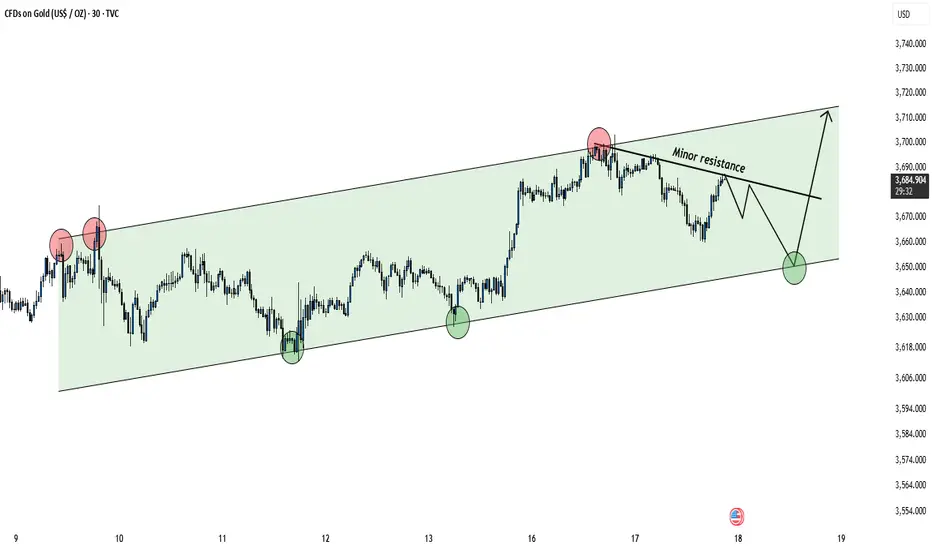
Gold Trading Inside Channel – Key Support & Resistance Levels!Hello Traders!
Gold is currently moving inside a well-defined ascending channel on the 30-min chart. Both buyers and sellers are respecting the levels of this channel, giving us clear trading opportunities.
Key Observations
Price has tested the upper channel resistance multiple times, facing rejection near $3,710–$3,720.
The lower channel support around $3,650 has been well respected, creating strong buying reactions.
A minor resistance trendline is now forming, which could temporarily limit upside momentum.
Short-term path suggests: rejection from minor resistance → retest of channel bottom → potential bounce back toward the upper channel.
Trading Plan
Bullish bias remains intact as long as Gold holds above $3,650 channel support.
A bounce from support may target $3,710–$3,720 zone again.
If support breaks, deeper correction may follow.
Rahul’s Tip
Always wait for confirmation near channel edges. Trading inside the channel can be tricky, but respecting support and resistance gives you high-probability setups.
Disclaimer: This analysis is for educational purposes only and should not be taken as financial advice. Please do your own research or consult your financial advisor before investing.
Analysis By @TraderRahulPal (TradingView Moderator) | More analysis & educational content on my profile
👉 If you found this helpful, don’t forget to like and follow for regular updates.
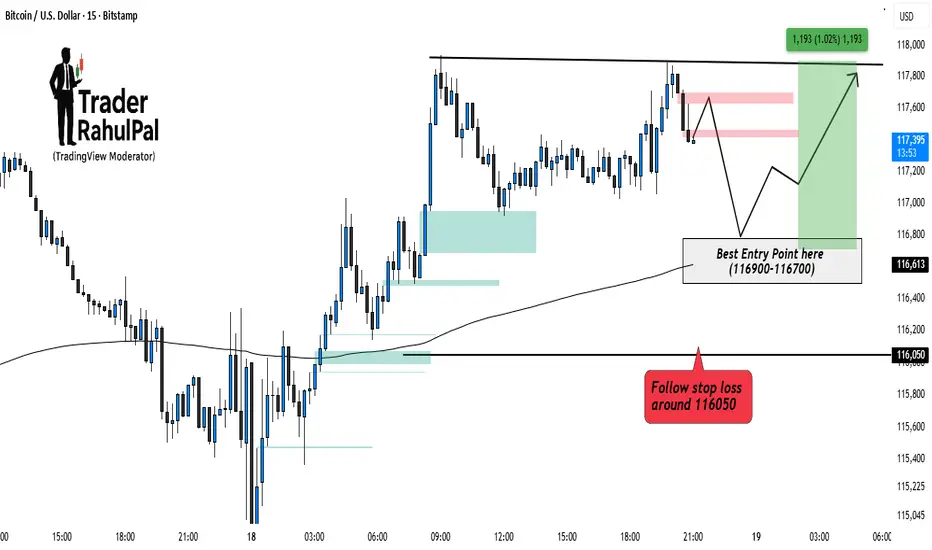
Bitcoin Bullish side Entry Setup Intraday – Key Levels to Watch!Bitcoin is consolidating near its upper resistance zone after a recent bounce. Price action suggests that a pullback into the 116900–116700 range can offer a high-probability entry for buyers. Maintaining a stop loss around 116050 helps to protect against deeper downside risk. As long as this zone holds, the bias remains bullish, with potential upside toward 117800–118000 . Intraday traders should closely watch how price reacts around the entry zone before positioning.
Disclaimer: This analysis is for educational purposes only and should not be taken as financial advice. Please do your own research or consult your financial advisor before investing.
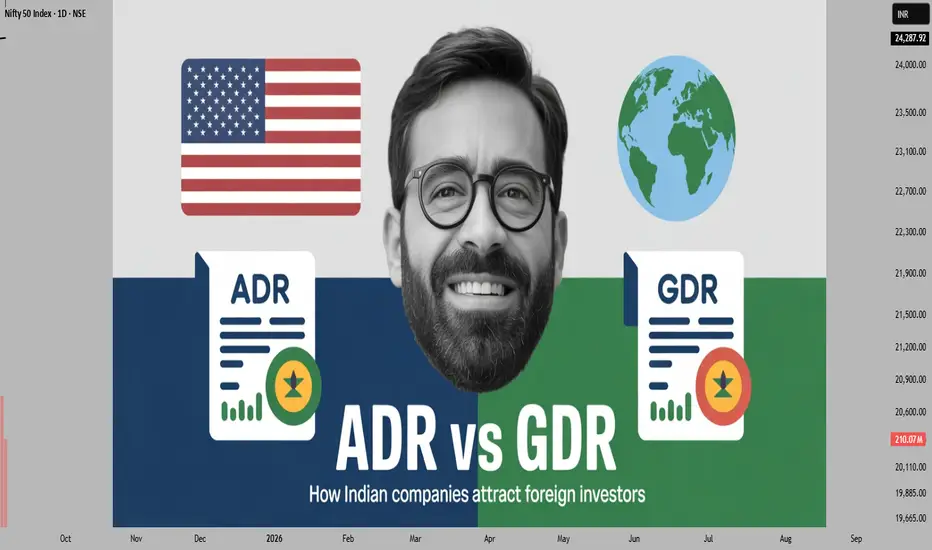
What is ADR/GDR – How Indian Companies Get Foreign Investors!Hello Traders!
You may have heard terms like ADR and GDR when companies talk about raising money abroad. These instruments allow Indian companies to get international investors without directly listing on foreign stock exchanges. Let’s understand them in simple words.
What is an ADR?
ADR stands for American Depository Receipt .
It is a certificate issued by a US bank that represents shares of a foreign company (like an Indian company). These ADRs trade on US stock exchanges just like normal US stocks.
Example: Infosys and Wipro have ADRs listed in the US.
Advantage: US investors can buy Indian companies without dealing with Indian exchanges.
What is a GDR?
GDR stands for Global Depository Receipt .
It works the same way as ADR, but instead of being limited to the US, GDRs are listed on global exchanges like London or Luxembourg.
Example: Many Indian companies raise funds through GDRs in Europe.
Advantage: Gives access to a larger pool of foreign investors.
Why Do Companies Issue ADR/GDR?
Access to Foreign Capital: Helps Indian companies raise funds from global investors.
Better Visibility: Being listed abroad increases global recognition of the company.
Diversified Investor Base: Attracts institutional investors who may not invest directly in Indian markets.
Liquidity: Allows more trading activity and easier buying/selling internationally.
Rahul’s Tip:
ADR/GDR listings are a sign that a company wants to expand globally and attract foreign capital. But as an investor, always check if the company is fundamentally strong before getting influenced by the “global listing” tag.
Conclusion:
ADR and GDR are simple tools that connect Indian companies with foreign investors.
While ADRs are limited to the US, GDRs open doors to global markets.
For long-term investors, these instruments show how Indian companies are scaling globally.
If this post made ADR/GDR clear for you, like it, share your thoughts in comments, and follow for more market education in simple language!
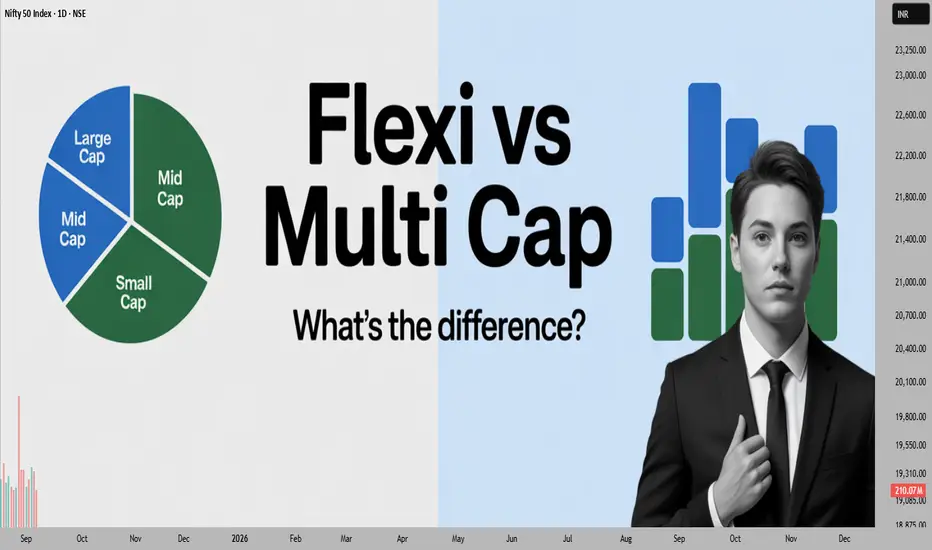
Flexi Cap Funds vs Multi Cap Funds – What’s the Difference?Hello Traders!
When it comes to equity mutual funds, many investors get confused between Flexi Cap and Multi Cap funds. Both invest across large, mid, and small-cap stocks, but there’s a key difference in how they are managed. Let’s break it down in simple words.
What are Multi Cap Funds?
Multi Cap Funds are required by SEBI rules to invest a minimum of 25% each in large-cap, mid-cap, and small-cap stocks.
This means:
They are compulsory diversified .
Even if small caps are risky at the moment, the fund manager must still hold at least 25% exposure.
Good for investors who want fixed diversification across all categories.
What are Flexi Cap Funds?
Flexi Cap Funds, as the name suggests, have full flexibility. The fund manager can invest in large, mid, or small-cap in any proportion, depending on market conditions.
This means:
No fixed rule for allocation.
The fund manager can go 70% large-cap in volatile times or shift more to small/mid-caps when opportunities are strong.
Good for investors who trust the fund manager’s judgment.
Key Differences You Should Know
Flexibility: Multi Cap = fixed allocation, Flexi Cap = flexible allocation.
Risk Level: Multi Cap has balanced risk due to compulsory exposure. Flexi Cap risk depends on manager’s calls.
Return Potential: Flexi Cap may deliver better returns in the hands of a skilled manager, but also comes with higher dependency on their decisions.
Investor Type: Multi Cap suits investors wanting rule-based diversification. Flexi Cap suits investors comfortable with dynamic allocation.
Rahul’s Tip:
If you want steady exposure across all market caps, Multi Cap funds are safer. But if you believe in the fund manager’s ability and want more flexibility, Flexi Cap funds can give you better opportunities.
Conclusion:
Both categories have their place in a portfolio. The choice depends on your risk appetite and trust in active fund management.
Remember, what matters most is not just category, but consistent performance and fund manager track record.
If this post cleared your confusion, like it, share your view in the comments, and follow for more simple investing insights!
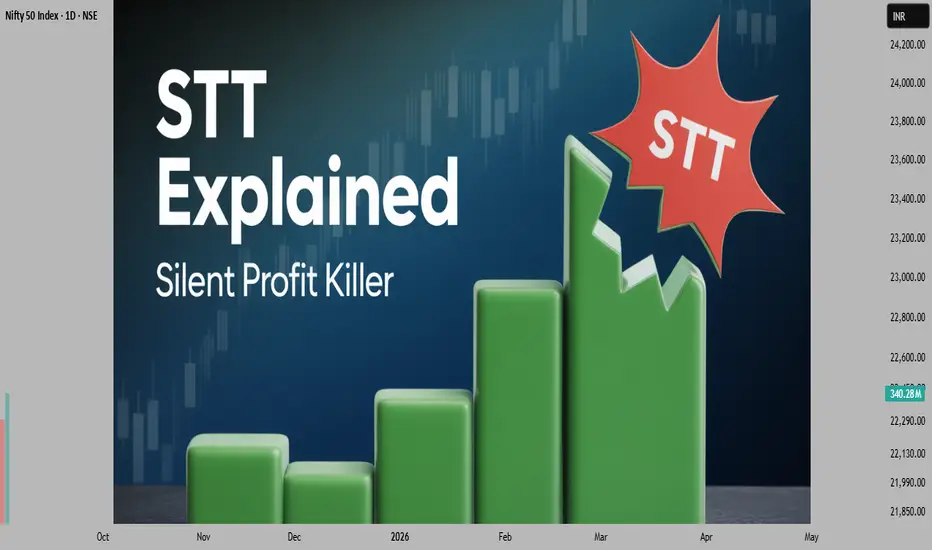
STT Explained – The Silent Tax That Eats Into Your Profits!Hello Traders!
Many traders calculate their profit after entry and exit, but forget a hidden cost that reduces it every single time: STT (Securities Transaction Tax) .
It doesn’t look big on paper, but over time it silently eats into your profits. Let’s break it down in simple terms.
What is STT?
STT is a tax charged on the value of every buy/sell transaction in equities, derivatives, and ETFs.
It was introduced to generate revenue for the government and applies to all market participants.
Example: If you buy shares worth ₹1,00,000, you pay a small percentage as STT. The same applies when you sell. In options and futures, it’s mostly charged on the sell side.
Where Does STT Apply?
Equity Delivery: STT applies on both buy and sell transactions.
Equity Intraday: STT is charged only on the selling side.
Futures: STT applies only on the sell side of the contract.
Options: STT applies on the sell side, but at a higher rate compared to futures.
Why Traders Must Care About STT
It Reduces Net Profit: Even if your trade looks profitable on the chart, STT takes away a portion. In short-term trading, these small cuts add up.
Impacts Scalpers & Option Sellers Most: Since they do high-frequency trading, STT can eat into a large chunk of their returns.
Hidden in Brokerage Statements: Many traders blame “brokerage” for high costs, but in reality, STT is often the bigger factor.
Rahul’s Tip:
Always calculate the real cost of trading , not just entry and exit points. Brokerage, STT, GST, exchange fees, all matter.
Sometimes the best trade is not the most frequent one, but the one with the best cost-to-profit balance.
Conclusion:
STT may look small, but it has a big impact over time.
The difference between a losing trader and a winning trader is often not the strategy, but how well they manage costs like STT.
If this post cleared your doubts on STT, like it, drop your experience in comments, and follow for more trading education that really matters!
Gold Daily Chart – Ascending Triangle Breakout!Gold has formed a strong ascending triangle pattern on the daily timeframe. The price has successfully broken above the resistance zone, confirming bullish momentum. Such patterns generally indicate continuation of the uptrend, especially when supported by volume and strong price action.
Chart Observation:
As long as price holds above 3,450, the bullish setup remains valid.
A retest of the breakout zone can provide the best risk-to-reward entry opportunity.
Traders should keep an eye on volume confirmation while entering trades.
Note: If levels sustain and setup remains intact, I will share live trade updates in real time. Stay tuned.
Disclaimer: This analysis is for educational purposes only. Please do your own research or consult your financial advisor before taking trades.
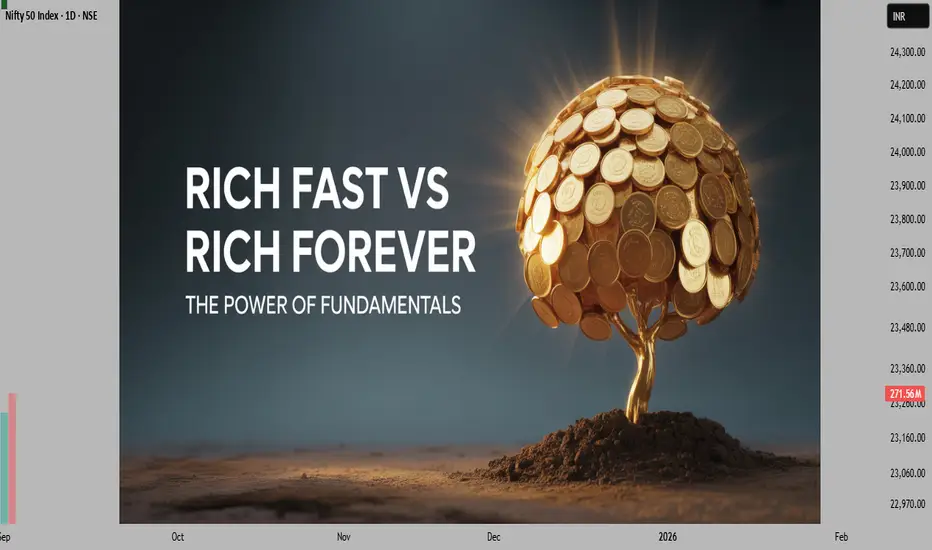
Fundamentals Don’t Make You Rich Fast They Make You Rich ForeverHello Traders!
Most new investors want quick returns. They search for shortcuts, tips, and hot stocks to double their money overnight. But the reality is, wealth built on shortcuts usually disappears just as fast.
Fundamentals may feel boring because they don’t promise overnight success. But in the long run, they are the only reason you can create wealth that lasts. Let’s break this down.
1. Fundamentals Build Strong Foundations
A stock backed by consistent earnings, low debt, and strong management may not give you 50% returns in a week.
But over 5–10 years, such companies quietly multiply your money with stability.
2. Quick Gains Fade, Fundamental Gains Stay
A stock bought on hype can double quickly, but the same hype can collapse just as fast.
On the other hand, companies with strong fundamentals recover even after market crashes, because the business itself is valuable.
3. Time Works With Fundamentals
The longer you stay invested in a fundamentally strong company, the more compounding works in your favor.
Markets reward patience, fundamentals give you the confidence to hold.
Rahul’s Tip:
Don’t confuse speed with success.
The goal is not to get rich fast, but to stay rich forever. Fundamentals may be slow, but they are steady, and steady wins in wealth creation.
Conclusion:
Fast money comes and goes, but fundamental investing creates permanent wealth.
If you want to stop chasing quick profits and build a portfolio that lasts, start focusing on the strength of the business, not the speed of price moves.
If this post gave you clarity, like it, share your thoughts in the comments, and follow for more simple and practical investing wisdom!
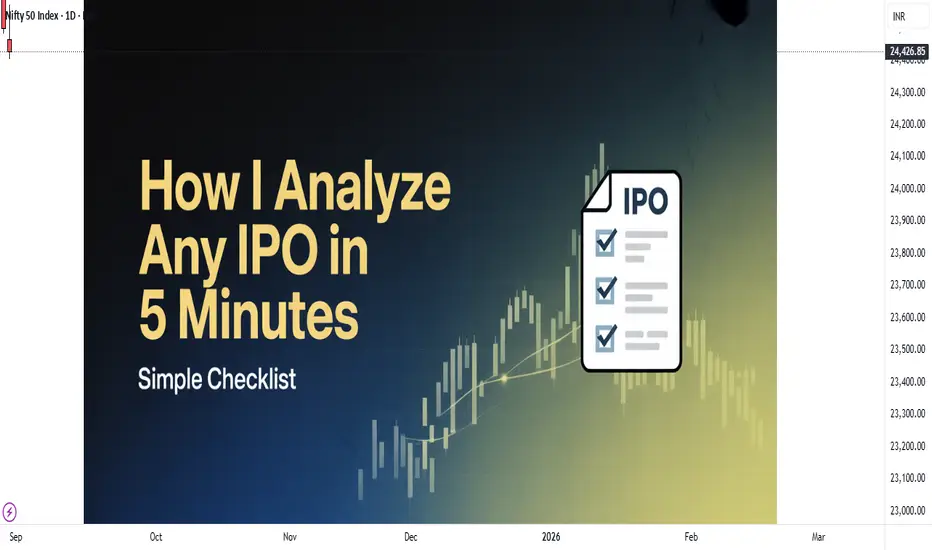
How I Analyze Any IPO in 5 Minutes (Simple Checklist)Hello Traders!
IPOs always create excitement. Retail investors often rush in because of hype, but smart traders know how to quickly separate strong opportunities from risky bets.
You don’t need hours of research, a simple checklist can give you clarity in just 5 minutes.
Here’s the process I follow before looking at any IPO.
1. Understand the Business Model
Before anything else, ask: What does the company actually do? Is it solving a real problem, or just another crowded business?
If you cannot explain the business in one simple line, it’s better to avoid.
2. Revenue and Profit Trend
Check the last 3 years’ financials. Are sales and profits consistently growing, or is the IPO just timed after one good year?
A company with unstable profits may not sustain growth once the IPO buzz fades.
3. Promoter and Management Quality
Look at promoter background, experience, and any red flags. Are they increasing their stake or selling heavily in the IPO?
If promoters themselves are exiting big, you need to be cautious.
4. Debt Levels and Cash Flow
High debt or weak cash flow is a danger sign. IPO money should ideally be used for growth, not just to repay loans.
Companies with positive cash flow and low debt are much safer bets.
5. Valuation vs Peers
Even a good company can be a bad investment if the price is too high. Compare P/E and other valuation ratios with similar listed companies in the sector.
If it looks overpriced, it may be better to wait and buy later.
Rahul’s Tip:
Don’t get trapped in IPO hype. Most strong companies will give you chances to buy even after listing. Focus on fundamentals, not emotions.
Conclusion:
Analyzing an IPO doesn’t need to be complicated.
With this 5-minute checklist, business model, growth, promoters, debt, and valuation — you’ll quickly know if the IPO is worth your time or better avoided.
If this helped you, like the post, share your IPO checklist in the comments, and follow for more simple investing insights!
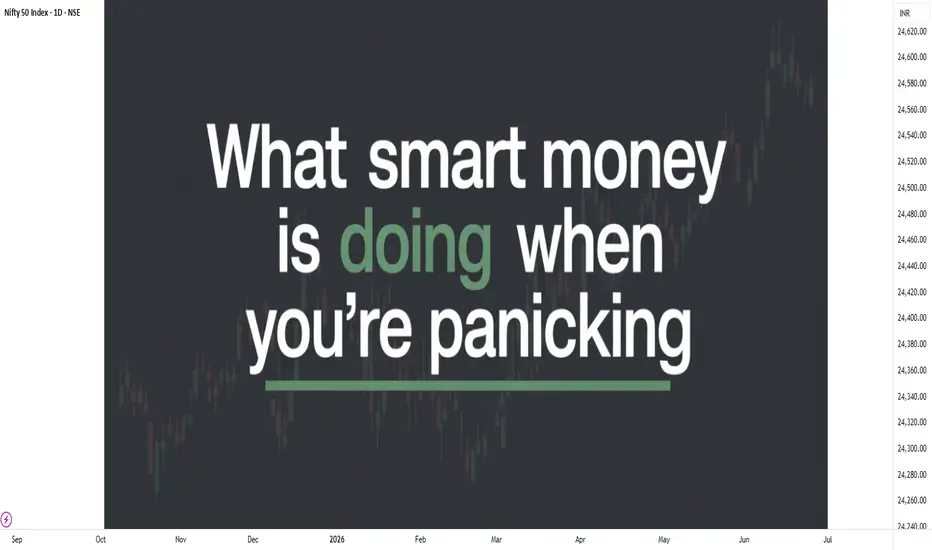
What Smart Money is Doing When You’re Panicking?Hello Traders!
If you’ve been in the market long enough, you’ve seen this happen: the market suddenly drops, red candles everywhere, and social media explodes with fear. Retail investors start selling in panic, desperate to protect whatever is left.
But here’s the truth, when retail is panicking, smart money is calmly preparing to profit . Let’s understand exactly how.
1. Smart Money Buys When Retail Sells
Retail investors often believe that falling prices mean danger. For smart money, falling prices mean discounts . When everyone rushes to exit, prices get pushed far below their true value. That’s the exact moment institutions step in quietly to accumulate quality stocks.
Example: During COVID-19 crash, while retail was rushing to sell at 8,000 Nifty levels, institutions were loading up. Two years later, Nifty doubled. Retail sold in fear, smart money doubled their wealth.
The lesson? When you sell in panic, someone else is buying, and that “someone” is usually smarter than you.
2. They Focus on Value, Not Headlines
Retail reacts to news, WhatsApp forwards, and TV anchors shouting “Market crash!” Smart money reacts to fundamentals . They don’t care if Nifty fell 300 points today, they’re looking at earnings, cash flow, debt levels, and long-term trends.
For them, a temporary correction doesn’t change the long-term story of a strong company. They wait for such moments because panic-driven prices give them a margin of safety.
So while retail sells HDFC Bank in fear of a 5% fall, smart money sees it as an opportunity to accumulate a fundamentally strong business.
3. They Manage Risk, Not Emotions
The biggest difference between smart and retail money is not knowledge, it’s discipline. Retail enters big positions without planning, and when price falls, emotions take over. That’s why they panic-sell.
Smart money, on the other hand, sizes their positions correctly, uses hedges, and accepts that volatility is normal. They don’t panic when markets fall because they already prepared for it. For them, volatility is a feature, not a bug.
Rahul’s Tip:
Whenever you feel the urge to panic-sell, pause and ask yourself:
“Who is on the other side of my trade?”
If you are selling in fear, someone with deeper research and bigger pockets is buying with confidence. Don’t make it easy for them. Train yourself to think like the smart money, calm, patient, and disciplined.
Conclusion:
Markets will always move in cycles of fear and greed. Most retail investors buy when everything looks safe and sell when fear is highest. Smart money does the exact opposite, and that’s why they consistently outperform.
If you want to change your results, you need to change your behavior. Don’t let panic dictate your decisions. Think like the institutions: focus on fundamentals, manage risk, and stay calm when others lose control.
If this post helped you see the difference between smart and retail money, like it, drop your thoughts in the comments, and follow for more real-world trading psychology insights!
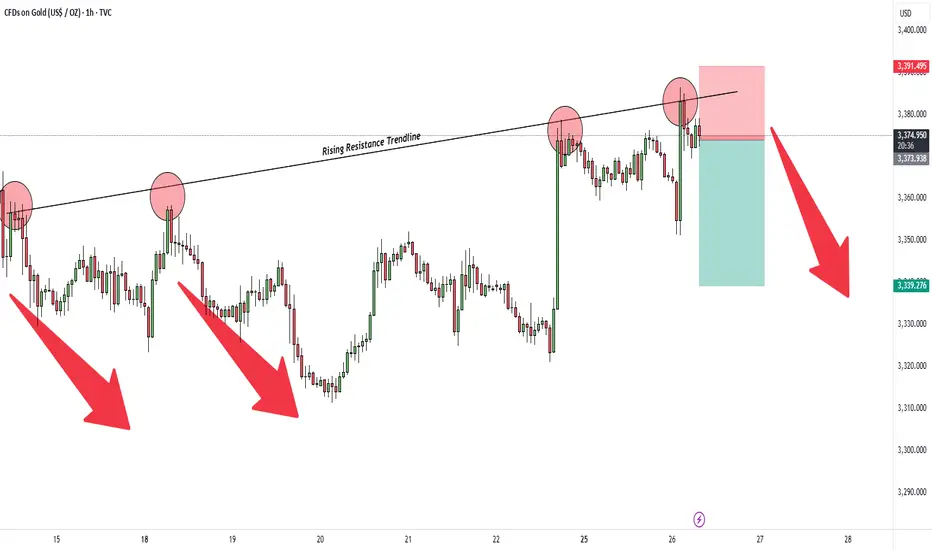
Gold – Rejection from Trendline ResistanceHello everyone, Gold faced rejection from the ascending trendline resistance and formed a bearish setup. A short position has been taken with stop above the recent swing high and target near 3339 support zone.
Key Points:
Trendline Resistance: Price failed to sustain above the trendline.
Risk Management: Stop placed above 3391 to protect against false breakouts.
Target Zone: First support lies near 3339 where price may react.
Disclaimer: This analysis is for educational purposes only, not financial advice.
August Iron Condor Setup on Nifty – Premium Eating Strategy!Hello Traders!
Just like we nailed the July Iron Condor, here comes the fresh setup for August expiry.
Nifty is trading around 24680 and we are seeing tight range movement with no clear trend for now. In such times, Iron Condor becomes a powerful income-generating strategy for option sellers, especially if the market stays within a defined range.
So here's the plan:
Strategy Type:
Bullish Iron Condor on Nifty (28th August 2025 expiry)
Position Details:
Sell 2x 24300 PE @ 130.05
Buy 2x 23800 PE @ 53.75
Sell 2x 25000 CE @ 172.50
Buy 2x 25500 CE @ 49.30
Strategy payoff graph:
Strategy Rationale:
We’ve created a wide range between 24101 to 25199 as our breakeven zone. As long as Nifty stays in this range by expiry, we collect full premium and enjoy time decay.
Why We Call It Bullish Iron Condor:
We’ve kept the Put side tighter and Call side slightly wider, meaning we have a bullish bias but still want to benefit from a range-bound expiry.
Rahul Tip:
Don’t go for iron condors blindly, always check for major events, news, or breakout signals. A sudden breakout or breakdown can flip your setup. Adjust or exit if market moves out of your defined zone.
Disclaimer:
This strategy is for educational purposes only. Please do your own risk management and position sizing. Avoid taking full quantity at once — better to scale in once the range confirms.
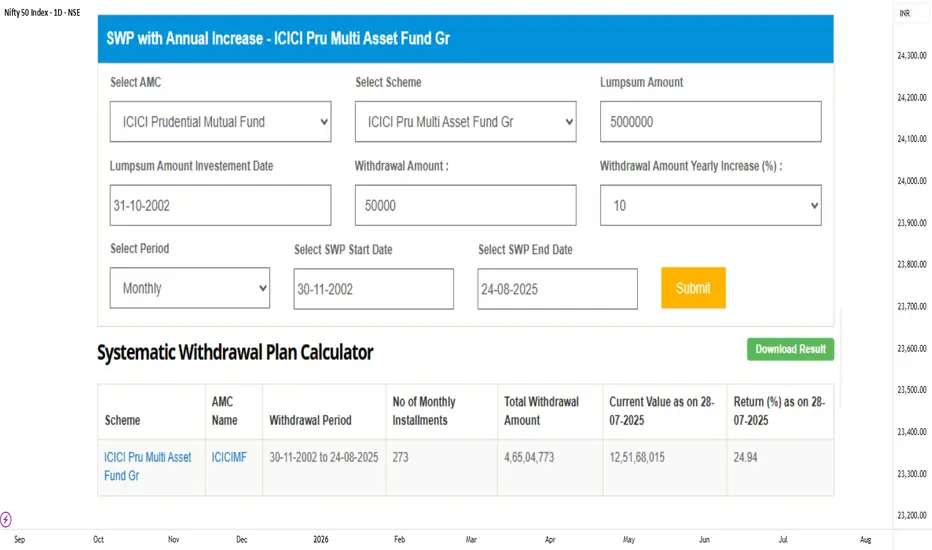
How to Create Your Own Pension with Mutual Funds (SWP Explained)Hello Everyone,
For most people, retirement planning starts with the question – “How will I get monthly income once I stop working?”
The answer is – Systematic Withdrawal Plan (SWP). With SWP, you can actually create your own pension and enjoy a stress-free retirement.
What is SWP?
A Systematic Withdrawal Plan allows you to invest a lump sum amount in a mutual fund and withdraw a fixed sum every month (or quarter/year). It’s just like receiving a pension or salary, while your remaining money continues to stay invested and grow.
Why SWP Works Like a Pension
Steady Cash Flow: You can set up regular monthly withdrawals, which creates a reliable income stream for your retirement needs.
Inflation Protection: Unlike traditional pensions or FDs where income is fixed, in SWP you can increase your withdrawal every year. This way, your monthly income grows in line with rising living costs.
Wealth Preservation: Even though you withdraw regularly, your remaining corpus is invested and keeps compounding. Over long periods, this can multiply your wealth.
Tax Efficiency: Compared to interest income from FDs, SWPs are more tax-friendly as withdrawals are treated as capital gains. This means potentially lower taxes and higher take-home income.
Flexibility: You can change the withdrawal amount, frequency, or even stop the SWP anytime depending on your needs. No traditional pension gives this much flexibility.
Why Multi-Asset Funds Work Best for SWP
SWP is most effective when your investment is diversified across equity, debt, and gold – which is exactly what multi-asset funds offer.
Equity portion helps your wealth grow faster.
Debt portion provides stability and regular income.
Gold acts as a hedge during uncertain times.
That’s why multi-asset funds are often considered the best option for long-term SWPs.
Real Example (Past Data)
Suppose an investor invested ₹50 lakh in 2002 in a multi-asset fund.
He started withdrawing ₹50,000 per month, increasing it by 10% every year.
By 2025, he had already withdrawn ₹4.65 crore (like a monthly pension).
Yet, his remaining corpus grew to around ₹12.5 crore.
Note: This is based on past returns. Future results may differ. Returns are never guaranteed in markets.
But just think of it this way – if 2002 was your starting point, and today was 2025, this is the power of SWP you would have experienced.
Rahul’s Tip
SIP helps you build wealth .
SWP helps you enjoy wealth .
If you want financial independence after retirement, don’t wait for government or company pensions. Create your own with SWPs in multi-asset funds.
If this helped, like/follow/comment.
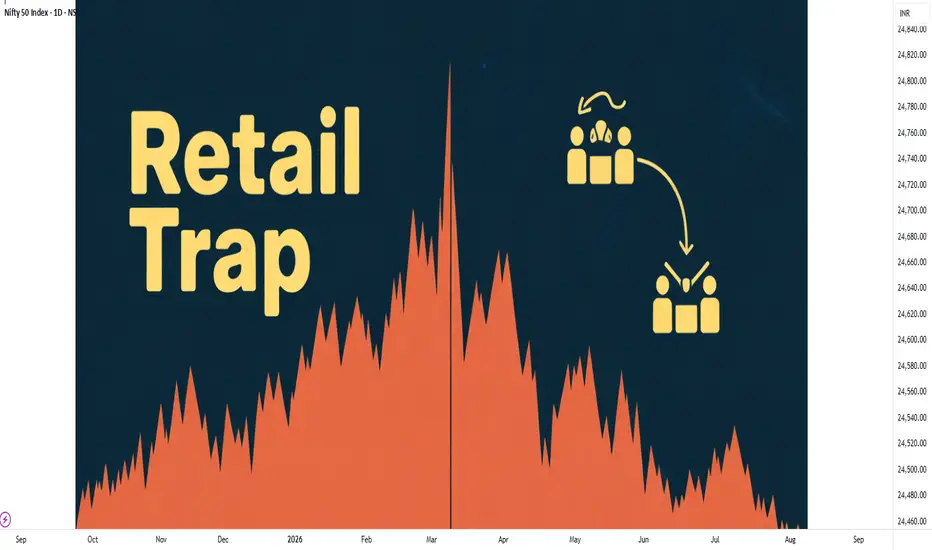
Why Most Retail Investors Buy at the Top and Sell at the Bottom!Hello Traders!
Most retail investors often struggle with timing the market. They end up buying when prices are high and panic-selling when markets fall. Let’s break down why this happens and how you can avoid it.
The Psychology Behind the Mistake
Fear of Missing Out (FOMO): When stocks rally, people feel they might miss the opportunity. This pushes them to buy at high levels.
Panic and Fear: During corrections or crashes, emotions take over. Instead of holding, many sell in fear of further losses.
Herd Mentality: Most investors follow the crowd. If everyone is buying, they buy. If everyone is selling, they sell too.
How to Avoid This Trap
Have a Clear Plan: Define your entry and exit strategy before investing. Don’t act on impulse.
Focus on Fundamentals: Long-term value creation comes from fundamentals, not short-term price moves.
Use SIP or Staggered Buying: Instead of putting all your money at once, invest gradually to avoid catching tops.
Control Emotions: Discipline and patience are your biggest strengths as an investor.
Rahul’s Tip:
Smart investing is not about predicting the exact top or bottom. It’s about consistency, discipline, and managing risk. If you can keep emotions out of your decision-making, you’ll already be ahead of most retail investors.
Conclusion
Buying at the top and selling at the bottom is not a market problem, it’s a mindset problem. Once you fix the psychology, your investment journey becomes much smoother.
If this helped, like/follow/comment.
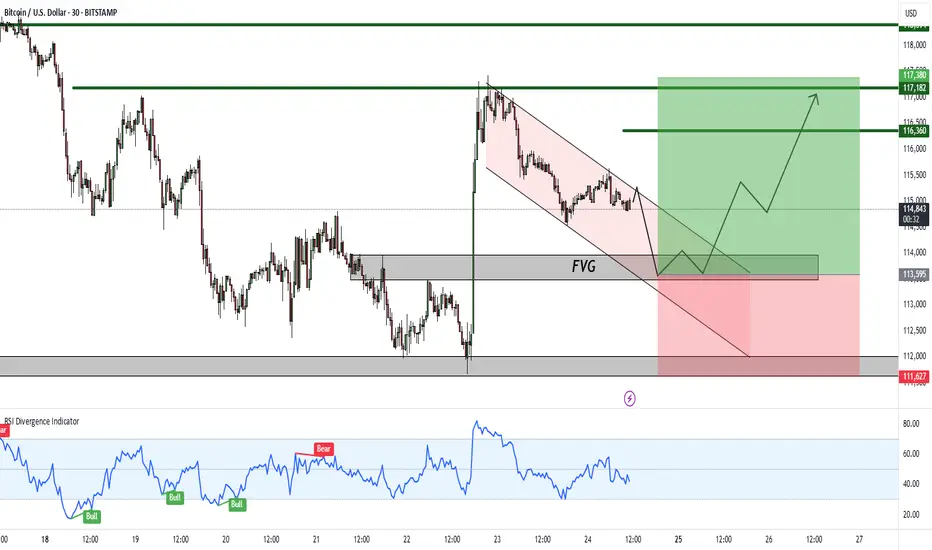
Bitcoin – Bullish Setup Forming After FVG Retest!Hello Traders!
Bitcoin is currently showing signs of forming a bullish setup after rejecting lower levels. The price has created a clean FVG (Fair Value Gap) zone and is moving within a falling channel, suggesting a possible accumulation before the next leg up.
Key Observations:
FVG Support: Price is likely to retest the FVG zone before a strong upward move.
Falling Channel: The structure indicates potential breakout to the upside.
RSI Divergence: Momentum indicators are showing signs of strength, supporting a bullish reversal case.
Targets: The upside targets are marked at 116,360 – 117,380 – 118,394 levels.
Invalidation: A breakdown below 111,627 would negate this bullish setup.
Rahul’s Tip:
Always wait for confirmation around the FVG zone. Entering too early may expose you to false breakouts. Risk management is crucial, especially in volatile assets like Bitcoin.
Disclaimer:
This analysis is for educational purposes only and not financial advice. Please do your own research before making any trading decisions.
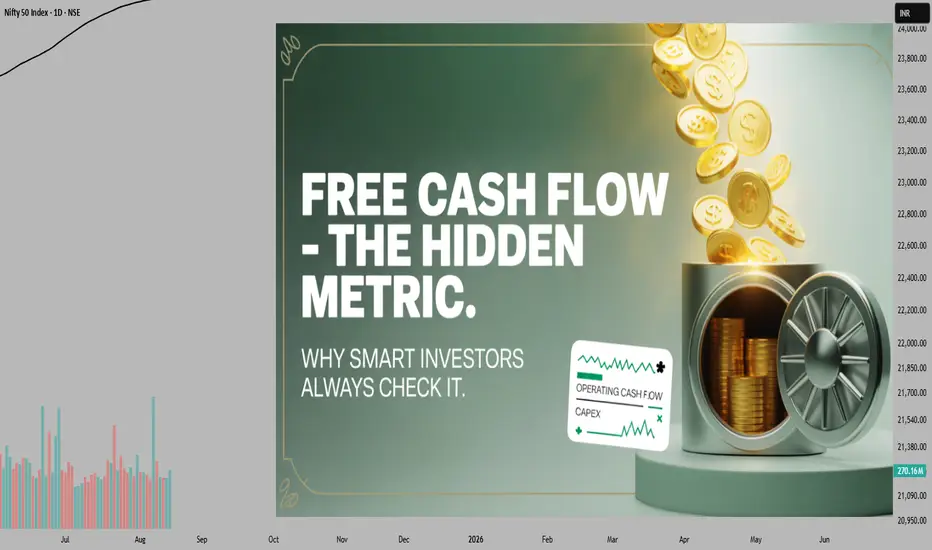
Free Cash Flow – The Most Ignored Metric That Can Save You!Hello Traders!
When most people look at a company’s financials, they stop at profits.
But smart investors know that profits on paper don’t always mean cash in hand.
That’s where Free Cash Flow (FCF) comes in, the metric that reveals the real financial strength of a business.
What is Free Cash Flow?
Free Cash Flow is the money a company has left after paying all operating expenses and making necessary investments in its business.
It’s the cash available to pay dividends, buy back shares, reduce debt, or reinvest for growth.
Why It Matters More Than Reported Profits
Cash is King:
A company might report high profits but still struggle if it doesn’t have actual cash flow.
FCF shows if the business can fund itself without borrowing.
Signals Financial Health:
Consistently positive FCF means the company generates enough money to grow and reward shareholders.
Negative FCF for many years can be a red flag unless it’s due to planned growth investments.
Protects During Tough Times:
Companies with strong FCF can survive economic slowdowns without cutting essential spending or taking on expensive debt.
How to Check It
You can find FCF in the company’s cash flow statement:
FCF = Operating Cash Flow, Capital Expenditures
Rahul’s Tip:
Don’t just chase high profits.
Always check if the company is actually generating cash, because without cash, growth and survival both become impossible.
Conclusion:
Free Cash Flow might be the most ignored metric in investing, but it’s also one of the most powerful.
It tells you if a company can stand on its own feet, grow sustainably, and protect your investment in tough markets.
If you found this useful, like the post, share your view in the comments, and follow for more practical investing tips!
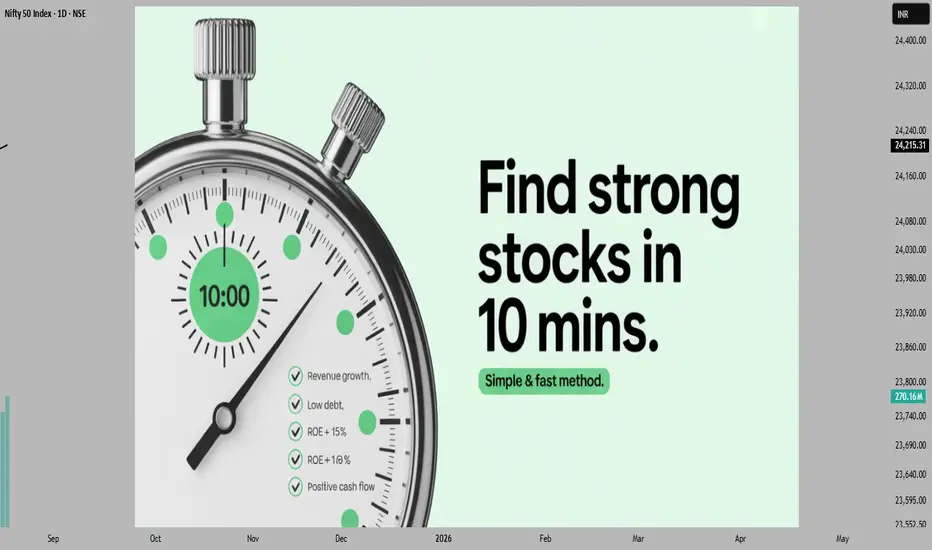
How I Shortlist Fundamentally Strong Stocks in Just 10 Minutes!Hello Traders!
Finding fundamentally strong stocks doesn’t have to be a week-long research project.
With the right process, you can filter out weak companies and shortlist potential winners in just 10 minutes.
Here’s exactly how I do it.
Step 1: Check Revenue & Profit Growth
I look at the last 5 years’ data to see if both sales and profits are growing steadily.
A consistent upward trend means the company has a stable business model and strong demand for its products.
Step 2: Look at Debt Levels
A fundamentally strong company should have low or zero debt.
Too much debt can eat into profits and create risk during market slowdowns.
Step 3: Review Free Cash Flow
I check if the company is actually generating cash after expenses.
Positive free cash flow shows the business is self-sustainable and not dependent on constant borrowing.
Step 4: Check Return on Equity (ROE)
An ROE above 15% usually means management is using shareholders’ money efficiently.
It’s a sign of strong leadership and good capital allocation.
Step 5: See Valuation Ratios
I compare the P/E and P/B ratios with industry averages.
A great company bought at an overvalued price can still give poor returns, so valuation matters.
Rahul’s Tip:
Don’t overcomplicate the process.
Focus on these 5 points and you’ll quickly filter out the junk, leaving you with stocks worth deeper research.
Conclusion:
Stock analysis doesn’t have to be overwhelming.
With a structured checklist, you can shortlist fundamentally strong companies in minutes — and spend the rest of your time tracking their performance.
If this process helped you, like the post, share your thoughts in the comments, and follow for more simple investing strategies!
How Promoter Holding Tells You the Real Story of a Company!Hello Traders!
When you invest in a company, you’re putting your money into the vision and decisions of its promoters.
One of the most powerful yet overlooked indicators of a company’s future is its promoter holding , the percentage of shares owned by the people who run the business.
Here’s why it matters and how to read it.
1. High Promoter Holding Shows Confidence
If promoters own a large portion of the company, it means they have a big personal stake in its success.
They win only when shareholders win, which often aligns their interests with yours.
2. Falling Promoter Holding Can Be a Red Flag
If promoters are consistently reducing their stake without clear reasons, it could mean they are losing confidence or need cash for other purposes.
This trend needs deeper investigation before you invest.
3. Pledged Shares Tell Another Story
Sometimes promoters pledge their shares to take loans.
If a large percentage of holdings is pledged, it’s a risk, because if the loan isn’t repaid, lenders can sell those shares, pushing the stock price down.
4. Stability Over Time is a Good Sign
A steady promoter holding over years shows trust in the business and signals that promoters are in it for the long run.
Rahul’s Tip:
Promoter holding should never be looked at in isolation.
Always check it alongside fundamentals, financial health, and industry outlook before making any decision.
Conclusion:
Promoter holding can reveal the real confidence level of the people behind the company.
When the promoters are heavily invested, and not pledging their shares, it’s usually a sign you’re looking at a solid long-term bet.
If this post gave you a new perspective, like it, drop your thoughts in the comments, and follow for more practical stock market insights!

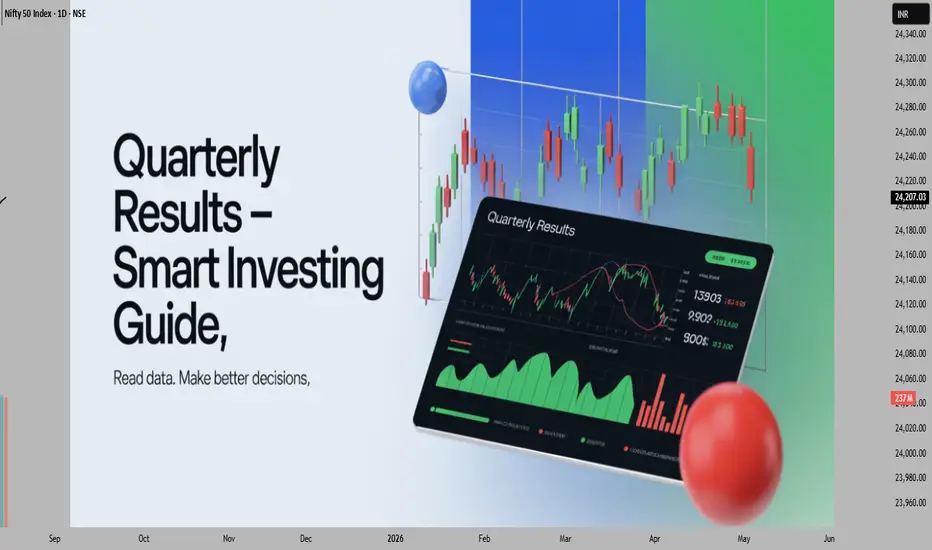
How to Use Quarterly Results for Investment Decisions!Hello Traders!
Every three months, listed companies announce their quarterly results.
While many traders react instantly to the numbers, smart investors know how to read them in context before making a move.
Here’s how you can use quarterly results to make better investment decisions.
1. Compare With Previous Quarters
Don’t just look at the latest figures in isolation.
Compare revenue, profit, and margins with the last 3–4 quarters to see if the business is improving or declining.
2. Check Year-on-Year Growth
Seasonal factors can distort quarter-to-quarter results.
That’s why comparing the same quarter of the previous year (YoY) gives a clearer picture of long-term growth trends.
3. Watch for Margin Changes
Rising sales with falling margins can mean rising costs or pricing pressure.
Stable or improving margins show operational efficiency and pricing power.
4. Look Beyond Profits
Also track debt levels, cash flow, and promoter commentary in the results report.
Sometimes profits rise due to one-time gains, which don’t indicate real growth.
5. See Market Reaction – But Think Independently
Stock prices may jump or fall sharply after results.
Don’t follow the herd; understand the data yourself before taking a position.
Rahul’s Tip:
Quarterly results are snapshots, not the full movie.
Use them as a check-in point to confirm if your investment thesis still holds.
Conclusion:
Quarterly results can be a powerful tool if you know what to look for.
By focusing on growth trends, margins, and underlying financial health, you can make smarter investment decisions and avoid knee-jerk reactions.
If this helped you, like the post, share your thoughts in the comments, and follow for more practical stock market insights!
Dividend Yield vs Growth – What Kind of Investor Are You?Hello Traders!
Every investor has a different style, but when it comes to building wealth, two popular approaches dominate, focusing on dividend yield or chasing growth stocks .
Both have their pros and cons, and the right choice depends on your financial goals and risk appetite.
1. Dividend Yield Investors
These investors look for companies that pay regular and high dividends.
It’s like receiving a steady paycheck from your investments without selling your shares.
When it Works Best:
If you want stable income, lower volatility, and are happy with moderate capital appreciation, dividend investing can be ideal.
Example:
Large, mature companies like utilities, FMCG, and blue-chip banks often have high dividend yields.
2. Growth Investors
These investors focus on companies with rapidly growing revenues and profits, even if they pay little or no dividend.
The idea is that the money reinvested in the business will generate higher long-term returns.
When it Works Best:
If you are okay with higher volatility and want maximum wealth creation over the long term, growth stocks could be the way.
Example:
Tech companies, emerging sector leaders, and innovative startups usually fall into this category.
3. Finding Your Fit
You don’t have to be 100% one or the other.
Some investors create a balanced portfolio with both dividend-paying and high-growth stocks to get the best of both worlds.
Rahul’s Tip:
Choose your strategy based on your life stage, cash flow needs, and risk tolerance, not on what’s trending in the market.
Conclusion:
There’s no one-size-fits-all answer.
Whether you prefer the stability of dividend yield or the excitement of growth, the key is to align your strategy with your goals and stick to it with discipline.
If you found this comparison useful, like the post, share your style in the comments, and follow for more practical investing tips!

How to Read a Balance Sheet – Simple Breakdown for Traders!Hello Traders!
Most traders ignore the balance sheet because it looks “too accounting-heavy.”
But understanding just the basics can give you an edge, especially when you want to know if a company is financially healthy.
Today, let’s simplify the balance sheet so you can read it with confidence.
What is a Balance Sheet?
A balance sheet is a snapshot of a company’s financial position at a specific point in time.
It tells you what the company owns, what it owes, and what’s left for shareholders.
Three Main Sections You Must Know
Assets:
Everything the company owns that has value, cash, buildings, machinery, inventory, and money owed to it.
Assets show the company’s ability to generate future income.
Liabilities:
Everything the company owes to others, loans, unpaid bills, and other obligations.
High liabilities compared to assets can be a warning sign.
Shareholder’s Equity:
The value left for shareholders after liabilities are subtracted from assets.
It’s like the “net worth” of the company.
Key Ratios to Look At
Debt-to-Equity Ratio:
Shows how much of the company is funded by debt versus shareholder capital. Lower is generally better.
Current Ratio:
Compares current assets to current liabilities. If it’s above 1, the company can likely pay short-term debts.
Return on Equity (ROE):
Measures how efficiently management is using shareholder funds to generate profit.
Rahul’s Tip:
You don’t need to be an accountant to read a balance sheet.
Focus on big-picture numbers, assets, liabilities, and equity, and see if the business is stable, growing, and not overloaded with debt.
Conclusion:
A balance sheet tells you if the company can survive tough times and fund future growth.
Once you understand it, you’ll never look at a stock the same way again.
If this helped you, like the post, share your view in the comments, and follow for more practical investing insights!