What is ROE and Why It’s the True Test of Management Efficiency!Hello Traders!
When it comes to judging how well a company is run, one ratio quietly reveals the truth, ROE (Return on Equity) .
It’s not just a number; it’s a measure of how effectively management uses shareholders’ money to generate profits.
Today, let’s understand what ROE is, why it matters, and how to use it the right way.
What is ROE?
Return on Equity:
ROE shows how much profit a company generates for every ₹1 of shareholder equity.
Example: An ROE of 18% means the company earns ₹0.18 for every ₹1 invested by shareholders.
Formula:
ROE = (Net Profit ÷ Shareholder Equity) × 100
The Higher, The Better, But…:
A high ROE often signals strong management and efficient use of resources, but it’s important to check how that ROE is achieved.
Why ROE is the True Test of Management Efficiency
Measures Profitability from Shareholder’s View:
ROE focuses on returns that actually belong to shareholders, not just overall profits.
Reveals How Capital is Used:
High ROE means the company is using its capital effectively to grow the business.
Filters Out Average Management:
Companies with consistently high ROE often have skilled leaders and a solid strategy.
Exposes Debt-Driven Illusions:
Sometimes ROE looks high only because the company is taking on huge debt. Always check debt-to-equity ratio alongside ROE.
Rahul’s Tip:
Don’t look at ROE in isolation. Compare it with peers in the same industry, and check if it’s consistent over several years.
A one-time spike in ROE doesn’t mean management has suddenly become brilliant.
Conclusion:
ROE is a powerful tool to judge management’s efficiency, but only when used with other checks.
Look for companies with steady, high ROE and reasonable debt.
That’s where strong management and sustainable growth usually go hand in hand.
If you found this useful, like the post, share your view in the comments, and follow for more easy investing insights!
Traderrahulpal

P/E Ratio Explained – And Why It’s Not Enough Alone!Hello Traders!
Most beginners hear about the P/E ratio and think it’s the holy grail of stock analysis.
But the truth is, while P/E ratio is useful, it’s not enough on its own to decide whether a stock is worth buying.
In today’s post, let’s break down what the P/E ratio actually tells you, and where it can mislead you if used blindly.
What is P/E Ratio?
Price-to-Earnings Ratio (P/E):
It tells you how much the market is willing to pay for ₹1 of a company’s earnings.
Example: A stock with a P/E of 20 means investors are paying ₹20 for every ₹1 of earnings.
High P/E = Expensive or Growth Stock:
A high P/E may mean the stock is overvalued or it could be a fast-growing company investors believe in.
Low P/E = Undervalued or Risky:
A low P/E could indicate a value buy or it might be a signal of weak future growth or company problems.
Why P/E is Not Enough
Doesn’t Show Debt or Cash Flow:
A company might have great earnings but poor cash flow or high debt, which P/E doesn’t reveal.
Earnings Can Be Manipulated:
Accounting tricks can inflate earnings temporarily. That makes P/E look good but misleads investors.
Doesn’t Consider Growth Potential:
Two companies can have the same P/E, but one is growing fast while the other is stagnant. Which one would you prefer?
Needs Peer Comparison:
A P/E of 25 may be high in one industry and low in another. Always compare with sector peers.
Rahul’s Tip:
Use P/E as a starting point, not a final decision-maker.
Combine it with other ratios like PEG ratio, ROCE, debt-equity, and free cash flow to get the real picture.
Also, check management quality and business model strength.
Conclusion:
P/E ratio is like checking someone’s temperature, it gives you a clue but not the full diagnosis.
Dig deeper. Understand what drives earnings and how sustainable they are.
If this post made P/E clearer, like it, drop your view in comments, and follow for more real-world investing insights!

What Actually Makes a Stock Worth Investing In?Hello Traders!
We all want to find that one stock that grows steadily and builds wealth over time. But the real question is, how do you know if a stock is truly worth investing in ?
Is it price? Hype? News?
No. It goes much deeper than that.
Let’s break down the key things smart investors look for before putting serious money into a stock.
What Makes a Stock Truly Investable?
Strong and Consistent Earnings:
Companies that grow profit quarter after quarter show that their business model works. Consistency builds confidence.
Rising Revenue with Healthy Margins:
Sales should grow, but not at the cost of profits. Look for improving or stable margins with revenue growth.
Low or Controlled Debt:
Too much debt can destroy future profits. A healthy balance sheet is key to long-term stability.
Industry Leadership or Moat:
Great companies dominate their space or offer something others can’t easily replicate. This gives them pricing power and safety.
Trustworthy & Visionary Management:
Good management focuses on sustainable growth. Avoid companies with shady history or poor decisions.
Future Growth Potential:
Past performance is good, but also check future plans. Are they innovating or entering new markets?
Rahul’s Tip:
Don’t fall for hype or short-term buzz. Focus on the business behind the stock . The most reliable stocks are often boring but fundamentally strong.
It’s not about buying cheap, it’s about buying value.
Conclusion:
A stock becomes valuable when the business behind it is strong, honest, and growing.
Don’t just chase price, study the story.
That’s how real wealth is built.
If you found this helpful, like the post, drop a comment, and follow for more simple and real-world investing tips.

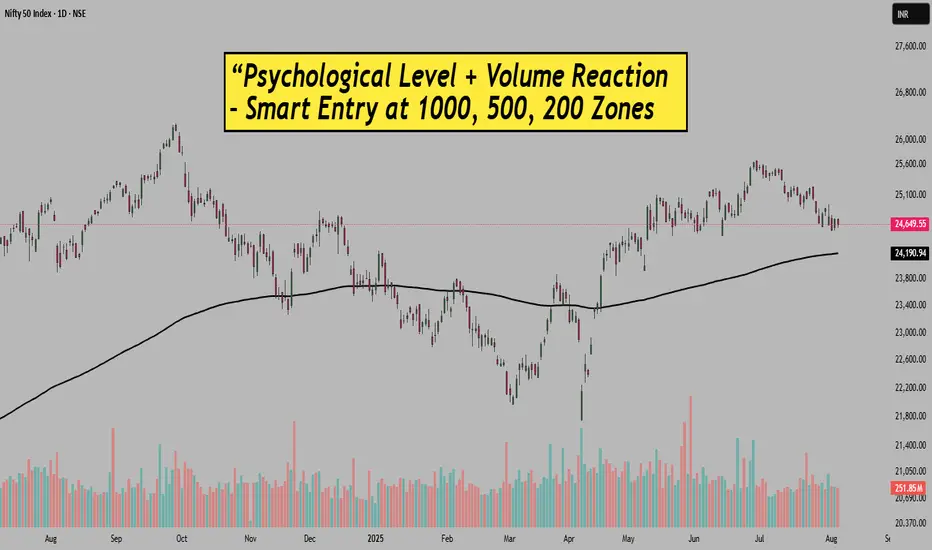
Psychological Level+Volume Reaction–Smart Entry at 1000-500 ZoneHello Traders!
Ever noticed how the market behaves around round numbers like 1000, 200, 500 levels?
There’s something powerful about these zones, not just technically, but psychologically too.
These are the levels where large participants often step in… and smart traders take entry.
Today’s post will help you understand how psychological price levels work — and how to combine them with volume confirmation for better intraday or swing setups.
Why Psychological Levels Matter
Round numbers attract attention:
Levels like 24500, 25000, 25500 in Nifty or BankNifty act as magnets. Institutions, algos, and even retail traders tend to place orders around these levels.
Buyers or sellers take control at these points:
Price often pauses or reverses here, as it becomes a battleground of supply and demand. Especially if this level is also a previous support/resistance zone.
Self-fulfilling behavior of traders:
Because everyone expects a reaction near these zones, price actually reacts. This creates great opportunities if you can enter with the right confirmation.
Volume Confirmation Makes It Powerful
Look for unusual volume near these zones:
Let’s say Nifty hits 24600 and suddenly you see a volume spike on a bullish candle — that’s not coincidence. That’s your cue.
Price rejection with volume is key:
Wick-based candles, engulfing patterns, or inside bars rejecting psychological levels with volume boost often lead to clean intraday moves.
Consolidation + Breakout works best:
If price consolidates near these psychological zones with low volume and breaks out with high volume, it often creates strong directional moves.
Rahul’s Tip:
Instead of randomly entering trades, mark round levels like 24500/24750 on your charts.
Then wait patiently, combine volume + price action and let the trade come to you.
Most false moves get filtered out when you use this setup with discipline.
Conclusion:
These psychological levels are used by big players to trap retail traders, but if you learn to read reactions at these levels, you can trade smarter.
No need to chase. Just observe, react, and manage risk.
What’s your experience with psychological levels? Have they helped your trades?
Share your thoughts in comments.
If this post helped, do like, follow and share with your trader friends.
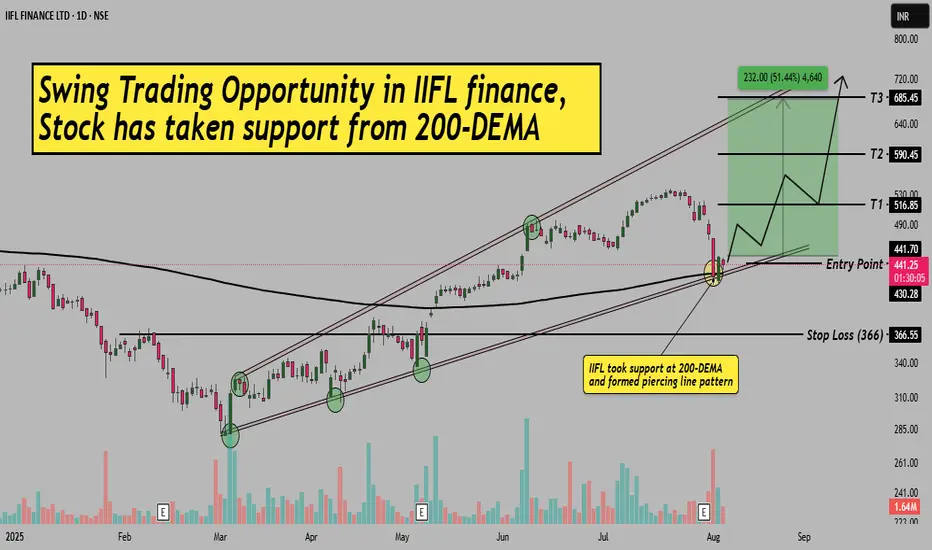
IIFL Finance–Swing Setup from 200-DEMA Support & Piercing Line!Hello Everyone, I hope you all are doing well in life and in trading!
Today I’ve brought a fresh swing trading opportunity in IIFL Finance , where the stock has taken support from the 200-EMA and is formed a bullish Piercing Line pattern.
After a strong uptrend, the stock corrected and has now taken trendline support (from channel base) along with the 200-day EMA confluence, a high-probability reversal zone. A clear bullish candle indicates a potential bounce from here.
The best part? The stock still offers a great risk-reward with defined entry, stop-loss, and 3 possible targets. Please refer to the chart for full trade setup details.
This setup is purely based on price action, moving average confluence, and support zone behavior.
If you are a swing or positional trader, this setup is worth keeping on your radar!
If you found this helpful, don’t forget to LIKE & FOLLOW for more such clean technical ideas.
Disclaimer: This idea is for educational purposes only. Always do your own research before taking trades.
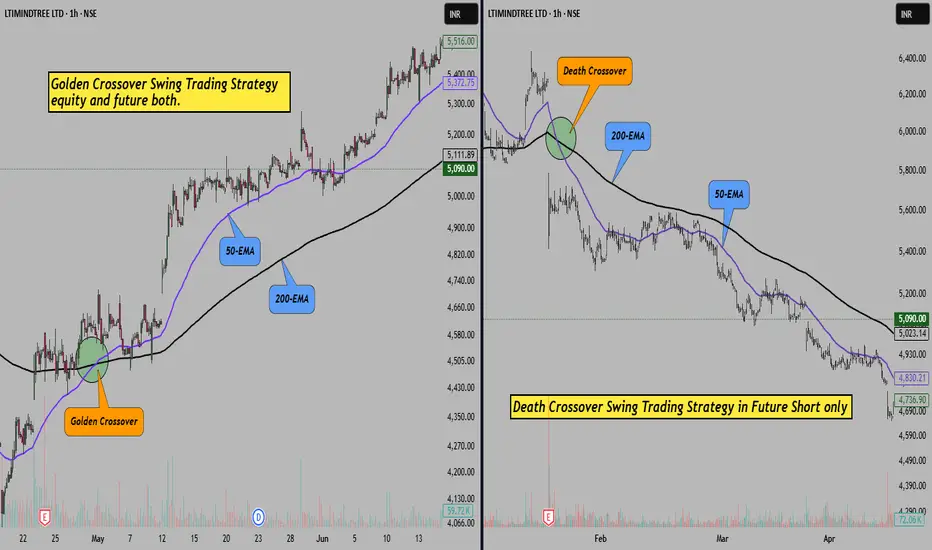
Golden EMA Setup – Catch Medium-Term Trends with 50 & 200 EMA!Hello Traders!
One of the simplest yet most powerful ways to identify long-lasting trends is by using moving averages. And among all combinations, there’s one that stands out for swing and positional trades, the Golden EMA Setup .
It uses just two tools: the 50 EMA and the 200 EMA. When used correctly, this setup helps you ride big trends and avoid choppy zones.
Let’s understand how this works and how you can apply it.
What is the Golden EMA Setup?
It’s a trend-following strategy based on the crossover of two EMAs:
50 EMA (Fast Average): Reacts quicker to price changes
200 EMA (Slow Average): Represents the long-term trend
When 50 EMA crosses above 200 EMA, it’s considered a Golden Crossover , a bullish signal.
When 50 EMA crosses below 200 EMA, it’s a Death Crossover , a bearish signal.
How to Trade This Setup:
Entry:
Buy when 50 EMA crosses above 200 EMA and price is above both.
Stop Loss:
Just below the 200 EMA or recent swing low.
Target:
Trail the stop loss and ride the trend till the crossover reverses or price weakens.
Timeframe:
Works best on daily or 1-hour chart for positional/swing trades.
Rahul Tip:
Golden EMA setup works great during trending phases, but avoid using it in sideways markets — you may get trapped in whipsaws. Always confirm with volume or RSI divergence before entering.
Did you ever used this strategy before, let me know in comment box.
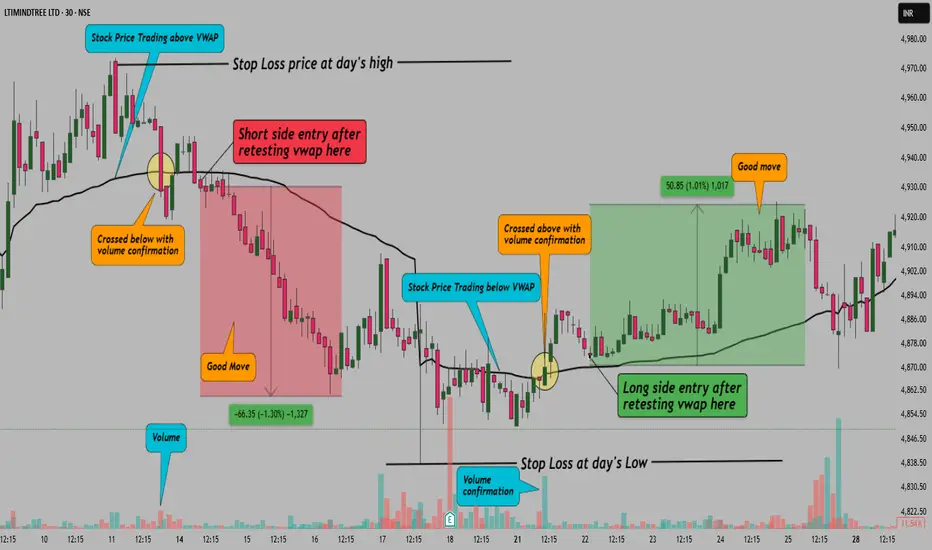
VWAP Flip Strategy–Most Accurate Setup for Intraday Trend Shift!Hello Traders!
One of the cleanest signs of intraday trend shift happens right at the VWAP — the volume-weighted average price. Most traders use VWAP as a trend guide, but they miss one powerful signal called the VWAP Flip .
When price flips from staying below VWAP to breaking above and holding — or vice versa — it often marks the start of a fresh trend. And if volume supports the move, the accuracy becomes even stronger.
What is the VWAP Flip?
It’s when price has been consistently staying on one side of VWAP, and then crosses over with conviction and starts respecting the other side.
For example, if price was trading below VWAP all morning and then breaks above with a solid candle, retests, and holds — that’s a bullish VWAP flip.
Why This Strategy Works
VWAP reflects average trader sentiment: When price flips above, it shows buyers are gaining strength
It filters false breakouts: Flip + retest helps avoid fake moves during sideways markets
Volume confirms conviction: A flip with increasing volume shows strong intent behind the shift
How to Trade the VWAP Flip
Step 1: Identify whether price is respecting VWAP from one side
Step 2: Wait for price to flip — clean break and candle close on opposite side
Step 3: Look for a retest of VWAP. Entry should be near VWAP with small stop loss
Step 4: Exit at previous day’s high/low or next support/resistance zone
Entry + SL + Target (Example Setup):
Entry: On candle close and retest above VWAP
Stop Loss: Below retest candle low
Targets: 1:2 RR minimum or trail till trend continues
Note:
This setup has been identified using the 5-minute timeframe, as it offers better intraday structure for the VWAP Flip strategy. However, since TradingView does not allow drawings below 15-minute timeframe for sharing or publishing, I initially marked the levels and structure on the 5-minute chart, took a screenshot, and then placed it over the 30-minute chart for visual representation.
Rahul Tip:
Use VWAP Flip only in trending environments. Avoid it in flat days. Combine it with 5 EMA or volume spikes for extra confirmation. Also, mark high-impact news times to avoid random flips.
Conclusion:
VWAP Flip is one of the cleanest, low-risk, high-reward intraday setups when used with proper structure and confirmation. Practice spotting it in real time — and it might become your new favorite setup.
Have you used VWAP Flip before? Let me know your win rate or drop a chart example in comments.
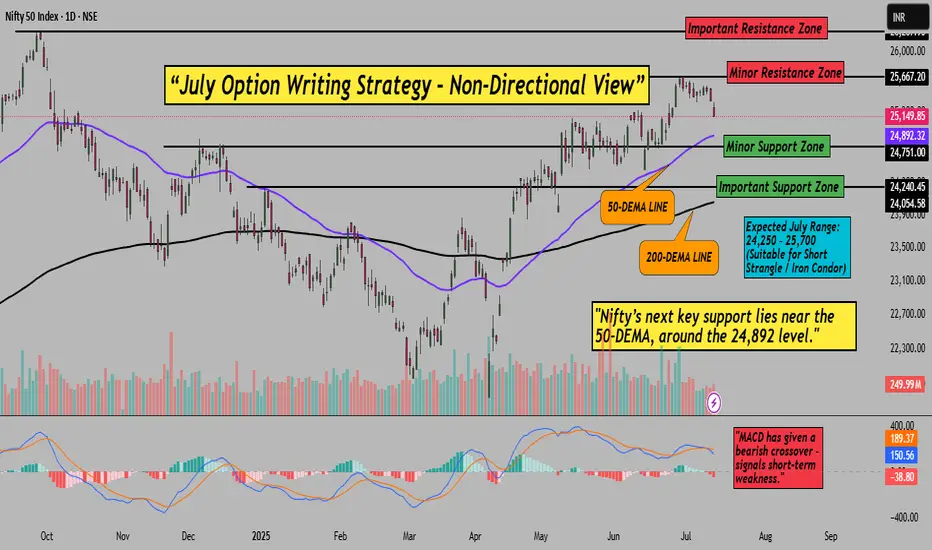
Nifty July Iron Condor Strategy – Premiums are Still Attractive!Hello Traders!
After a strong April, May and June where all three our option writing strategies gave full profits, we are back again with the July edition. Market is respecting the range beautifully, and we are again going with a non-directional Iron Condor setup.
Let’s walk through the logic and setup, based on the recent chart and market behaviour.
Why This Strategy Now? (Based on Chart Analysis)
Resistance Zone: 25,667–26,267 (two-layer zone, minor and major resistance)
Support Zone: 24,240–24,892 (50-DEMA tested, strong support)
Nifty is hovering inside the range – no clear trend, perfect for sideways strategy
MACD has given bearish crossover – adds pressure on upside
Strategy Setup (Iron Condor – 31st July Monthly Expiry)
Sell 24900 PE (2 lots)
Buy 24500 PE (2 lots)
Sell 25500 CE (2 lots)
Buy 25800 CE (2 lots)
Payoff Graph for Strategy:
Why This Works (Logic + Technical View)
Strategy revolves around the 24,750–25,650 zone where Nifty is stuck
Support well aligned to 50-DEMA at 24,892 and 24,240 (intermediate support)
Volatility is neutral, data is range-bound – ideal environment for iron condor writers
No major events or newsflow – market likely to stay inside band
Risk Management & Exit Points
Exit if Nifty gives a clean breakout above 25,700 or breakdown below 24,250
If strategy gives 40–50% max profit early, consider booking
Always keep an eye on VIX and OI buildup for major trend shifts
Rahul's Tip
This strategy has worked beautifully for last 3 months. If you’ve been with me, you know how well Iron Condors can work when market ranges. So we ride the same logic again, until the breakout comes.
Once again – this is a low risk, range-bound iron condor setup with good risk-to-reward.
Have you ever tried a short iron condor on NIFTY? What was your experience? Drop your thoughts below!
If you liked this post, don’t forget to LIKE and FOLLOW!
Regular updates coming with chart tracking, P&L changes and smart exits.
Disclaimer: This analysis is for educational purposes only. Please consult a financial advisor before making investment decisions.
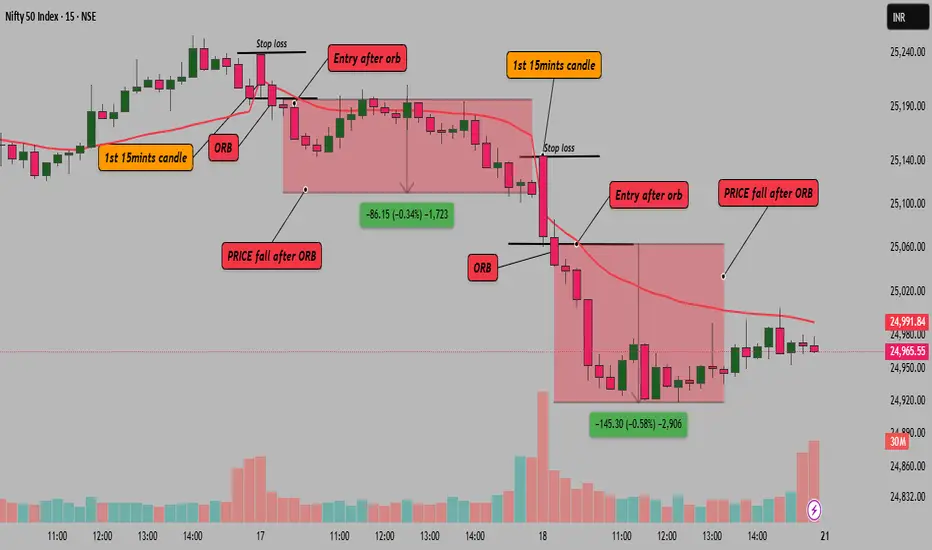
Opening Range Breakdown – Intraday Bears’ Favorite Setup!Hello Traders!
Today, let’s explore one of the most reliable setups for intraday traders – the Opening Range Breakdown (ORB) . This strategy is widely used by professional traders to catch early downside momentum when the market shows weakness right after opening. If executed correctly, it offers quick profits and tight risk management. Let’s break down how it works and how to trade it with confidence.
What is Opening Range Breakdown (ORB)?
The ORB strategy focuses on the first 15 to 30 minutes of market open . The idea is to mark the high and low of this initial range and look for a breakdown below the low – which signals bearish pressure. This setup works best on volatile days or when there’s negative sentiment in global cues.
Mark the Opening Range:
Track the high and low of the first 15 or 30 minutes of the market open.
Wait for a Breakdown Candle:
Look for a strong bearish candle closing below the opening range low with rising volume.
Enter on Confirmation:
Take a short entry just below the breakdown candle with stop-loss above the opening range high.
Target Previous Day’s Support or VWAP:
Your exit target could be based on previous day’s support, VWAP, or risk-reward ratio like 1:2.
Volume Confirmation is Key:
Avoid low volume breakdowns. Strong volume is what separates real breakdowns from fake-outs.
Ideal Conditions for ORB
Gap Down Open or Weak Global Cues – ORB works well when sentiment is already negative.
High Beta Stocks or Indices like BankNifty – These respond sharply to breakdowns.
No Major Support Below the Breakdown Level – Clean charts increase trade reliability.
Risk Management Tip
Keep your position size small and risk predefined. Don’t chase entries. Let the candle confirm the breakdown and only then execute.
Conclusion:
ORB is a favourite among experienced traders due to its simplicity and effectiveness. If you’re an intraday bear looking for high-probability setups, Opening Range Breakdown is something you must master.
Have you used ORB before? Let me know your experience or results in the comments!
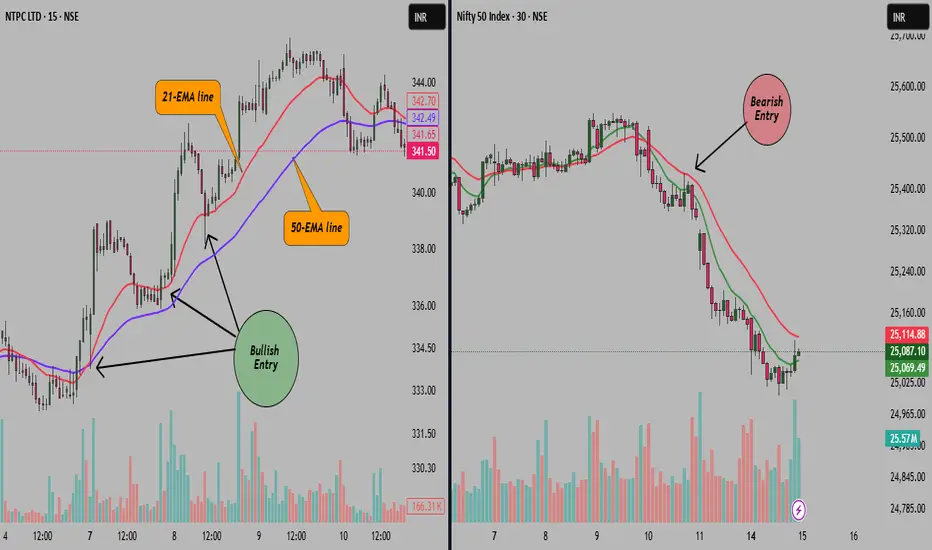
EMA Pullback Entry – The Cleanest Setup for Trend Followers!Hello Traders!
In today’s post, let’s explore one of the most reliable and beginner-friendly setups — the EMA Pullback Entry . If you’re a trend follower looking for clear, rule-based entries , this strategy will become a go-to in your toolkit. It helps you avoid chasing breakouts and instead ride strong trends with precision entries during pullbacks .
What is EMA Pullback Entry?
It’s a trend continuation strategy where traders use Exponential Moving Averages (EMAs) — typically the 21 EMA and 50 EMA — to identify the trend and wait for the price to retrace (pull back) into the moving average zone before continuing in the direction of the trend.
How to Trade the EMA Pullback Setup
Identify the Trend: Use a 21 EMA and 50 EMA on your chart. A bullish trend is confirmed when 21 EMA is above 50 EMA and price stays above both. Opposite for bearish.
Wait for a Pullback: Let the price retrace toward the EMAs without breaking below/above them significantly.
Look for Confirmation Candle: Wait for a bullish (or bearish) confirmation candle near EMAs — like a Pin Bar, Engulfing, or Doji rejection.
Entry & Stop Loss: Enter after confirmation. Place a stop-loss just below the pullback low (for long) or high (for short).
Target: Aim for previous swing high/low or use 1:2 risk-reward ratio.
Why It Works
Trend Is Your Friend: You’re trading with the trend, not against it.
Clear Visual Clarity: EMAs help you spot dynamic support/resistance zones.
Disciplined Entry: You wait for price to come to you, not chase it.
Rahul’s Tip
“The best trades often come to those who wait.” Don’t jump on every candle — let the price respect your EMAs, then strike.
Conclusion
The EMA Pullback Entry is a simple yet powerful setup that can give you high-probability trades in trending markets. Whether you trade intraday or swing, this strategy can help you time entries better and stay disciplined.
Have you tried this setup? Share your experience or ask questions in the comments – let’s grow together!
Nifty June Iron Condor Strategy–Range is Back Premiums are JuicyHello Traders!
Here’s a plan for calm minds who want to generate passive monthly income by leveraging the power of non-directional option selling. Based on the current Nifty structure and OI data, I’ve spotted a new range-bound opportunity — perfect for executing a safe, hedged Iron Condor setup.
Why This Strategy Now? (Based on Chart Analysis)
Resistance Zone: 25400-25500 (Heavy supply, multiple rejection visible)
Support Zone: 23400-23500 (Major bounce levels, strong OI support)
Nifty is currently trading near 24500, well inside this range — perfect for deploying a neutral premium-selling setup.
Strategy Setup (Iron Condor – 26 June 2025 Monthly Expiry)
Sell 25400 CE @ ₹123
(to protect upside move rejection)
Buy 25800 CE @ ₹56
(risk protection on breakout)
Sell 23650 PE @ ₹99
(to protect downside move rejection)
Buy 23200 PE @ ₹51.4
(risk protection on breakdown)
Strategy Highlights
(Screenshot – )
Why This Works? (OI Logic + Technical View)
Strong resistance visible at 25400–25500 zone with rising CE OI
Solid put writing zone at 23400–23500 — confirms downside support
Volatility is stable, time decay is in our favor — perfect for Iron Condor writers
Risk Management & Exit Plans
Exit early if either side breaks with volume
Don’t hold till expiry — aim to exit around 70–80% max profit
Always keep SL alert at breakdown range breaches
Rahul’s Tip
"Option writing is not for thrill, it’s for discipline. Iron Condor is a weapon when range is visible — use it like a sniper, not like a gambler."
Conclusion
If your view is Nifty likely to stay between 23400–25400 for the next few weeks, this Iron Condor setup offers high-quality time-based potential. Use proper lot sizing and risk control — let the theta do the work for you!
Have you ever deployed an Iron Condor on Nifty? What was your experience? Drop your thoughts in the comments!
If you liked this post, don’t forget to LIKE and FOLLOW!
I regularly share high-quality trading setups based on real analysis, OI data, and smart risk-managed strategies.
Disclaimer: This analysis is for educational purposes only. Please consult a financial advisor before making investment decisions.

Build Your Future Multibagger Watchlist with These Proven Rules!Hello Traders & Investors!
We all dream of catching that one stock that multiplies our money 10x, 20x, or even 100x over time — the Multibagger . But how do you find them before they become famous? Today, I’ll share a deeply researched, fundamentally backed framework to help you build your own Multibagger Watchlist — something that goes far beyond surface-level filters.
______________________________________________________________________________
First, let me show you a few real examples of multibagger stocks that I’ve compiled for you. All data is based on the charts available on TradingView. Please note, some companies may not have complete chart history from their listing due to data limitations.
Multibagger Legends of the Indian Stock Market!
Let’s look at some stunning long-term wealth creators that have delivered unimaginable returns from their listing prices.
Jyoti Resins & Adhesives
From 0.15 to 1,340 — a jaw-dropping rise of 1,062,540.54% !
This means ₹10,000 invested at IPO would be worth over ₹10 crore today.
Eicher Motors
From 1.00 to 5,319 — a mind-blowing return of 531,800% !
A textbook example of what patience and quality business selection can yield.
Infosys
One of India's most respected IT giants, grew from 0.71 to 1,602 — giving a solid 225,533.80% return.
Proves that tech leaders with consistent earnings growth are true wealth generators.
Shriram Finance
From 0.39 to 667.15 — a rise of 170,964.10% !
Strong presence in NBFC space, and a classic compounding story over decades.
______________________________________________________________________________
Step 1: Think Like a Business Owner, Not a Trader
Understand the Business: Is the company easy to understand? What does it sell? Is there strong demand for its products/services in the future?
Scalability Factor: Can this company grow 10x from its current size? Focus on businesses with low debt and high reinvestment ability.
Leadership Quality: Research the promoter’s history, vision, and governance. Multibaggers are built by visionary leaders, not random spikes.
______________________________________________________________________________
Step 2: Use These Fundamental Filters – Proven Across All Multibaggers
Sales Growth ≥ 15% YoY: Consistent top-line growth is a must. Look for at least 3–5 years of upward momentum.
ROCE > 15% & ROE > 18%: High returns show efficient use of capital — a common trait in early multibaggers.
Debt-to-Equity < 0.5: Avoid highly leveraged companies unless they’re in capital-heavy sectors (like power or infra).
Positive Operating Cash Flow: Profits are good, but cash flow is king — check if the company is actually generating cash.
Promoter Holding > 50% + Rising: Strong promoter confidence signals long-term vision.
PEG Ratio < 1.5: This links growth to valuation. A low PEG ratio means you're paying a fair price for future growth.
______________________________________________________________________________
Step 3: Qualitative Filters That Most People Ignore
Strong Moat or Niche Dominance: Does the company have a competitive advantage? Patents, brands, low cost, or a strong network?
New Industry Leader or Turnaround Story: Watch for companies leading sunrise sectors or turning around from past issues.
Asset Light & Scalable Model: More profits without increasing debt or fixed costs = Multibagger DNA.
Management Commentary in Annual Reports: Read what the management is saying — their confidence or cautious tone reveals a lot.
______________________________________________________________________________
Step 4: Where to Find Such Gems? Simple Tools You Can Use
Screener.in: Filter using financial ratios above. You can create a custom screen to shortlist candidates.
Trendlyne & TickerTape: Use SWOT analysis, sector rankings, and peer comparison tools.
Annual Reports & Conference Calls: Go directly to source material — look for capex plans, margin guidance, and new product lines.
TradingView Charts: Once shortlisted, analyze monthly charts — multibaggers show clear base-breakout and consolidation patterns.
______________________________________________________________________________
Rahul’s Bonus Tip
Multibaggers are caught early by people who mix logic with patience. Avoid hype stocks and flashy names — dig into businesses with real value, and don’t worry about instant returns. The earlier you enter quality, the bigger your rewards later.
Conclusion
Creating a future-ready Multibagger Watchlist isn’t about luck — it’s about discipline, filters, and conviction . Start building now, track consistently, and be ready to pounce when the market offers a chance. Remember: wealth in the market is transferred from the impatient to the patient.
Have you found a potential multibagger recently? Share your top pick in the comments and let’s build a community-driven watchlist!
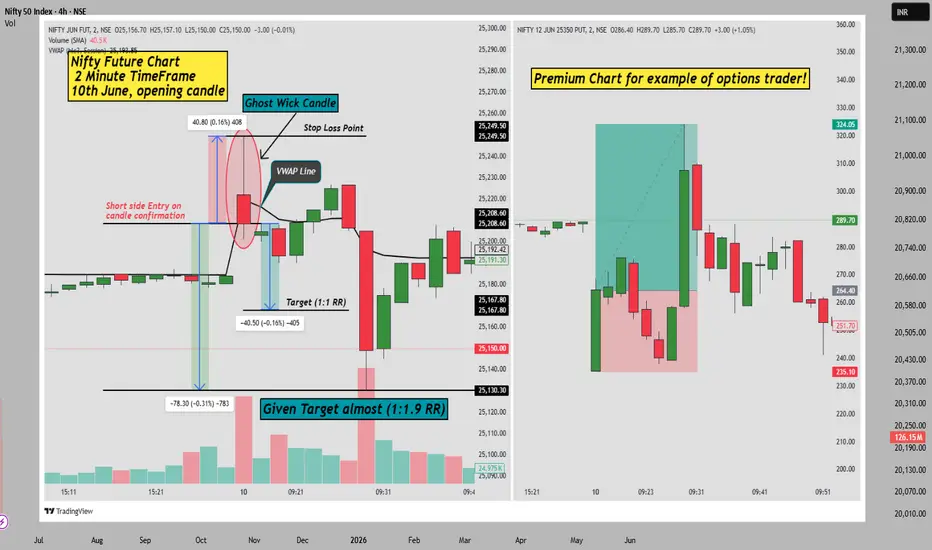
“Ghost Wick” Rejection Setup – Invisible Candle Setup from LTF!Hello Traders!
Today, let’s explore a powerful intraday price action concept that most traders completely miss — the “Ghost Wick” Rejection Setup . These are subtle but strong rejections that only show up on 1-min or 2-min charts , often disappearing or getting absorbed on 5-min or higher timeframes. If you’ve ever felt like your breakout failed but others caught it — this is what they saw!
What is the Ghost Wick Rejection Setup?
Appears Only on Lower Timeframes: You’ll notice sharp rejections with long wicks on 1-min or 2-min charts — but those wicks vanish on higher timeframes.
Happens at Key Levels: These setups often occur around VWAP, supply/demand zones, or previous highs/lows.
Used by Scalpers & Smart Money: Institutions and pro scalpers use these short-term traps to grab liquidity and reverse quickly.
How to Trade the Ghost Wick Setup
Watch Key Zones on 1–2 Min Chart: Look for long rejection wicks forming right at structure (VWAP, previous day’s high, etc.).
Wait for Confirmation Candle: Once the wick forms, wait for a strong opposite candle with higher volume or engulfing structure.
Enter with Tight SL: Enter at close of the confirmation candle. Place SL just above the wick (for shorts) or below (for longs).
Target Logical Zones: Go for quick 1:2 or 1:3 scalps — next support/resistance or VWAP reversion.
Real Example from Nifty Future Chart – 2 Min Timeframe (10th June Opening Candle)
In the chart above, you’ll see how a sharp rejection candle formed exactly at the VWAP line , followed by a breakdown. The “ghost wick” rejection triggered a precise short trade with a clean move downwards. The setup achieved nearly 1:1.9 RR , showing how accurate this rejection can be when spotted early.
Options Premium Chart on right side (Nifty 25350 PE)
To show how it impacts option Traders or scalpers — the 25350 PE premium spiked right after this rejection, hitting an exact 1:2 Risk-Reward target . It’s a perfect demonstration of how this setup works even for options traders, especially those trading momentum scalps.
Why This Setup Works
Retail Traders Miss It: Most people trade 5-min or 15-min charts and never see this trap setting up.
Algos Trigger Liquidity: These rejections are engineered to trap early breakout traders and reverse with force.
Scalping Precision: This setup allows tight stop losses with high R:R in just a few candles.
Rahul’s Tip
Use this only in high-volume environments — like market open or near key news events. Also, confirm with levels marked from higher timeframe. Don’t scalp in the middle of nowhere!
Conclusion
The “Ghost Wick” Rejection Setup is an advanced scalping trick that can massively improve your accuracy. It’s invisible to most — unless you’re watching closely on LTFs. Once you master it, you’ll never see price action the same way again.
Have you noticed ghost wicks before? Drop a 🕯️ in the comments if you’ve traded one!
If you found this post valuable, don't forget to LIKE and FOLLOW!
I regularly share real-world trading setups, actionable strategies, and learning-focused content — all from real trading experience , not theory. Stay connected if you're serious about growing as a trader!
When to Exit a Trade: Exit Plan for Every Trading Style!Hello Traders!
Every trade type needs a different kind of exit plan — but most traders use one-size-fits-all. That’s why they either exit too soon or too late.
Today, I’ll break down how to plan your exits based on trade type and intention .
A smart exit plan fits the nature of the trade — not just your emotion in the moment.
Exit Plan for Swing Trades
Target Based: Pre-decide 1:2 or 1:3 risk-reward levels.
Trailing SL (Candle Based): Move SL below each higher low in uptrend.
Exit on Structure Break: If price breaks key swing low, exit immediately.
Exit Plan for Positional Trades
Weekly Chart View: Exit only if weekly trend changes or closes below trendline.
Partial Booking: Book some profits at resistance zones, hold rest for trend continuation.
News/Events SL: Avoid holding through uncertain events unless strategy-backed.
Exit Plan for Long-Term Trades (Investment Trades)
Fundamental Exit: Exit only if company fundamentals weaken or story changes.
Valuation-Based Exit: Exit when valuations are stretched beyond long-term average.
Exit in Phases: Don’t exit fully — scale out in parts across 10-20% intervals.
Exit Plan for Breakout Trades
Multi-Year Breakout: Hold till price holds above breakout zone on weekly chart.
2-Week Breakout: Use previous resistance as SL. Exit if it fails to sustain above it.
Volume Confirmation: Exit if breakout happens on weak volume and fails to follow through.
Exit Plan for Options Trades
Defined SL in Premium: Keep strict SL (e.g., ₹30 loss on ₹100 premium).
Time-Based Exit: Exit if expected move doesn’t come by your time window.
Theta Decay Watch: Exit early if holding beyond 2–3 days and premium drops without move.
Momentum Exit: Trail SL tightly once premiums start shooting.
Rahul’s Tip
Don’t treat every trade the same. Swing, positional, long-term — each needs its own exit discipline.
Your plan should depend on chart timeframe, reason for entry, and trade type — not just emotions.
Conclusion
Your exit strategy should match your trade type, not just your mood.
Once you start using the right exit logic for the right trade, your results will become more consistent, more powerful, and way less stressful.
Thanks for reading!
If this helped bring clarity, do like, share and follow for more trading insights made simple.
Every Mistake Was a Lesson. Every Profit Was Just a Moment!Hello Traders!
Today’s post is about a truth that took me years to fully understand — mistakes are your best teachers , and profits are just short-term moments. When I stopped getting emotional about profits and started focusing on what each trade taught me, my growth as a trader truly began.
Every mistake was a step forward. Every profit was just a part of the path.
Why Mistakes Matter More Than Profits
Mistakes Show You the Flaws: You learn where your emotions or system failed.
Lessons Stick Longer: Losses force you to reflect, while profits are often forgotten.
Mistakes Build Awareness: You become more careful and sharp next time.
Profits Can Be Random: You may win even on a wrong trade — which teaches nothing.
How Focusing Only on Profits Can Hurt You
Overconfidence Rises: One good trade may make you take 3 bad ones.
You Ignore Process: You start caring only about P&L, not setups.
Emotional Swings Increase: Wins excite you, losses hit harder.
No Growth Happens: You chase results, not improvement.
What Changed When I Started Valuing Lessons Over Profits
My Journal Became Honest: I stopped hiding my bad trades from myself.
I Focused on Execution: Win or lose — I checked if I followed my rules.
My Emotions Settled: I didn’t get too happy or too upset anymore.
Growth Became Visible: Week by week, my decision-making got better.
Rahul’s Tip
If you only celebrate profits, you miss the real growth.
Start asking yourself after every trade — “What did I learn?”
That question will take you further than any winning streak.
Conclusion
Mistakes carry meaning. Profits are just snapshots.
The more you value lessons, the more consistent you become.
Build your trading journey on what you learn — not just what you earn.
Thanks for reading!
If this post connected with you, do like and share it with other traders.
Follow for more such real trading insights and psychology posts.
The Day I Stopped Chasing Every Move, My Trading Changed!Hello Traders!
Today I want to share something personal — a moment that quietly transformed my trading journey. I used to run after every candle, every small breakout, thinking I would miss the move if I didn’t jump in. But all it gave me was stress, overtrading, and random results.
The day I stopped chasing every move, my trades became calmer and more profitable.
Why We Chase Every Move
FOMO (Fear of Missing Out): We feel the market will move big without us.
Doubt in Own Strategy: We don’t trust our setup, so we jump into everything.
Restlessness: Sitting idle feels like wasting time.
Emotional Urge: We want quick action instead of waiting for perfect trades.
How Chasing Hurts Our Trading
Missed Good Setups: We get stuck in average trades and ignore high-quality ones.
Inconsistent Results: Wins and losses feel random.
Mental Fatigue: Watching every tick tires the mind.
No Learning Time: Back-to-back trades leave no time for review or learning.
What Changed When I Stopped Chasing
I Waited More: Took fewer but better trades.
I Became Selective: Only entered when setup matched my plan.
I Felt Peaceful: Trading didn’t feel like a race anymore.
I Gained Confidence: Fewer mistakes built stronger belief in my system.
Rahul’s Tip
If you find yourself getting tempted by every candle movement — pause.
Ask yourself, “Am I trading my setup or just chasing action?”
Wait for your edge. The calmest trader often wins the longest game.
Conclusion
Chasing every move looks exciting, but it silently kills your progress.
Once you stop doing that, trading becomes simple, focused, and powerful.
Thanks for reading!
If you found this post helpful, don’t forget to like and share it with fellow traders.
Follow for more such real-talk trading psychology and strategy content.
Ind–Pak Tension Sparks Panic! Gift Nifty Crashes 436 Points Now!Tension across the India–Pakistan border isn’t just making headlines — it’s shaking the markets too.
As per recent reports, there’s been a rise in military activity and geopolitical instability, which triggered a massive reaction in Gift Nifty.
Overnight, Gift Nifty tanked 436 points (~1.8%), with back-to-back red candles and volume spikes confirming a fear-driven move.
Sharp fall on the 30-min chart with increased volume — signs of panic selling.
Geo-political fear is real — institutions hate uncertainty, and this newsflow rattled sentiment.
Key support zones are broken — intraday structure now shifts toward the bearish side.
Volatility likely to spike in today’s opening — option premiums can go wild.
Premium sellers need to stay cautious — blindly deploying short straddles/condors can backfire.
This isn’t just a technical breakdown — it’s a sentiment-driven move.
When fear enters the market, logic takes a back seat — so best is to wait and watch the price behavior post opening.
Watch List: Nifty, Bank Nifty, and Defence sector stocks like HAL, BEL, BDL — expect heightened volatility.
Rahul’s View:
Don’t try to be a hero when headlines are hot. Smart traders protect capital and adapt to risk. Let price stabilize, then take calculated trades — not emotional ones.

Premium Trap in Option Buying – Learn the Game of IV Crush!Hello Traders!
If you’ve ever bought an option thinking it will explode — only to see the premium barely move or even drop — you’ve likely been a victim of the IV manipulation trap . Let’s understand how this “Premium Trap” works and how Implied Volatility (IV) can be silently killing your trades.
What is the Premium Trap?
The premium trap happens when IV drops significantly after you enter an options trade , especially during high-impact news events, earnings, or sudden market moves . Even if the stock moves in your direction, the option premium doesn’t rise as expected due to IV Crush .
How IV Manipulation Hurts Option Buyers
IV Builds Up Before Events: Before events like results or budget announcements, IV rises, inflating premiums.
Post-Event IV Crush: Once the event is over, even with expected moves, IV drops rapidly — causing premiums to deflate.
Flat Premiums in Trending Markets: Sometimes, the price moves gradually, but IV keeps falling, keeping premiums flat.
Theta Decay + IV Crush Combo: This deadly combo eats up your premium even if the market is moving in your favor.
How to Avoid the Trap
Check IV Before Entry: Avoid buying when IV is already high unless you expect a very large move.
Buy Deep ITM Options: They have less Vega and are less sensitive to IV drops.
Trade After IV Settles: Instead of trading before news, wait until after IV cools down and direction becomes clear.
Track IV Trend: Use IV percentile or IV rank to understand whether the current IV is high or low compared to its range.
Conclusion:
Option buying is not just about direction — timing and volatility are key . Don’t get trapped by inflated premiums and IV manipulation. Learn to read volatility before taking trades, and always manage your risk and expectations like a pro!
Have you ever been trapped by IV crush? Share your experience in the comments below!

Nifty April 2025 Option Writing Strategy – with Historical Edge!Hello Everyone, i hope you all will be doing good in your Trading and Your life as well.
April marks a new beginning for the financial year — and also brings powerful option writing opportunities for those who trust data and discipline. Based on historical Nifty behavior , April usually remains range-bound to mildly bullish , creating a favorable ground for neutral strategies like the Iron Condor.
Here’s a premium eating setup you can use for April 2025 — based on current Nifty price around 23,330.
Historical Behavior of Nifty in April
7 out of last 10 Aprils closed green — showing a consistent bullish tendency .
Volatility cools off after March — providing a good setup for sellers to benefit from IV crush .
Consolidation bias makes April perfect for non-directional premium strategies.
Short Iron Condor Strategy for April 2025
Nifty Spot: 23,330
Expiry: 24th April 2025
Here’s the Perfect trade setup:
Sell 22950 PE @ ₹126.55
Buy 22600 PE @ ₹69.05
Sell 23900 CE @ ₹101.05
Buy 24250 CE @ ₹44.30
Strategy Stats:
Max Profit: ₹8,569
Max Loss: ₹17,681
Breakeven Range: 22,836 – 24,014
Probability of Profit: 53.58%
Net Credit Received: ₹8,568
Margin Required: ₹99,708
Payoff Chart:
Why This Strategy Works for April?
Nifty has respected 22800–24000 levels multiple times — current OI supports consolidation in this zone.
Risk is defined, and reward is sufficient for neutral bias.
Great setup if you expect time decay to be in your favor without sharp directional moves.
Rahul’s Tip
April favors non-aggressive setups . Don’t over-leverage. Stick to range, manage deltas, and let theta do the magic . Roll your strikes only if VIX spikes heavily or index breaks breakeven zones.
Conclusion
This Iron Condor setup is one of the best risk-managed plays for April expiry. You’ve got wide breakevens, limited risk, and solid reward. If Nifty stays within range, you get paid while you wait!
Have you deployed your April strategy yet? Share your strike selection below – let’s trade smart, not hard!
Disclaimer: This analysis is for educational purposes only. Please consult a financial advisor before making investment decisions.
If you Found this helpful? Don’t forget to like, share, and drop your thoughts in the comments below.

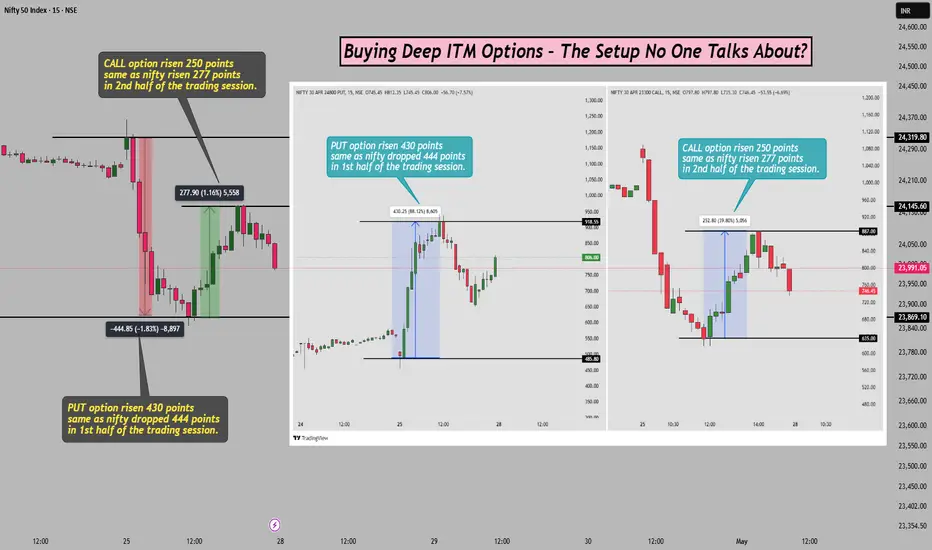
Buying Deep ITM Options – The Setup No One Talks About?Hello Traders!
When it comes to option buying, most traders are obsessed with OTM and ATM strikes for low premium and high returns. But very few talk about the hidden power of Deep In-The-Money (ITM) Options . Today, I’ll share a high-conviction directional setup where buying deep ITM options gives cleaner execution, better control, and higher probability of success — especially when you’re confident in trend direction.
Why Deep ITM Buying is a Game-Changer
Delta Advantage (0.8 to 1.0): Deep ITM options move almost 1:1 with the underlying, giving stock-like movement with less capital.
Less Impact of Theta Decay: Since time value is minimal, decay doesn’t hurt as much as OTM options.
Better Risk Management: With high delta and low extrinsic value, your SL and targets become more accurate.
The Ideal Setup to Buy Deep ITM Options
Step 1 – Identify a Strong Trending Day
→ Look for higher highs + higher lows (for longs), or lower highs + lower lows (for shorts)
Step 2 – Entry on Break + Retest or Trend Continuation Candle
→ Use price action patterns like bullish engulfing or breakout of flag pattern
Step 3 – Choose Deep ITM Option with 0.8–1 Delta
→ E.g., if Nifty is at 23,800, pick 23,300 CE or lower and do same for PE side as well.
→ You’re treating it like equity but with leverage
Step 4 – Risk-Reward & SL
→ SL just below structure (candle or VWAP)
→ RR should be minimum 1:2
Real Example(Nifty Chart Study)
On 25th April 2025, during the first half of the session, Nifty dropped by 444 points , and the Deep ITM PUT Option (24800PE) moved up by 430 points .
Later in the second half of the session, Nifty recovered by 277 points , and the Deep ITM CALL Option (23300CE) moved up by 250 points .
Notice how the Deep ITM options mirrored the index move almost 1:1, showcasing high delta impact with precision.
When NOT to Use This Strategy
Choppy or Low Volume Days: Deep ITM options need strong movement — sideways markets will kill the move.
High IV Environment (VIX > 15): Entry premiums may be inflated, making SL management tricky.
Rahul’s Tip
“If you’re 80% confident in your directional view, go Deep ITM instead of gambling with OTM.”
It’s how pros manage both reward and risk without getting crushed by decay.
Conclusion
Deep ITM Option Buying is rarely discussed but extremely powerful when used with clean setups and directional conviction. It behaves like equity, gives better control, and is ideal for short-duration intraday moves with high accuracy.
Have you ever tried Deep ITM options? Share your experience — let’s learn from each other in the comments!
If you found this post valuable, don't forget to LIKE and FOLLOW !
I regularly share real-world trading setups, actionable strategies, and learning-focused content — all from real trading experience, not theory. Stay connected if you're serious about growing as a trader!
The Real Skill in Intraday? Knowing When Not to Trade!Hello Traders!
Everyone talks about entries, indicators, and setups — but very few focus on the most underrated skill in intraday trading: Knowing When NOT to Trade . Believe it or not, avoiding bad trades is just as powerful as taking good ones. Let’s explore how mastering “no trade zones” can save your capital and improve your win rate.
Why Sitting Out is Sometimes the Best Strategy
Choppy or Range-Bound Market:
If the price is stuck between tight levels with no clear trend, avoid getting chopped in both directions.
Unclear Price Action:
If you don’t see your setup or price is not reacting clearly to support/resistance, it’s better to wait.
Major News Ahead:
Big economic events or earnings reports can lead to unpredictable moves — best to trade after dust settles.
How to Identify “No Trade Zones”
Inside Previous Day Range:
If today’s price is stuck inside yesterday’s range without volume, wait for breakout or breakdown.
Flat CPR + Low VIX:
Flat Central Pivot Range and low volatility means sideways market — avoid buying breakouts or fake moves.
Too Many Fake Breakouts in First Hour:
If the first 15–30 minutes show traps on both sides, market might stay indecisive.
Rahul’s Tip
“No trade is also a trade.” Waiting for the right setup is what separates a beginner from a pro. Trade when the market allows — not when you feel like it.
Conclusion
Intraday trading is not just about action — it’s about timing. Learn to recognize noise, avoid emotional trading, and protect your capital by sitting out when needed. Discipline isn’t just holding a position — it’s knowing when to stay flat.
Have you started skipping low-quality setups? Share your thoughts in the comments below!

Trade Only 1 Setup a Day – Here’s the One I Use!Hello Traders!
Ever heard the phrase: “Less is more” ? That applies perfectly to intraday trading. Chasing multiple setups often leads to overtrading, emotional decisions, and avoidable losses . Today, I’ll share why I prefer trading just one high-quality setup a day — and the exact one I personally use to stay consistent and stress-free.
Why Just One Setup a Day Works Wonders
Focus = Better Execution: When you wait for your setup, you don’t get distracted by noise.
Avoids Overtrading: No revenge trades, no chasing — just clean, planned execution.
Improves Risk Management: With one trade, you manage position sizing, SL, and RR with more clarity.
The Setup I Personally Use (VWAP + CPR Rejection Strategy)
Step 1 – Mark CPR + VWAP Zones
→ CPR gives range reference, VWAP shows volume-weighted fair value.
Step 2 – Wait for Rejection or Reversal from Zone
→ Look for price rejecting CPR or VWAP with a strong reversal candle (e.g., engulfing, pin bar, etc.)
Step 3 – Entry with Confirmation + SL
→ Enter only after breakout candle closes beyond the rejection level
→ SL = just above/below the zone
→ Target = 1:2 or nearest support/resistance
Why I Stick to This Setup
It Works Across Indices: Bank Nifty, Nifty, and even stocks.
Clear Risk-Reward Ratio: I know my exit before I enter.
Less Screen Time, More Peace: Once the trade is done, I’m done.
Rahul’s Tip
The market gives hundreds of signals, but only a few are clean. Trade one that fits your rulebook and let the rest go. Discipline > Drama.
Conclusion
You don’t need 10 trades a day to be profitable. You just need one trade with logic, structure, and discipline . Master one setup, build confidence, and let consistency build your capital.
What’s your favorite intraday setup? Drop it in the comments and let’s share ideas!

This 1 Mistake Traders Make After 10:30 AM – Don’t Be That guy!Hello Traders!
You’ve planned your trade, waited for price action, and taken a position… but somewhere after 10:30 AM, everything starts falling apart. If you’re wondering why your trades stop working post 10:30, you're not alone. Today, let’s talk about the most common mistake intraday traders make after 10:30 AM — and how to avoid it!
The Most Common Mistake: Chasing Breakouts Without Confirmation
Market Momentum Fades After 10:30 AM:
The opening volatility usually settles by 10:15–10:30 AM. If a breakout happens after that, it needs stronger confirmation — else it's likely a trap.
False Breakouts Increase:
Institutions fade late entries. Retailers jump in too late, and the market reverses.
Low Volume Breakouts = Failure Risk:
If a breakout happens with low volume post 10:30, it’s often just premium trap or stop-loss hunting.
What You Should Do Instead
Wait for Retest or Strong Volume Confirmation:
Never chase a move. Let price break, retest, and then trade with a proper SL.
Focus on Range-Bound Strategies Post 11 AM:
If market is inside a range, shift to option selling, scalping near VWAP or CPR.
Check Option Chain for OI Shift:
If there’s no OI change or reversal pressure building, skip the trade altogether.
Rahul’s Tip
After 10:30, the market starts filtering out emotional traders. Be the one who trades based on logic — not FOMO. Sideways traps are silent killers.
Conclusion
Intraday success depends on timing + logic. Don’t be that guy who chases breakouts after 10:30 AM without confirmation. Instead, observe market behavior, wait for quality entries, and protect your capital.
Have you fallen for these late breakouts? Share your experience in the comments and let’s learn together!
