XAUUSD (GOLD) | BREAKOUT VS BREAKDOWN LEVEL | 29th Jan'2026XAU/USD (Gold) Outlook | 29 Jan 2026
Gold (XAU/USD) is trading near 5513, maintaining a strong bullish structure across daily, weekly, and monthly timeframes. Price is holding well above key moving averages, indicating sustained buying momentum. As long as gold stays above the 5515–5495 support zone, the upside bias remains intact with potential continuation toward 5555–5590. A decisive break below 5495 may trigger short-term corrective pressure, but the broader trend remains positive.
Breakout & Breakdown Levels
Bullish Breakout: Above 5555 | Bearish Breakdown: Below 5495
Disclaimer: This content is for educational purposes only and not financial advice. Trading involves risk; manage your position size wisely.
Traders

XAUUSD (Gold) | Bull vs Bear Scenerio | 28th Jan'2026XAUUSD (Gold) | Technical Outlook | 28 Jan 2026
Gold (XAU/USD) is trading near 5,291, maintaining a strong bullish trend across intraday, daily, and higher timeframes. Price is holding firmly above all major moving averages (MA5–MA200), confirming trend strength. Momentum indicators (MACD, ADX, ROC, Bull/Bear Power) support further upside, while oscillators (RSI, Stoch RSI, CCI, Williams %R) remain overbought, indicating strong momentum with chances of short-term pullbacks. Volatility remains high (ATR ~59), so key levels are crucial.
Key Levels
Support: 5,232 | 5,198 | 5,135 | 5,101
Resistance: 5,295 | 5,330 | 5,392
Intraday Pivot: 5,232
Breakout & Breakdown
Bullish (Breakout):
Buy Above: 5,295
Targets: 5,330 → 5,392 → 5,400
Trend continuation above resistance
Bearish (Breakdown):
Sell Below: 5,232
Targets: 5,198 → 5,135
Below 5,100 → 5,000–4,950 (correction zone)
Conclusion
Overall trend remains bullish. Buy-on-dips above support is preferred, but avoid chasing near highs due to overbought conditions. Trade strictly on breakout or breakdown confirmation with proper risk management.
Disclaimer :For educational purposes only. Gold trading involves high risk. Always use stop-loss and trade as per your risk appetite.

XAUUSD (Gold) | Bullish vs Bearish SetupS | 23rd Jan'2026XAU/USD – Key Levels (23 Jan 2026)
Resistance:
* R1: 4975–4985 → Near-term supply
* R2: 5000–5015 → Psychological breakout zone
Support:
* Pivot / Demand Zone: 4940–4955 → Intraday balance
* Primary Support: 4920–4940 → Trend bullish above
* Secondary Support: 4880–4900 → Strong swing support
* Trend Invalidation: 4850 → Break weakens bullish trend
Bullish Swing Setup
* Buy on Dip: 4920–4940 | SL: 4900 | Targets: 4975 → 5000 → 5015
* Breakout Buy: Above 4985 | SL: 4955 | Targets: 5000 → 5030 → 5050
Bearish Swing Setup (Corrective)
* Pullback Sell: Below 4920 | SL: 4940 | Targets: 4880 → 4850 → 4820
* Trend Shift Sell: Break below 4850 | SL: 4880 | Targets: 4800 → 4760

XAUUSD (Gold) | Technical Outlook | 22nd Jan'2026Gold continues to trade near 4,831, maintaining a strong bullish structure across all major timeframes. Price remains firmly above key moving averages (20/50/100/200), signaling sustained buyer control and trend continuation.
Momentum indicators support the upside, with RSI in bullish territory, MACD positive, and ADX above 35, confirming strong trend strength. Volatility remains elevated, suggesting sharp and directional price moves.
Key Levels to Watch
Support: 4,800–4,790 | 4,770–4,760 | 4,740–4,730
Resistance: 4,838–4,845 | 4,870–4,888
Major Breakout: Above 4,900
Bullish Bias
As long as Gold holds above 4,770–4,780, the trend remains bullish. A break and close above 4,845 could trigger momentum buying toward 4,870 → 4,900+. Pullbacks are expected to remain corrective.
Bearish / Correction
Bearish pressure emerges only below 4,770, with downside levels at 4,740 → 4,700 → 4,660. Trend reversal only if 4,630 breaks on a daily close.
Trading Focus
Buy on dips near 4,800–4,790
Sell only on breakdown below 4,770
Watch US PMI, GDP, Jobless Claims, Fed commentary & DXY for volatility
Conclusion
Gold remains firmly bullish, with the path of least resistance pointing higher unless key supports fail.

XAUUSD (Gold) | Technical Outlook | 15th Jan'2026XAU/USD – Gold Technical Analysis
Price: 4,604 | Intraday: -0.47%
Gold is trading near 4,600 after a minor pullback. While short-term momentum shows selling pressure on lower timeframes, the overall trend remains strongly bullish on Daily, Weekly, and Monthly charts. Price continues to hold well above key moving averages (20, 50, 100, 200), keeping the broader uptrend intact.
Key Levels
Resistance: 4,616 → 4,632 → 4,648
Support: 4,598 → 4,586 → 4,551
Pivot: 4,599
Bullish Scenario
Above 4,600, buyers may push Gold toward 4,616–4,632. A strong breakout can extend gains toward 4,648.
Bearish Scenario
Below 4,586, selling pressure may increase, dragging price toward 4,566–4,551 (intraday correction).
Intraday Trading Strategy
Buy on dips: 4,590–4,600 | SL: below 4,566 | Targets: 4,616 / 4,632
Sell below: 4,586 (confirmation) | SL: 4,616 | Targets: 4,566 / 4,551
Bias: Bullish trend with short-term volatility.

XAUUSD (Gold) TECHNICAL OUTLOOK | 6th Jan'2026Gold is trading near 4,450, consolidating after a strong bullish rally. Price remains well above key moving averages, keeping the overall trend firmly bullish across intraday to higher timeframes.
Bullish View:
As long as gold holds above 4,445–4,450, upside momentum remains intact. A move above 4,470 can push prices toward 4,490 and 4,505–4,515, with 4,550 as a major resistance zone.
Bearish View:
A break below 4,445 may trigger a short-term pullback toward 4,430 and 4,410–4,395. Unless these levels break decisively, dips are likely corrective.
Intraday Focus:
Prefer buy-on-dips near support, while watching 4,500–4,515 for possible rejection.
Conclusion:
Trend remains strongly bullish. Expect volatility, but bias favors buyers unless key supports fail.

XAUSUD (Gold) | Technical Outlook | Last Day of Analysis 2025Gold is showing short-term weakness despite a bullish higher-timeframe trend (weekly/monthly). Current price action is driven by profit booking and momentum selling, with volatility keeping key levels in focus. As long as gold trades below 4,350, the intraday bias remains bearish, with downside levels at 4,327 → 4,305 (key) → 4,282, and a break below 4,305 opening room toward 4,275. Rallies below resistance are likely to be sold. A bullish reversal is only valid on a strong break and hold above 4,370, followed by acceptance above 4,395, which can open upside toward 4,416–4,450. For today, selling near resistance offers higher probability, while long positions should be considered only on confirmed breakout strength.

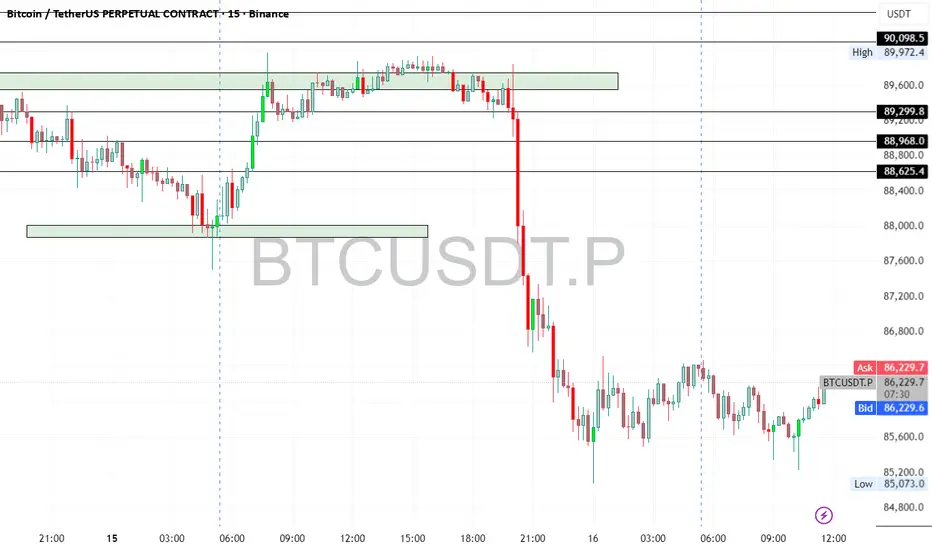
Bitcoin UpdateBTC is down ~2% today but has recovered from the lows and is holding above key support at $86,180 — showing strong respect for the trendline.
Key Levels:
🟢 Support: $86,180 → if this breaks, next major support is $75,000
🔵 Resistance: ~$92,000
🟩 Major Resistance: ~$100,000
Positioning:
I remain long from $86.2K and plan to add near $75K if price drops.
Trend structure remains intact.
NIFTY MIDCAPNIFTY MIDCAP formed with DOUBLE TOP with DIVERGENCE with first target 14,403, and next support at 13,995. If it didn't take supports at 13,995 we can see further downside with FINAL TRAGET 13,900.

Astral on the Verge: Technical Breakout & Investment Zones MappeAstral Limited : CMP: 1557.30: After studying its monthly chart structure and weekly Elliott Wave formations. Recent price action suggests a potential breakout setup, offering opportunities for both aggressive traders and patient investors.
Entry for Aggressive Traders:
• Aggressive traders can look for a breakout above the recent swing high near 1,579, as marked on both the monthly and weekly charts. This level has already shown strong momentum, with a notable price jump of +7.39% in the recent candle.
• Targets: 1630, 1725, 1795, 1935, 2200. Use trailing stop-loss: 1500, 1625, 1710, 1790, 1900 as you move up. Manage risk and adjust stop-loss as per levels.
Conservative Entry for Investors
• Investor Entry: Investors may enter on reasonable dips towards 1,440–1,460 support zone, as this range aligns with previous resistance turned support and is less volatile. Alternatively, entry after confirmation of the breakout above 1,579 with sustained volume is also suitable.
• Targets: Investors: Enter between 1,440–1,460. Targets: 1,935 and 2,200 for the medium term.
These represent major Fibonacci retracement zones and historical resistance levels, suggesting strong probability of acting as future price objectives. Investors can use a wider stop near 1,230 based on weekly chart support.
📌 Thanks a ton for checking out my idea! Hope it sparked some value for you.
🙏 Follow for more insights
👍 Boost if you found it helpful
✍️ Drop a comment with your thoughts below!

Option Trading 1. Introduction to Options Trading
Options trading is one of the most powerful tools in the financial markets. Unlike traditional stock trading, where you buy or sell shares directly, options allow you to control an asset without owning it outright. This gives traders flexibility, leverage, and a wide range of strategies for both profits and risk management.
At its core, an option is a contract that gives the buyer the right, but not the obligation, to buy or sell an underlying asset at a specific price (called the strike price) on or before a certain date (the expiration date).
The beauty of options lies in choice: you can profit whether markets are rising, falling, or even staying flat—if you know how to use them.
2. What is an Option?
An option is a derivative instrument, meaning its value is derived from the price of another asset (the “underlying”), such as:
Stocks (e.g., Reliance, Apple)
Indexes (e.g., Nifty, S&P 500)
Commodities (e.g., Gold, Oil)
Currencies
Two Main Types of Options:
Call Option – Gives the right to buy the underlying asset.
Put Option – Gives the right to sell the underlying asset.
Example:
A call option on Reliance with a strike price of ₹2500 expiring in one month gives you the right (not the obligation) to buy Reliance shares at ₹2500, regardless of the market price.
A put option with a strike of ₹2500 gives you the right to sell at ₹2500.

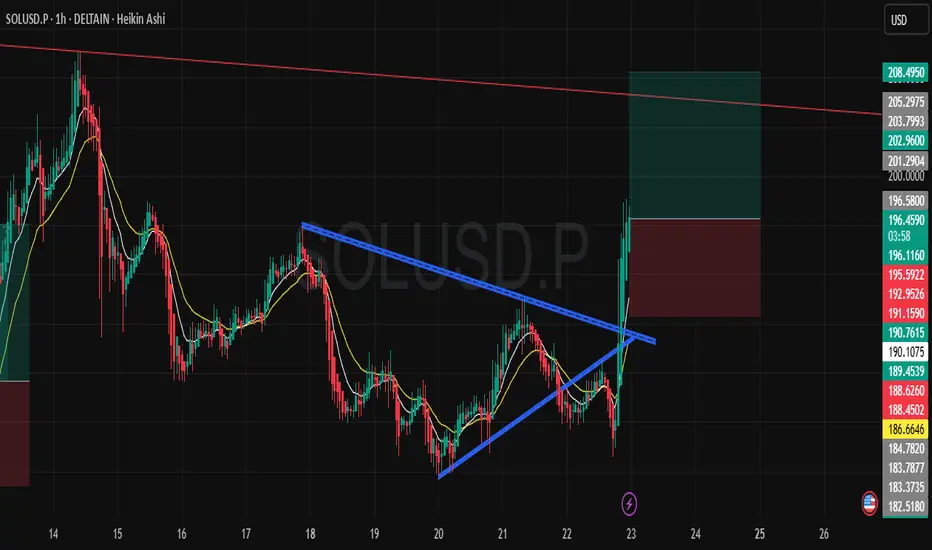
SOL/USDT – Bullish Breakout SetupOn the 1H chart, SOL has broken out of the falling wedge / descending trendline after consolidating for several sessions. The breakout is supported by strong bullish momentum and Heikin Ashi candles showing continuation strength.
Entry: Around current breakout levels (≈196.5)
Stop Loss: 191 (below recent swing low & structure support)
Target: 208 (first major resistance & fib confluence zone)
The risk-reward ratio is favorable, and as long as SOL holds above 191, the bias remains bullish with potential for further upside.
⚠️ This is not financial advice. Please manage risk accordingly.
EUR/USD Bearish Trade Idea - Detailed Analysis** IF you like my observation, please boost and follow for more content."
Timeframe: 1 Hour
Entry Price: 1.16177
Stop Loss (SL): 1.16521
Take Profit (TP): 1.15763
Market Overview:
Trend Context: The EUR/USD pair is currently in a clear downtrend as indicated by the price action making lower highs and lower lows.
Chart Setup: The chart shows a descending triangle pattern, which typically signals a continuation of the bearish trend, as the price struggles to break through the resistance at the upper boundary while consistently making lower lows.
Trade Rationale:
Descending Triangle Pattern:
The formation of a descending triangle indicates a strong bearish bias, where the sellers have been consistently defending the resistance level.
The price is making lower highs and has found support at the 1.16177 level, a key point where the downtrend has previously gained momentum.
A breakdown from this triangle often leads to a continuation of the downward movement, reinforcing the bearish outlook.
Entry Setup:
The entry point at 1.16177 is set below the support level, confirming that the price is likely to break through and continue downward.
A close below this level would provide confirmation for the short position, as the breakdown indicates further downward potential.
Stop Loss Placement:
The Stop Loss (SL) is set at 1.16521, just above the last significant swing high and the trendline of the triangle. This allows for some room in case of a false breakout while minimizing risk if the price reverses above this level.
Take Profit Target:
The Take Profit (TP) is set at 1.15763, where the previous support has been observed. This level represents a logical exit point, based on the measured move of the triangle pattern and the market's reaction at this support area.
Risk-to-Reward Ratio (RRR):
This setup offers a favorable risk-to-reward ratio, with a stop loss of approximately 45 pips and a take profit target of approximately 114 pips. This results in an RRR of about 1:2.5, which aligns with a solid risk management strategy for a favorable trade.
Technical Indicators:
Exponential Moving Averages (EMA):
The chart indicates the use of EMAs, which are still in a bearish alignment. The price is below both the 9-period and 20-period EMAs, suggesting that the overall trend is downward.
The EMA setup confirms the bearish momentum, reinforcing the rationale for the short position.

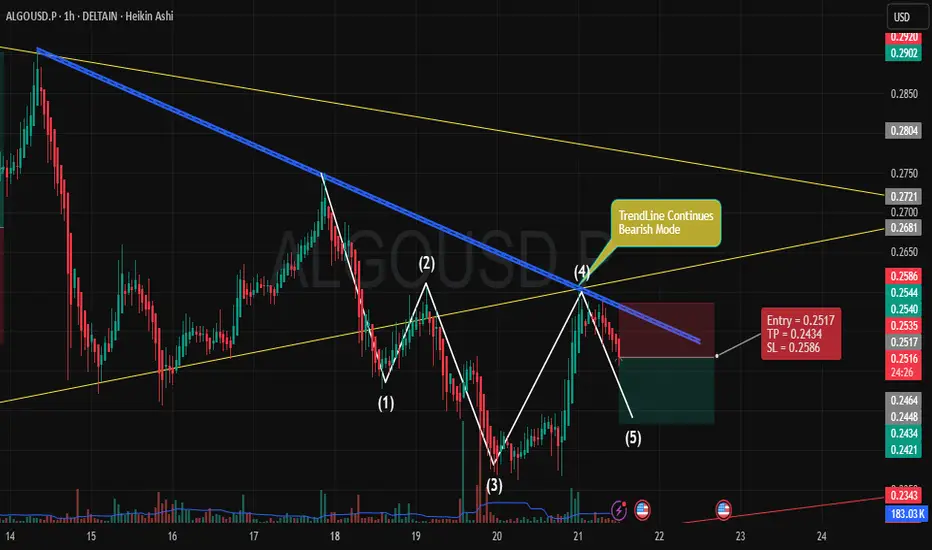
Bearish Continuation for ALGOUSD** IF you like my observation, please boost and follow for more content."
Trade Overview:
Entry: 0.2517
Stop Loss (SL): 0.2586
Take Profit (TP): 0.2434
Key Points:
Trend Analysis:
The price is currently under a bearish trend as indicated by the downward sloping blue trendline. This trendline shows consistent resistance, rejecting price rallies and continuing the bearish bias.
The yellow trendlines represent key support and resistance zones, highlighting the consolidation range where the price has been fluctuating within a defined pattern.
Market Structure:
Price has formed a lower high (marked as point 4), followed by a lower low (point 5), confirming the continuation of the downtrend. This suggests that the market is likely to keep pushing lower towards the target.
The price has retraced upwards but has failed to break the bearish trendline, reinforcing the idea of further downside potential.
Entry Strategy:
Entry Point: We are entering at 0.2517, just below the recent resistance, anticipating the price to continue downward after failing to breach the trendline.
The price action at point (4) suggests weakness in the upward movement, making this a prime opportunity to capitalize on further downside movement.
Risk-Reward Setup:
The Stop Loss is set at 0.2586, just above the last swing high, giving room for minor retracements while protecting against a breakout above the trendline.
The Take Profit is set at 0.2434, targeting the next level of support where the price could potentially find buying interest. This gives a favorable Risk-Reward Ratio of about 2:1.
Volume Confirmation:
Notice the increase in volume during the downward movement, suggesting that sellers are in control. A drop in volume during price retracements further validates the weak bullish momentum and confirms the expected continuation to the downside.
Why This Setup?
The bearish trend, price action, and trendline rejection all align with a continuation trade setup.
The risk-reward is favorable, with a clear structure to exit the trade if the price moves against the position.
The broader market context is also in line with a bearish outlook, making this a high-probability trade setup for the next few hours.
Part 6 Learn Institutional TradingPopular Option Strategies
Options can be combined to design strategies:
Beginner Strategies:
Covered Call: Hold stock + sell call option.
Protective Put: Hold stock + buy put to protect downside.
Intermediate:
Straddle: Buy call + buy put (same strike) → profit in big moves.
Strangle: Buy OTM call + OTM put → cheaper than straddle.
Spread: Buy one option, sell another to reduce cost (Bull Call Spread, Bear Put Spread).
Advanced:
Iron Condor: Sell OTM call + put, buy further OTM call + put → profit in sideways market.
Butterfly: Buy 1 ITM, sell 2 ATM, buy 1 OTM → limited risk, limited reward.
Calendar Spread: Sell near-term option, buy long-term option.
Options Trading in India
Options are traded mainly on NSE.
Index Options (Nifty, Bank Nifty, FinNifty, Sensex) dominate volume.
Weekly expiry (Thursday) has made option trading highly popular.
SEBI Rules: Margin requirements apply for writers, buyers only pay premium.
Retail boom: 90%+ of daily market volume comes from options now.

High-Quality Dip Buying1. Introduction – The Essence of Dip Buying
The phrase “Buy the dip” is one of the most common in financial markets — from Wall Street veterans to retail traders on social media. The core idea is simple:
When an asset’s price temporarily falls within an overall uptrend, smart traders buy at that lower price, expecting it to recover and make new highs.
But here’s the reality — not all dips are worth buying. Many traders rush in too soon, only to see the price fall further.
This is why High-Quality Dip Buying is different — it’s about buying dips with probability, timing, and market structure on your side, not just reacting to a red candle.
The goal here is strategic patience, technical confirmation, and risk-controlled execution.
2. Why Dip Buying Works (When Done Right)
Dip buying works because:
Trend Continuation – In a strong uptrend, pullbacks are natural pauses before the next leg higher.
Liquidity Pockets – Price often dips into zones where big players add positions.
Psychological Discounts – Market participants love “getting in at a better price,” creating buying pressure after a drop.
Mean Reversion – Markets often revert to an average after short-term overreactions.
But — without confirming the quality of the dip, traders risk catching a falling knife (a price that keeps dropping without support).
3. What Makes a “High-Quality” Dip?
A dip becomes high quality when:
It occurs in a strong underlying trend (measured with moving averages, higher highs/higher lows, or macro fundamentals).
The pullback is controlled, not panic-driven.
Volume behavior confirms accumulation — volume dries up during the dip and increases on recovery.
It tests a well-defined support zone (key levels, VWAP, 50-day MA, Fibonacci retracement, etc.).
Market sentiment remains bullish despite short-term weakness.
Macro or fundamental story stays intact — no major negative catalyst.
Think of it this way:
A low-quality dip is like buying a “discounted” product that’s broken.
A high-quality dip is like buying a brand-new iPhone during a holiday sale — same product, better price.
4. The Psychology Behind Dip Buying
Understanding trader psychology is critical.
Fear – When prices drop, many panic-sell. This creates opportunities for disciplined traders.
Greed – Some traders jump in too early without confirmation, leading to losses.
Patience – High-quality dip buyers wait for confirmation instead of guessing the bottom.
Confidence – They trust the trend and their plan, avoiding emotional exits.
In other words, dip buying rewards those who stay calm when others are reacting impulsively.
5. Market Conditions Where Dip Buying Thrives
High-quality dip buying works best in:
Strong Bull Markets – Indices and leading sectors are making higher highs.
Post-Correction Recoveries – Markets regain bullish momentum after a healthy pullback.
High-Liquidity Stocks/Assets – Blue chips, large caps, index ETFs, or top cryptos.
Clear Sector Leadership – Strong sectors (tech, healthcare, renewable energy) attract consistent dip buyers.
It’s risky in:
Bear markets (dips often turn into bigger drops)
Illiquid assets (wild volatility without strong support)
News-driven selloffs (fundamental damage)
6. Technical Tools for Identifying High-Quality Dips
A good dip buyer uses price action + indicators + volume.
a) Moving Averages
20 EMA / 50 EMA – Short to medium-term trend guides.
200 SMA – Long-term institutional trend.
High-quality dips often bounce near the 20 EMA in strong trends or the 50 EMA in moderate ones.
b) Support and Resistance Zones
Look for price retracing to:
Previous breakout levels
Trendline support
Volume profile high-volume nodes
c) Fibonacci Retracements
Common dip zones:
38.2% retracement – Healthy shallow pullback.
50% retracement – Neutral zone.
61.8% retracement – Deeper but often still bullish.
d) RSI (Relative Strength Index)
Strong trends often dip to RSI 40–50 before bouncing.
Avoid dips where RSI breaks below 30 and stays weak.
e) Volume Profile
Healthy dips = declining volume during pullback, rising volume on recovery.
7. Step-by-Step: Executing a High-Quality Dip Buy
Here’s a simple process:
Step 1 – Identify the Trend
Use moving averages and price structure (higher highs & higher lows).
Step 2 – Wait for the Pullback
Let price retrace to a strong support area.
Avoid chasing — patience is key.
Step 3 – Look for Confirmation
Reversal candlestick patterns (hammer, bullish engulfing).
Positive divergence in RSI/MACD.
Bounce on increased volume.
Step 4 – Plan Your Entry
Scale in: Start with partial size at the support, add on confirmation.
Use limit orders at planned levels.
Step 5 – Set Stop Loss
Place below recent swing low or key support.
Step 6 – Manage the Trade
Trail stop as price moves in your favor.
Take partial profits at predefined levels.
8. Risk Management in Dip Buying
Even high-quality dips can fail. Protect yourself by:
Never going all-in — scale in.
Using stop losses — don’t hold if structure breaks.
Sizing based on volatility — smaller size for volatile assets.
Limiting trades — avoid overtrading every dip.
9. Real Market Examples
Example 1 – Stock Market
Apple (AAPL) in a bull market often pulls back to the 20 EMA before continuing higher. Traders buying these dips with confirmation have historically seen strong returns.
Example 2 – Cryptocurrency
Bitcoin in a strong uptrend (2020–2021) had multiple 15–20% dips to the 50-day MA — each becoming an opportunity before making new highs.
Example 3 – Index ETFs
SPY ETF during 2019–2021 often dipped to the 50 EMA before strong rallies.
10. Common Mistakes in Dip Buying
Catching a falling knife — Buying without confirmation.
Ignoring news events — Buying into negative fundamental shifts.
Overleveraging — Increasing risk on a guess.
Buying every dip — Not all dips are equal.
No exit plan — Holding losers too long.
Conclusion
High-quality dip buying isn’t about impulsively buying when prices drop. It’s a disciplined, structured, and patient approach that aligns trend, technical analysis, and psychology.
When executed with precision and risk management, it allows traders to buy strength at a discount and participate in powerful trend continuations.
The golden rule?
Never buy a dip just because it’s lower — buy because the trend, structure, and confirmation all align.
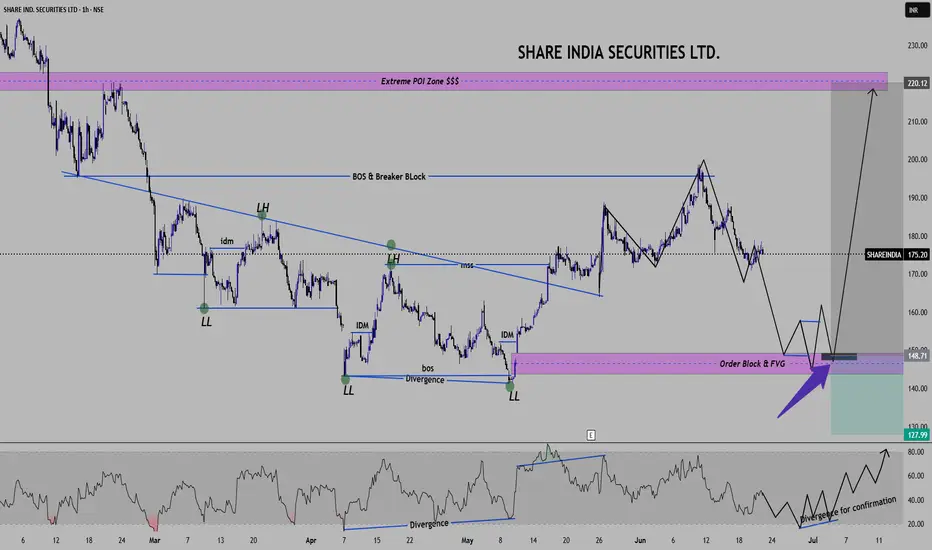
Share India Securities Ltd. ---- Deep AnalysisShare India Securities Ltd.
1. -----Company Technical Analysis Data
Analysis -- Based on ICT and SMC Concepts
TIME Frame -- 1 hour
Chart Elements & Observations ----
Market Structure -- 1. Clear bearish structure earlier with Lower Lows(LL) and Lower High(LH).
-- 2. Market Structure Shift (MSS) observed which indicates a possible reversal
-- 3. BOS(Break of structure) confirms shift from bearish to bullish bias.
Short Term Outlook (3-6 Weeks) ---
-- Price is currently retracing after recent high (190 levels)
-- We are projecting price to move down to the demand zone @150-160 levels followed by accumulation and reversal.
-- Short term plan is just watch price around 145-150, if price forms a liquidity sweep + Bullish structure then
this is a potential buy Zone.
-- RSI confirmation will strengthen this zone (here we will look for bullish divergence again.)
Short term trade plan -- Buy zone - 145-150 (after confirmation Liq. sweep, bullish engulfing candle and OB Tap)
Stop Loss - 135--138 (Liquidity Below demand)
Target -1 ---- 175 (Retest structure)
Target -2 ---- 190 (Recent High),
Target -3 -----220 (Extreme Liquidity Zone)
Keep note that ----- If price 148-145 demand zone fails then next Higher Time Frame demand may come near 135 levels.
All Traders and Market Influencers, Your Views or comments are most welcomed. Thank You.
==============================================================================
Nifty Bank Intraday levels(For Education Purpose)20.05.2025📉 Bearish (Sell) Setup:
Sell Below: ₹55,480 (confirmed breakdown)
Targets:
🎯 Target 1: ₹55,400
🎯 Target 2: ₹55,300
🎯 Target 3: ₹55,180 (if heavy selling continues)
Stop Loss: ₹55,580 (or ₹55,600 for conservative SL)
///📈 Bullish (Buy) Setup – Only if Reversal Happens:
Buy Above: ₹55,600 (strong reversal with volume & green candles)
Targets:
🎯 Target 1: ₹55,700
🎯 Target 2: ₹55,800
🎯 Target 3: ₹55,900
Stop Loss: ₹55,480

PTCIL – Breakout From Long-Term Consolidation ZonePTCIL is showing strong signs of a bullish breakout, with price holding steadily above key moving averages and positive trend indicators. Institutional accumulation appears to be behind this move, and a close above resistance could see significant upside.
There is a high chances for upcoming move in bullish side

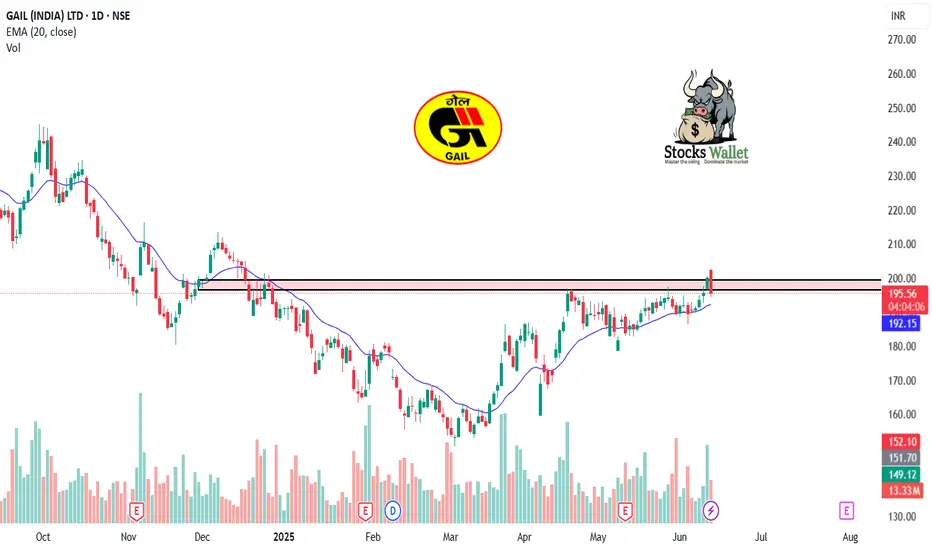
GAIL – Daily Timeframe , about to boomFollow us for more such content.
GAIL is showing strong signs of a bullish breakout, with price holding steadily above key moving averages and positive trend indicators. Institutional accumulation appears to be behind this move, and a close above resistance could see significant upside.
There is a high chances for upcoming move in bullish side
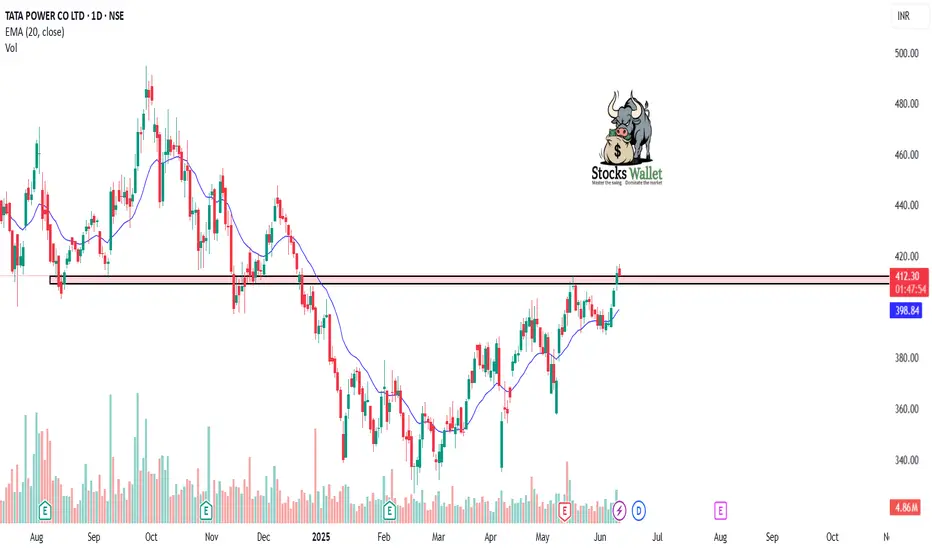
Bulish Breakout in Tata Power ⚡ Tata Power – Bullish Reversal Pattern on Daily Chart
Chart: Tata Power – Daily Timeframe
Tata Power has formed a strong bullish reversal setup after retesting a key support zone near ₹420. The stock has shown strong buying interest with rising volume and a bullish engulfing candle, indicating a potential start of a new upward leg.
🔹 Technical Highlights:
Price bounced from previous swing support (₹420–₹425)
Bullish engulfing candle + volume surge = strong buyer presence
RSI reversing from 50 zone and trending upward
20 EMA acting as dynamic support
📌 Trade Plan:
Entry Zone: ₹430–435
Target 1: ₹450
Target 2: ₹470
Stop Loss: Below ₹420 (closing basis)
The broader trend remains positive, and this could be the beginning of a new up-move. A breakout above ₹440 on strong volume would further confirm the bullish trend continuation.
⚠️ This analysis is for educational purposes only. Please do your own research before trading.
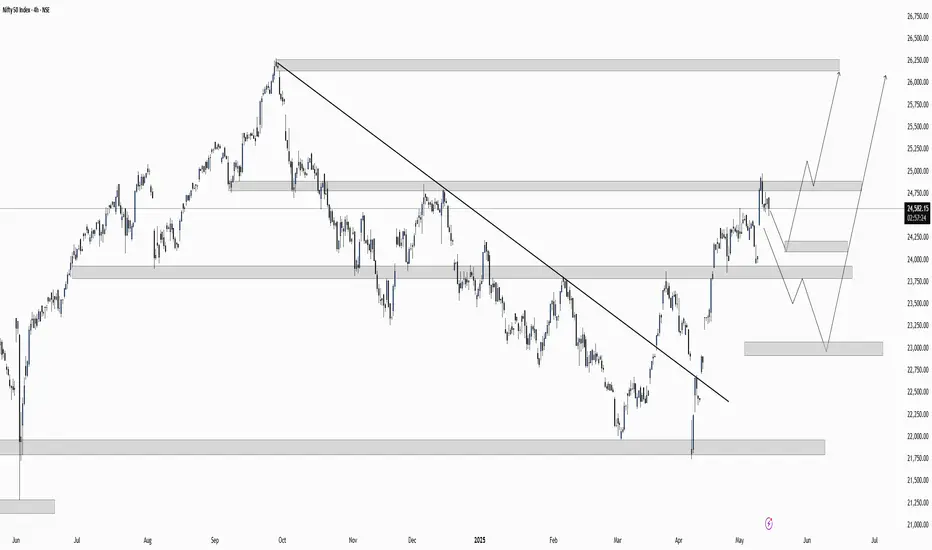
NIFTY 50 Index – 4H Technical Outlook🔍 Chart Overview
Index: Nifty 50 (NSE)
Timeframe: 4H
Current Price: 24,563.50
Bias: Bullish, but awaiting retracement
🧠 Market Structure Analysis
✅ 1. Trendline Breakout
Long-term descending trendline has been clearly broken, signaling a shift from bearish to bullish structure.
Strong bullish move post-breakout confirms momentum on the buy side.
🧱 2. Key Supply and Demand Zones
Zone Type Price Range Comment
Demand Zone 1 24,150 – 24,300 Strong structure zone, likely to hold on first retest
Demand Zone 2 23,500 – 23,750 Deeper retracement support, highly reactive
Demand Zone 3 22,900 – 23,100 Last stronghold; potential for swing reversal if tested
Supply Zone 25,000 – 25,300 Short-term resistance before bullish continuation
Target Zone 26,250 – 26,500 Next major upside target
🔄 Two Potential Bullish Scenarios Drawn
🅰️ Scenario 1: Shallow Pullback
Retrace to Demand Zone 1 (24,150–24,300)
Bounce and continuation toward 25,000 → 26,000+
Quick retest of structure support → higher high
🅱️ Scenario 2: Deeper Pullback
Break below Zone 1, retest Zone 2 or 3 (as deep as 23,000)
Strong demand and liquidity here could fuel a massive rally toward 26,000
This offers better risk-to-reward for long-term buyers
✅ Bullish Confluences
Signal Description
✅ Trendline Breakout Major signal for bullish reversal
✅ Higher High Formed Structure confirms bulls are in control
✅ Clean Demand Zones Zones are respected and visible
✅ Liquidity Grab Below Potential trap move below 24,000 to grab liquidity before continuation
✅ Fibonacci Confluence Likely overlap with 50–61.8% retracement (not shown, but expected)
❌ Invalidation Level
If price closes below 22,900, it may indicate a breakdown and trend reversal.
Watch for signs of bullish absorption around this level.
📊 Trade Idea: Buy on Dip
Entry Area Stop Loss Target 1 Target 2 Risk:Reward
24,150–24,300 23,950 25,200 26,250 ~1:3
23,500–23,700 23,200 25,200 26,250+ ~1:4
Disclaimer:
The information provided in this post/video/chart is for educational and informational purposes only. It should not be considered financial advice or a recommendation to buy or sell any security, financial product, or instrument.
I am not a SEBI-registered investment advisor. All trading and investing decisions are at your own risk. Past performance does not guarantee future results. Always consult with a qualified financial advisor before making any financial decisions.
EURUSD 4H chart - Short Setup🔍 Chart Overview
Pair: EURUSD
Timeframe: 4H
Pattern Identified: Head & Shoulders (bearish reversal pattern)
Trendline: Broken — signals end of previous uptrend
Market Structure: Lower highs forming → beginning of a downtrend
📉 Bearish Trade Setup
1. Entry Zone
Marked just below the broken trendline and neckline of the Head & Shoulders.
Entry: ~1.12450–1.12500
Price has already broken below neckline → confirming the pattern.
2. Stop Loss (SL)
Placed above the right shoulder, around 1.14096.
Smart placement as a break above would invalidate the Head & Shoulders pattern.
It also covers any minor retracement into the supply zone.
3. Take Profits (TP)
1st TP: ~1.09000 zone
🔹 This zone acted as previous structure support
🔹 Good area to book partials or move SL to breakeven
2nd TP: ~1.03258
🔹 Long-term target
🔹 Based on major previous demand zone visible on the left (possibly from daily chart)
🔻 Technical Analysis
✅ Bearish Confirmation
Head and Shoulders formation: Reliable trend reversal signal
Break of Trendline: Confirms the structure has shifted
Break of neckline: Entry confirmation
Retest of neckline/structure: Entry after confirmation makes it safer
🔎 Confluences
Confluence Result
Head & Shoulders ✅ Strong reversal pattern
Break of trendline ✅ Indicates shift in trend
Break + Retest of neckline ✅ Classic confirmation
Entry after confirmation ✅ Higher probability
SL above right shoulder ✅ Strategic placement
TP levels at structure & demand ✅ Logical TP zones
🛡️ Risk to Reward (RRR)
RRR is very favorable, roughly:
1st TP ≈ 1:2
2nd TP ≈ 1:4 or higher
A well-planned swing trade
📌 Final Recommendation
✅ This is a clean swing trade setup based on price action, pattern, and structure shift.
🔄 Consider partial close at 1st TP and trail SL.
🧠 Maintain discipline on SL—if price violates the right shoulder, exit.
