EUR/USD Bullish Setup – Liquidity Sweep & Break of StructureI’m sharing a long trade setup on EUR/USD based on a liquidity sweep and bullish market structure shift.
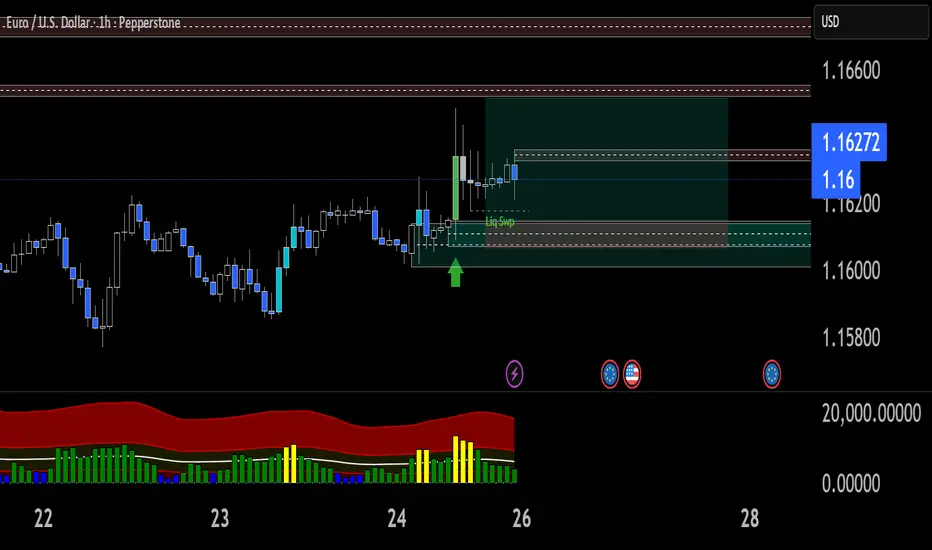
Price swept liquidity below the recent swing low and immediately showed strong bullish reaction, indicating absorption of sell-side liquidity. Following the sweep, price broke above short-term structure and retested the demand zone, confirming bullish intent.
I entered long at the retest of the demand area, with my stop-loss placed just below the liquidity sweep low to protect against invalidation. The take-profit target aligns with the next major supply zone / equal highs.
Trade Details:
Entry: 1.16147
Stop-Loss: 1.16066 (below liquidity sweep area)
Take-Profit: 1.16515 (major resistance/target zone)
Risk-to-Reward Ratio: 1:4.5+
Why this trade?
Liquidity sweep below previous lows (manipulation phase)
Break of structure to the upside confirming bullish momentum
Retest of demand zone with bullish candle confirmation
Volume spike supporting buyers entering the market
If price holds above the retest zone, I expect continuation to the upside toward the marked target area.
Tradesignals
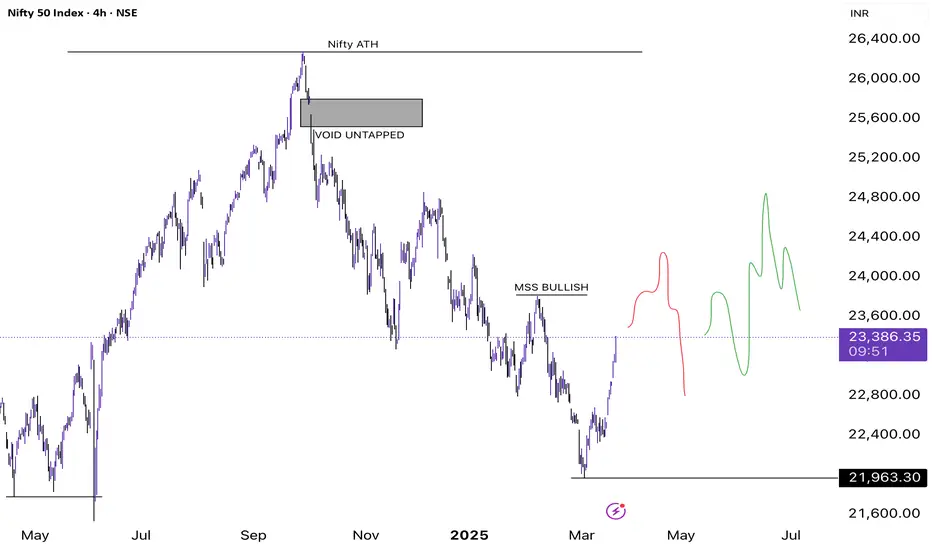
NIFTY 1D Technical Commentary on Market Maker Shifts- Nifty is currently trading at 23,395 up 6.5% from its recent high
- Nifty has still not flipped its structure so enjoying this rally doesn't look right
- Observation: Wait for a market structure shift above 23,828 and a weekly close above, this will help Nifty consume the sellers and make a bullish structure shift
- Two paths drawn signifies these 2 possibilities
- The red path shows we will deviate above the market structure shift trap many bids and long traders post that we will drop straight down
- The green path signifies we will reject straight from the Market Structure shift liquid zone and take out all the inefficiencies created and post that we might see an impulsive wave by trapping more shorts out.
- Everything depends on how the reaction is going to be
Nifty Crash Update & Reasons Behind Indian Markets Crashing - Nifty is currently trading at 23,964
- This chart is inverted to understand the bearish bias on a larger timeframe
- Nifty has already topped out, IMO and we will only see Nifty retracing larger and pumping small
- Nifty's point of release was from the zone of 25,214 and the market structure shift to bearish was around 24,753
- We can soon see a pullback towards the upside raiding and grabbing more liquidity and falling further down
- I find Bank Nifty to be strong when compared to Nifty
- Reasons Behind Indian Indices and Nifty Falling
1) FPI Outflows: Heavy Selling by foreign investors reallocating funds to other emerging markets like China, has reduced liquidity and intensified selling pressure.
2) SEBI Derivatives Regulation
3) Market Downgrade
4) Rising Crude Oil Prices
5) Technical Weakness

DIVIS LAB SHORTShort divis lab below 4028
The top has been breached and a fall is expected after the first pullback. The stock is low on volumes with a negative RSI diversion and is advancing its 200 ema. More fall will be there if it breaks the trend line.

PARAMETERS FOR WINNING TRADES ON ANY TIME FRAMEBuy when both the seprt trends give buy signal and add more positions when MA RIBBON turns green ,stoploss should be the minor supertrend tthreshold simillarly with sell, sell when both the supertrends gives sell signal, increase positions when MA RIBBON turns red. Keep an eye on itrabar volumes always.

#Ashokleyland share trend analysis by btcshikshaCloud bottom provided the support and now price will try to bounce back and breakout of the cloud.
Targets in green line, Stoploss in red.
Please do your own research before investing.
This is not a trade advice.
