Short-Term vs Long-Term Trading1. What Is Short-Term Trading?
Short-term trading focuses on taking advantage of price movements over a few minutes, hours, or days. The trader’s goal is to profit from short bursts of volatility instead of waiting for long-term trends. Short-term trading includes styles like intraday trading, swing trading, scalp trading, and momentum trading.
Key Characteristics of Short-Term Trading
a) Time Horizon
Short-term trades typically last:
Intraday: minutes to hours
Swing trading: 2–15 days
Momentum trades: until trend exhaustion
The focus is on quick entries and exits.
b) Trading Frequency
Short-term traders execute multiple trades within a week or even within a day. This increases opportunity but also exposure to transaction costs.
c) Dependency on Technical Analysis
Short-term trading relies heavily on:
Candlestick patterns
Indicators like RSI, MACD, Moving Averages
Volume analysis
Chart patterns (flags, triangles, breakouts)
Fundamentals matter less because the time horizon is too short for fundamentals to play out meaningfully.
d) High Volatility, High Risk
Short-term moves are unpredictable. News, events, and market sentiment can cause sharp fluctuations. A trader must always have:
Strict stop-loss
Risk-per-trade limits
High emotional discipline
e) Capital Requirement
Short-term traders often use margin or leverage, which magnifies both returns and losses.
f) Psychological Stress
Watching charts for hours, handling rapid moves, and managing multiple positions can be mentally taxing.
Advantages of Short-Term Trading
Quick returns
Regular trading opportunities
Can profit in any market condition (up, down, sideways)
Requires less capital for margin-based strategies
Disadvantages of Short-Term Trading
High risk from volatility
Stressful and time-intensive
High brokerage and taxation costs
Probability of emotional mistakes is higher
2. What Is Long-Term Trading (Investing)?
Long-term trading—often called investing—focuses on holding positions for months, years, or decades. Instead of reacting to daily volatility, long-term traders focus on the broader economic and business growth cycles.
Key Characteristics of Long-Term Trading
a) Time Horizon
Investments typically last:
Short long-term: 6 months–2 years
Medium-term: 2–5 years
Long-term: 5–20+ years
This approach allows the investor to benefit from company growth, compounding, and market cycles.
b) Dependence on Fundamental Analysis
Long-term strategies depend on:
Financial statements (balance sheet, P&L, cash flow)
Company management quality
Sector growth
Economic cycles
Competitive advantages (moats)
Charts may be used for entry timing but fundamentals drive the decision.
c) Lower Trading Frequency
Investors may make only a handful of trades in a year, reducing cost and stress.
d) Lower Risk Through Compounding
Over time, markets tend to move upward due to economic growth. Long-term investing benefits from:
Compounding returns
Dividend reinvestment
Reduced volatility impact
e) Stable and Manageable Psychology
Investors don’t need to watch markets daily. Long-term patience and discipline are more important than speed.
Advantages of Long-Term Trading
Lower stress
Lower brokerage and tax costs
Lower chance of emotional errors
Wealth compounding over time
Better suited for salaried individuals or busy professionals
Disadvantages of Long-Term Trading
Slow returns
Requires patience
Market crashes can test conviction
Needs good research on fundamentals
3. Key Differences Between Short-Term and Long-Term Trading
Aspect Short-Term Trading Long-Term Trading
Time Horizon Minutes to weeks Years to decades
Analysis Mostly technical Mostly fundamental
Risk Level High due to volatility Lower due to long time frame
Capital Requirement Often less initially, but risky with leverage Usually requires more capital but safer
Frequency of Trades High Low
Tax Impact Higher (short-term capital gains tax) Lower (long-term capital gains tax)
Skills Needed Chart reading, speed, intraday discipline Business analysis, patience, strategic thinking
Psychological Pressure High Moderate to low
Return Pattern Frequent small profits (or losses) Slow, compounding returns
4. Which One Is Better?
There is no universal answer—it depends on the individual’s personality, risk appetite, and goals.
Short-Term Trading Is Better If You:
Enjoy analyzing charts
Can handle high stress
Want frequent trading opportunities
Can dedicate time daily
Have strict risk discipline
Accept that losses are part of the game
Short-term trading can generate quick profits but also quick losses.
Long-Term Trading Is Better If You:
Prefer stable growth
Don’t want to sit in front of charts
Believe in company fundamentals
Want to benefit from compounding
Are patient and disciplined
Want to build long-term wealth
For most people, long-term investing is safer and more rewarding.
5. Which Approach Do Professionals Use?
Many experienced market participants use a hybrid model:
Long-term portfolio for wealth creation
Short-term portfolio for opportunities during volatility
This allows them to enjoy stability while also taking advantage of short-term market movements.
6. Final Thoughts
Short-term and long-term trading represent two different philosophies. Short-term traders rely on speed, chart-reading skills, and rapid decision-making, accepting volatility as a regular challenge. Long-term investors rely on patience, fundamentals, and the power of compounding, focusing on the broader picture instead of daily price movements.
Both strategies can be profitable if executed correctly. The key is to choose the one that matches your personality, lifestyle, and financial objectives. A disciplined long-term investor can steadily build wealth, while a skilled short-term trader can generate quicker gains—but with higher risk.
Ultimately, the best traders and investors are those who understand themselves just as well as they understand the market.
Trading-signals

Farhan buildIt Works, thats all that matters, working ides/signals for option trading for NIFTY50, NSE
This analysis give you idea for trending patterns

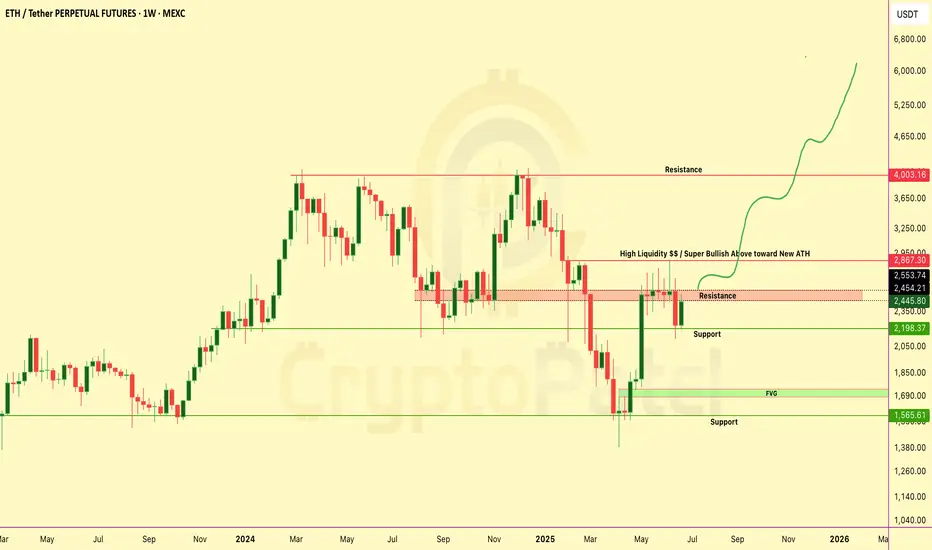
ETHEREUM Weekly Chart Breakdown – Massive Move Loading?ETHEREUM Weekly Chart Breakdown – Massive Move Loading?
ETH just pumped +9.9% this week... but it’s what comes next that really matters 👇
Key Resistance Wall → $2,867
🔹 This zone is packed with liquidity traps and past rejections.
🔹 Break this level = Unlocks ATH push toward $4K–$6K-$10k
Why This Chart Matters:
✅ Bullish structure reclaim
✅ Targeting “High Liquidity” zone above
✅ Possible parabolic rally if breakout confirms
Dips = Opportunities
If ETH dips from here... don’t panic.
→ Every dip = fresh accumulation zone
→ Below $2,000 = golden buy zone for long-term bulls
Liquidity Zone Break it = ATH rally incoming
Reject it = Buy the dip and ride the next wave
Comment & tag a friend who needs this alpha!
NFA & Dyor
WIF Just Flipped Bullish — Is This the Start of the Next Big AltWIF Just Flipped Bullish — Is This the Start of the Next Big Alt Rally?
WIF just bounced hard from the $0.80 demand zone and flipped structure bullish with a clear CHoCH!
Smart Money is back — and they’ve left their footprint.
Here’s What’s Cooking:
🔹 CHoCH Confirmed ✅
🔹 Bullish OB at $0.93–$0.96 respected ✅
🔹 Price aiming for $1.13–$1.42 — major liquidity zones
🔹 This isn’t random. It’s Smart Money accumulation, and the next leg up could be explosive.
⚠️ Don’t chase. Wait for confirmation around $1.13 zone and plan accordingly.
Breakout = 🚀
Rejection = Watch for retest.
High-Probability Play
This chart is loaded with confluences. If you're sleeping on it… you might miss one of the cleanest moves of the week.
📢 ACTION TIME:
✅ Save the chart
✅ Share with your crew
✅ Stay updated — we’re tracking this live
Comment “WIF🔥” if you're watching this move!

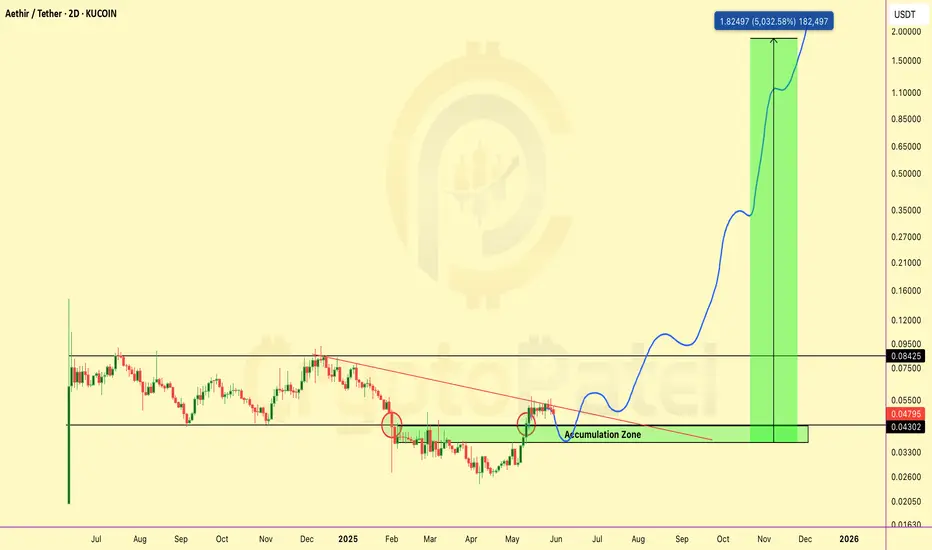
$ATH = AWS of Web3? Backed by Big VCs & Could 50xTSX:ATH = AWS of Web3? Backed by Big VCs & Could 50x
Here’s Why I’m Bullish on #AETHIR 👇
Aethir ( TSX:ATH ) is building a decentralized GPU cloud for AI, gaming, and big compute — imagine AWS on Web3.
And guess what? It’s still early.
Why Aethir is Super Bullish Right Now:
▶️ Massive Use Case – Powers AI, metaverse, & cloud gaming
▶️ Strong Team – Built by blockchain + AI veterans
▶️ Top VC Backing – Hashkey, Sanctor Capital, Merit Circle
▶️ Real Revenue Model – Users pay in TSX:ATH to access GPU power
This isn’t just a token — it’s a working product with real-world demand.
My Long-Term Accumulation Strategy (Not Financial Advice):
▶️ Buying Zone: $0.048–$0.035
▶️ Major Resistance Level: $0.085
▶️ If we break above, next leg could fly.
▶️ Targets I’m Watching: $0.1 → $0.5 → $1 → $2
I’ll add more if price dips hard — I see long-term potential.
This could be one of the biggest infrastructure plays of this bull run.
The kind of project you’ll wish you bought early.
Save this. Come back in 1-2 Years. Let’s see who was early.
🔥 If you found this early alpha valuable:
👍 Like to show love
🔁 Retweet to spread the gem
💬 Comment your TSX:ATH target below
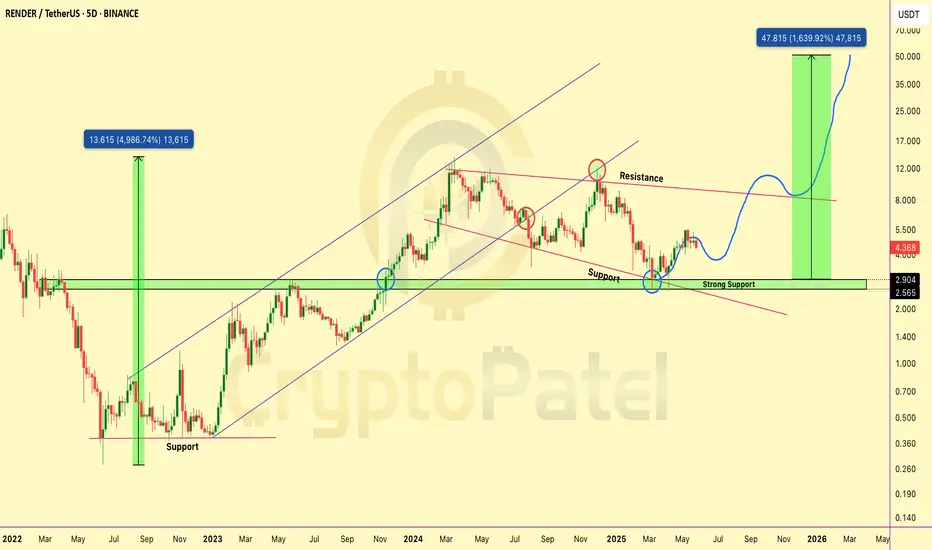
$RENDER Could Be the Next Nvidia of CryptoCRYPTOCAP:RENDER Could Be the Next Nvidia of Crypto
CRYPTOCAP:RENDER is one of the strongest AI projects in crypto right now — and it’s only getting started. The dip you see now?
That’s an accumulation opportunity for long-term believers!
▶️ Best Buy Zone: $4 – $3.40
▶️ Targets: $8.6 / $15 / $25 / $40 / $50
▶️ Strong Support: $2.90 – $2.50
As long as we’re above that — we’re super bullish! ✅
Why CRYPTOCAP:RENDER Can Hit $30–$50 This Cycle:
✅ Solves real problems – powers AI, 3D, VFX, gaming
✅ Trusted by giants – Netflix, Disney, Apple, Unreal Engine
✅ Limited supply + burn = strong tokenomics
✅ On Solana now – faster, cheaper, better
✅ Rides the AI wave – GPU demand is booming
✅ Last cycle = 49x. This time? Bigger stage, bigger vision.
It’s like the Nvidia of Web3 — but decentralized.
👇 If you believe in the future of AI + GPU power…
Keep your eyes on $RENDER. This one’s not just hype.
NFA & DYOR
Bitcoin Ready to Dump Again till $85000?CRYPTOCAP:BTC just tapped a key Short POI near resistance!
Bears stepping in hard below $99,550 — this is prime sniper zone.
▶️ Trade Setup (SMC x ICT):
▶️ Entry: $93,800–94,200
▶️ Targets: $90,000 → $86,000
▶️ Stop Loss: $99,600 (above structure)
Liquidity swept ✅
FVGs below ✅
Momentum shifting ✅

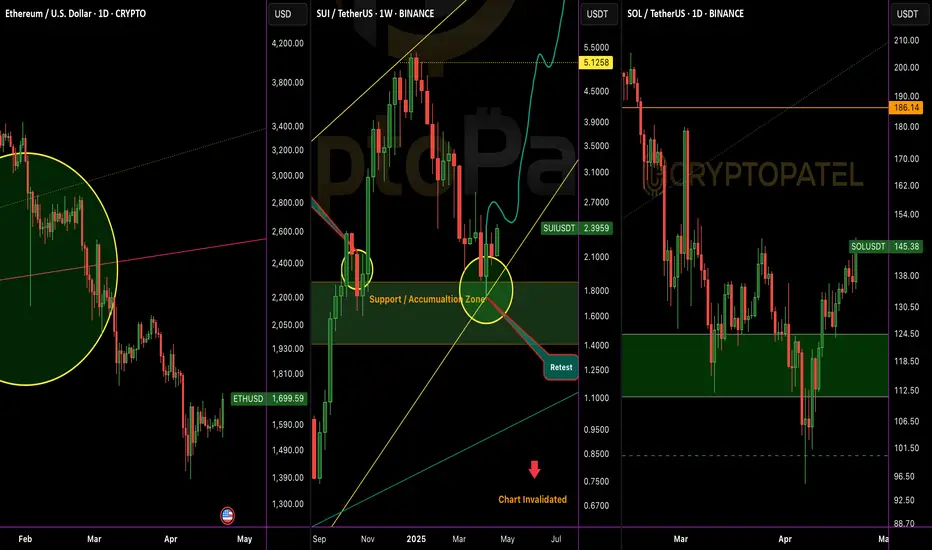
Bitcoin And Altcoins Price Difference🚨 2 months ago, #Bitcoin hit $90K and alts were flying:
CRYPTOCAP:ETH – $2,850
CRYPTOCAP:SUI – $3.50
CRYPTOCAP:SOL – $180
Today, BTC is BACK above $90K… but alts are in the dip!
CRYPTOCAP:ETH – $1,700
CRYPTOCAP:SUI – $2.40
CRYPTOCAP:SOL – $145
Never Forget to Buy at F*** Dip you Planning for Long Run
Bitcoin Ready for New ATH or New LowBitcoin Update:
If Bitcoin Price Break $83000 and 4H Close above then It Turned into Bullish Mode Otherwise Ready for New Low Again....

NZDCHFAs you can see, the price is trading in a swing buy level if you look to the left. The current 4H structure shows that the price has finally made a strong move to the upside after a long consolidation. This indicates that order flow is clear, and there are more buyers present in the market.
I have marked the 4H buy zone and am expecting the price to give me an opportunity to buy from there. There are several targets, but overall, it looks like a textbook setup.
Let’s wait and see. Blessings, T.

Will TRUM coin hit ATH $77 again ?🚨 $TRUMP Coin crashed 79% from its $77 ATH in just 15 days! 🚨
It's now holding at $16, and I expect a bounce to at least $30 soon.
When do you think $TRUMP will hit $77 again?

will bitcoin hit $76000 again ?🚨 If you want to see #Bitcoin hit a new ATH toward $120K-$130K, it must hold the critical $91,600 support level.
Will CRYPTOCAP:BTC hold or break? 🤔
Drop your thoughts below! 👇

Ready for #Bitcoin Dump as per SMC chart Analysis ?Ready for #Bitcoin Dump as per SMC chart Analysis ?
CRYPTOCAP:BTC is trading at $66,000, and I see a Bearish Order Block here—high chances of rejection. If BTC rejects from $66K, we might revisit $63K
Note: If price breaks $66K & any 4H candle closes above $66,250, I'll close my short position.
Support: $63K / $60K
Resistance: $66K

Bitcoin Breakout confirmed so what Next?#Bitcoin Chart Analysis
CRYPTOCAP:BTC has broken TL resistance and is heading towards $66,000. The key resistance level is at $66K—if broken, we could see a new ATH toward $80K!
However, if $66K is rejected, a retracement to $62K is possible.
Resistance: $64K/ $66.3K
Support: $62.5K / $60K
Watch for a 3H/4H close above $66.4K to confirm ATH potential!

Bitcoin Bearish as per SMC Analysis#Bitcoin Update:
IMO, #BTCUSD looks ready for another dump after tapping into the FVG and OB.
Short Area: $63,000 - $63,800
Stop Loss: $64,200
If rejected from the FVG level, the next target is $55,000.

Ethereum Ready to $6000 ?CRYPTOCAP:ETH Chart Update
Next Target: $5500-$6000
Best Accumulation Zone: $2500-$2100
Long Term Target: $8000-$10,000
#Ethereum bounced strongly from the $2100 level (channel support), and with the next resistance at $5500-$6000, I’m expecting the next stop for #ETH to be $6000

LISK Bull Flag AnalysisLSK/USDT Chart Analysis
LSK/USDT is forming a Bull Flag pattern with a breakout and retest already completed. Based on the chart pattern, a significant move is anticipated from here.
Entry: $1.93 - $1.80
Targets:
$2.00
$2.32
$2.75
$3.25
$5.00
Stop-Loss: $1.75 (and a strong stop loss below the red line)
- Ensure proper risk management at all times.
- Happy trading!

Could Altcoins Reach $7 Trillion in this Bull Run? Could Altcoins Reach $7 Trillion in this Bull Run?
Bookmark this post for a streamlined breakdown of the #altcoin market cap trend:
1️⃣ Breakout: The market cap has breached a critical resistance, hinting at a bullish onset ( Black TrendLine )
2️⃣ Skyrocket Post-Retest: Expect a sharp rise after the market retests the newfound support level.
3️⃣ Awaiting Retest (Green Box): We're currently watching for a dip back to the retest level, a pivotal moment for trend confirmation.
4️⃣ Potential $7T Market Cap: Following historical patterns, altcoins could reach a $7 trillion market cap in this bull run.

EUR/USD: Stronger discounts continue!Hello dear friends! What do you think about the current trend of EURUSD?
Today, EURUSD continues to decline, seemingly trying to gather strength to bounce back as the US dollar strengthens for the third consecutive day.
Currently trading near the 1.0849 level, a quick look at the technical analysis chart shows that the downward momentum is still leading. As a result, breaking below the support level of 1.0871 has solidified the case for implementing a selling strategy.
I am watching the 1.0800 level as the next stop, especially if the support level of 1.085 continues to crumble. What about you? What is your prediction for this currency pair?

Bank Nifty Ready for Dump After Small Pump?#BankNifty PM Election View:
2019 PM Election of India:
- Bank Nifty 29% Pump from Parallar Channel Support.
- -50% Dump from Parallel Channel Resistance After PM Election.
2024 PM Election of India:
- Bank Nifty Can Pump 20% from Parallel Channel Support
- After We can See -40% dump from Parallel Channel Resistance
#Breakout #StockMarket

BONK/USDT Ready for Another -60% Dump?$BONK has dropped -71% within a Month After Binance Listing.
Now, if it doesn`t hold this support Level $0.000010
then it could fall another -60%
➡️#BONK Pumped 21x within 2 months.
➡️Now -71% Dumped within a Month.
➡️Still 6000% up from October Bottom.

Bitcoin ( $BTC ) Surges Past $45,000 for First Time Since April Bitcoin ( CRYPTOCAP:BTC ) Surges Past $45,000 for First Time Since April 2022!
In the early hours of the day, Bitcoin's price surpassed $45,000 for the first time since April 2022, driven by expectations of a U.S. Securities and Exchange Commission ( #SEC ) approval for a spot Bitcoin exchange-traded fund (ETF).
Are you ready for the next wave of crypto growth?
Strong Resistance: $48600-$50600
#Bitcoin #Crypto #ETF #BitcoinETF
