XAUUSD – Correction Target on H4Technical Analysis
After reacting at the Sell Zone – FVG around 3,670, Gold could not sustain the upward momentum and is now showing signs of weakness. The H4 structure indicates that the correction phase is extending, with price likely to retest key support areas below.
On the chart, the support zones at 3,633–3,632 and 3,626 are acting as intermediate levels. If these zones fail to hold, selling pressure may push price deeper towards 3,614–3,612, before testing the major support confluence with Fibonacci extension and the potential Buy Zone at 3,579–3,560.
The RSI is currently hovering around 45–50, suggesting momentum is tilted towards a corrective move rather than a strong uptrend.
Trading Scenarios
SELL Setup (preferred):
Entry: on a retest of the 3,665–3,670 Sell Zone
SL: above 3,675
Targets: 3,633–3,632-3,626-3,614–3,612-3,579–3,560
BUY Setup (short-term / scalping):
Entry: consider buys around 3,626–3,625 support
SL: below 3,618
Targets:3,633-3,645-3,650
Key Levels to Watch
3,670: Sell Zone – confluence with FVG post-FOMC.
3,633–3,626: Short-term support; a break below confirms extended bearish pressure.
3,612: Key level for deciding near-term direction.
3,579–3,560: Potential Buy Zone and main corrective target on H4.
Traders may keep these levels on watch and align positions accordingly. Follow for quicker access to future updates.
Trading

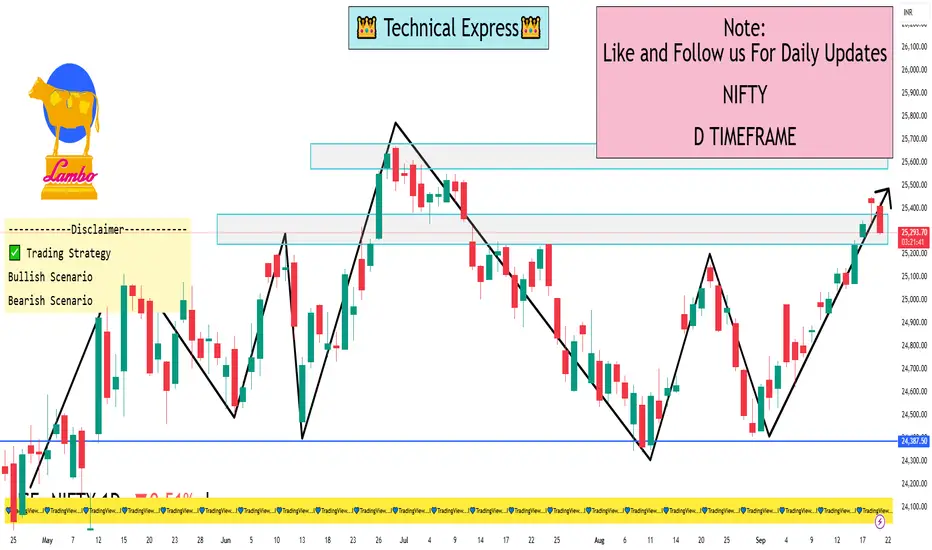
Nifty 50 1 Day View📊 Key Levels for Nifty 50 (Daily Timeframe)
Resistance Levels:
R1: 25,471.52
R2: 25,519.43
R3: 25,590.32
Support Levels:
S1: 25,352.72
S2: 25,281.83
S3: 25,233.92
These levels are derived from classic pivot point calculations based on the previous day's price range.
🔄 Trend Analysis
Short-Term Trend: The Nifty 50 has formed a higher top and higher bottom pattern on the daily chart, indicating a bullish trend.
Moving Averages: The index is trading above its 20, 50, 100, and 200-day moving averages, suggesting a bullish momentum.
⚠️ Market Sentiment
Despite the positive technical indicators, the SGX Nifty (Gift Nifty) is showing signs of a negative start, which may influence the market's direction at the open.
✅ Trading Strategy
Bullish Scenario: A sustained move above 25,500 could lead to a retest of the June high at 25,669.
Bearish Scenario: A decline below 25,350 may signal a short-term correction.
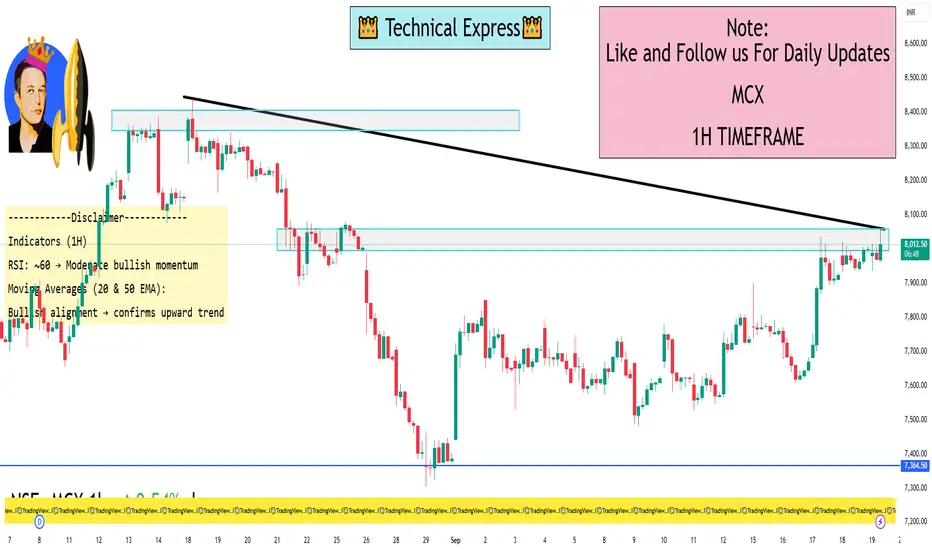
MCX 1 Hour ViewMCX 1-Hour Time Frame Levels (Structured View)
Current Price: ₹8,550 (as of 19th Sep 2025, 11:36 AM IST)
Trend Analysis (1H):
Short-term: Slightly bullish
Price action: Higher highs and higher lows in an upward channel
Key Levels:
Support Levels:
₹8,400 – Major intraday support
₹8,300 – Strong support for potential bounce
Resistance Levels:
₹8,650 – First intraday resistance
₹8,750 – Strong resistance, breakout confirmation above this
Indicators:
RSI (1H): ~60 → Moderate bullish momentum
Moving Averages (1H):
MA 20 above MA 50 → Supports bullish trend
MA alignment confirms upward momentum
Intraday Trading Notes:
Watch price reaction at ₹8,400 and ₹8,650 for reversal or breakout setups
Candlestick patterns near support/resistance levels can indicate entry/exit
Keep an eye on broader market news affecting commodities
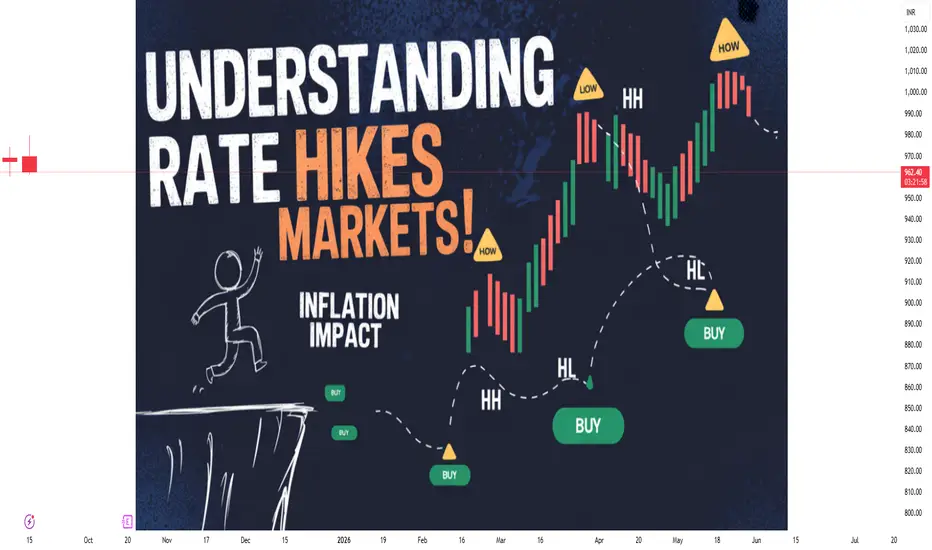
Rate Hikes: Interest Rates vs. Inflation1. Introduction: The Relationship Between Interest Rates and Inflation
At its core, inflation refers to the sustained rise in the general price level of goods and services in an economy over time. When prices rise faster than incomes, purchasing power declines, impacting consumers, businesses, and investors.
Interest rates, on the other hand, represent the cost of borrowing money or the reward for saving. Central banks, like the Federal Reserve (US), Reserve Bank of India (RBI), or European Central Bank (ECB), manipulate policy interest rates to influence economic activity.
Key relationship:
When inflation rises beyond the central bank’s target, interest rates are often increased (a process called a “rate hike”) to curb spending and borrowing.
Conversely, during periods of low inflation or deflation, central banks may lower interest rates to stimulate demand.
2. How Central Banks Use Rate Hikes to Control Inflation
2.1 The Mechanism of Monetary Policy
Central banks influence inflation primarily through monetary policy tools. Rate hikes are part of tightening monetary policy, which affects the economy in several ways:
Borrowing Costs Increase: Higher interest rates make loans for businesses and consumers more expensive. This reduces spending on big-ticket items like houses, cars, and capital investments.
Savings Become Attractive: As banks offer higher returns on deposits, consumers may save more and spend less, reducing aggregate demand.
Currency Appreciation: Higher rates often attract foreign capital, strengthening the domestic currency. A stronger currency makes imports cheaper, which can reduce imported inflation.
Expectations Management: Rate hikes signal the central bank’s commitment to controlling inflation, which can influence wage negotiations, business pricing decisions, and consumer behavior.
2.2 Transmission Mechanism
The impact of rate hikes on inflation is not instantaneous. It passes through the economy via the interest rate transmission mechanism, which works through:
Credit channel: Expensive credit discourages borrowing.
Asset price channel: Rising rates reduce stock and real estate valuations, leading to lower wealth effect and reduced spending.
Exchange rate channel: Higher rates attract capital inflows, boosting the currency, reducing import costs, and easing inflation.
Typically, the full impact of a rate hike is observed over 12–24 months.
3. Types of Inflation and Rate Hikes
Not all inflation is the same, and the effectiveness of interest rate hikes depends on the source of inflation:
3.1 Demand-Pull Inflation
Occurs when aggregate demand exceeds supply.
Example: Booming economy with high consumer spending.
Rate hike effect: Very effective, as higher borrowing costs reduce spending.
3.2 Cost-Push Inflation
Occurs when production costs rise, e.g., due to higher wages, oil prices, or supply chain disruptions.
Rate hike effect: Less effective, as inflation is supply-driven rather than demand-driven.
3.3 Built-in Inflation
Caused by adaptive expectations, where past inflation influences future wage and price increases.
Rate hike effect: Moderate, but signaling by the central bank can anchor inflation expectations.
4. Historical Perspective on Rate Hikes and Inflation
Studying historical trends helps illustrate how interest rate adjustments influence inflation:
4.1 US Experience
1970s: Stagflation with double-digit inflation. The Fed raised rates sharply under Paul Volcker, with the federal funds rate peaking at ~20%. Inflation eventually came under control, but the economy experienced a severe recession.
2000s–2020s: Post-2008 financial crisis, rates were near zero to stimulate the economy. Inflation remained low, demonstrating that low rates don’t always trigger high inflation if other conditions (like excess capacity) persist.
4.2 Indian Experience
RBI uses repo rates to manage inflation, targeting CPI (Consumer Price Index) inflation around 4% ±2%.
Example: During 2010–2013, high food and fuel inflation prompted the RBI to raise repo rates to curb prices, stabilizing inflation over time.
4.3 Emerging Markets
Rate hikes in emerging markets often have the dual objective of controlling inflation and maintaining currency stability.
Over-tightening can trigger slowdowns, especially in economies with high debt levels.
5. Rate Hikes vs. Economic Growth
While rate hikes are effective in controlling inflation, they have trade-offs:
5.1 Impact on Investment
Higher borrowing costs reduce business investments in new projects.
Stock markets often react negatively, especially for high-debt sectors.
5.2 Impact on Consumers
Loans (housing, education, personal loans) become more expensive, reducing disposable income.
Luxury and discretionary spending decline.
5.3 Risk of Recession
Aggressive rate hikes can slow the economy too much, leading to contraction.
Policymakers must balance inflation control with growth sustainability.
6. Rate Hikes and Financial Markets
Financial markets react dynamically to rate hikes:
6.1 Stock Markets
Typically, rate hikes are bearish for equities as corporate profits may decline due to higher financing costs.
Growth stocks (tech) are more sensitive than value stocks.
6.2 Bond Markets
Bond prices fall as yields rise.
Investors shift to shorter-duration bonds during rate hike cycles.
6.3 Forex Markets
Domestic currency tends to strengthen as higher rates attract foreign capital.
This can impact export competitiveness but reduce import-driven inflation.
6.4 Commodities
Commodities priced in USD may decline as stronger currency reduces local demand.
Gold often falls during rate hikes because it doesn’t yield interest.
7. Rate Hikes in a Global Context
Interest rate policy in one country can influence others:
7.1 Spillover Effects
Higher US rates often lead to capital outflows from emerging markets.
Countries may raise rates in tandem to protect their currency and control inflation.
7.2 Global Inflation Trends
Oil prices, supply chain disruptions, and geopolitical events can override local rate hikes.
Central banks must consider global factors while adjusting rates.
8. Challenges in Managing Inflation Through Rate Hikes
8.1 Lag Effect
Monetary policy effects are delayed; policymakers often act based on inflation expectations rather than current data.
8.2 Supply-Side Constraints
Rate hikes cannot solve inflation caused by supply shortages or geopolitical disruptions.
8.3 Debt Burden
Economies with high corporate or household debt may be more sensitive to rate hikes, risking defaults.
8.4 Policy Communication
Miscommunication can destabilize markets. Clear forward guidance is crucial.
Conclusion
Interest rates and inflation are intricately linked. Rate hikes are a powerful tool to control inflation, but they come with trade-offs for growth, investment, and financial markets.
Key takeaways:
Rate hikes reduce demand and curb inflation but may slow growth.
Demand-pull inflation responds better to rate hikes than supply-driven inflation.
Timing, magnitude, and communication of rate hikes are crucial.
Global interdependencies mean domestic rate policy must consider international factors.
Investors and traders must adapt strategies in response to rate hikes, balancing risk and opportunity.
Ultimately, the goal of rate hikes is stability—stable prices, sustainable growth, and predictable financial markets. Policymakers walk a delicate tightrope, balancing inflation control with the need to foster economic activity, making the study of interest rates versus inflation an essential part of modern finance and economics.
Event-Driven Trading: Strategies Around Quarterly Earnings1. Understanding Event-Driven Trading
Event-driven trading refers to strategies that seek to exploit short-term price movements caused by corporate or macroeconomic events. These events can include mergers and acquisitions (M&A), regulatory announcements, dividend announcements, product launches, and, most notably, quarterly earnings reports. Event-driven traders operate on the principle that markets do not always price in the full implications of upcoming news, creating opportunities for alpha generation.
Earnings announcements are particularly potent because they provide concrete, quantifiable data on a company’s financial health, guiding investor expectations for revenue, profit margins, cash flow, and future outlook. Given the structured release schedule of quarterly earnings, traders can plan their strategies in advance, combining statistical, fundamental, and technical analyses.
2. Anatomy of Quarterly Earnings Reports
Quarterly earnings reports typically contain several key components:
Revenue and Earnings Per Share (EPS): Core indicators of company performance. Earnings surprises—positive or negative—often trigger substantial stock price moves.
Guidance: Management projections for future performance can influence market sentiment.
Margins: Gross, operating, and net margins indicate operational efficiency.
Cash Flow and Balance Sheet Metrics: Provide insight into liquidity, debt levels, and overall financial health.
Management Commentary: Offers qualitative insights into business strategy, risks, and opportunities.
Understanding these elements is critical for traders seeking to anticipate market reactions. Historically, stocks tend to exhibit heightened volatility during earnings releases, creating both opportunities and risks for traders.
3. Market Reaction to Earnings
The stock market often reacts swiftly to earnings announcements, with price movements reflecting the degree to which actual results differ from expectations. The reaction is influenced by several factors:
Earnings Surprise: The difference between actual earnings and analyst consensus. Positive surprises often lead to price spikes, while negative surprises can trigger sharp declines.
Guidance Changes: Upward or downward revisions to guidance significantly impact investor sentiment.
Sector Trends: A company’s performance relative to industry peers can amplify market reactions.
Market Conditions: Broader economic indicators and market sentiment affect the magnitude of earnings-driven price movements.
Traders must understand that markets may overreact or underreact initially, presenting opportunities for both short-term and medium-term trades.
4. Event-Driven Trading Strategies Around Earnings
4.1 Pre-Earnings Strategies
Objective: Position the portfolio ahead of anticipated earnings to profit from expected price movements.
Straddle/Strangle Options Strategy
Buy both call and put options with the same expiration (straddle) or different strike prices (strangle).
Profitable when stock exhibits significant volatility regardless of direction.
Works well when implied volatility is lower than expected post-earnings movement.
Directional Bets
Traders with conviction about earnings outcomes may take long or short positions in anticipation of the report.
Requires robust fundamental analysis and sector insights.
Pairs Trading
Involves taking offsetting positions in correlated stocks within the same sector.
Reduces market risk while exploiting relative performance during earnings season.
4.2 Post-Earnings Strategies
Objective: React to market inefficiencies created by unexpected earnings results.
Earnings Drift Strategy
Stocks that beat earnings expectations often continue to trend upward in the days following the announcement, known as the “post-earnings announcement drift.”
Conversely, negative surprises may lead to sustained declines.
Traders can exploit these trends using momentum-based techniques.
Volatility Arbitrage
Earnings reports increase implied volatility in options pricing.
Traders can exploit discrepancies between expected and actual volatility post-announcement.
Fade the Initial Reaction
Sometimes markets overreact to earnings news.
Traders take contrarian positions against extreme initial moves, anticipating a correction.
5. Analytical Tools and Techniques
Successful event-driven trading relies heavily on data, models, and analytical frameworks.
5.1 Fundamental Analysis
Study revenue, EPS, margins, guidance, and sector performance.
Compare against historical data and analyst consensus.
Evaluate macroeconomic factors affecting the company.
5.2 Technical Analysis
Identify key support and resistance levels.
Use indicators like Bollinger Bands, RSI, and moving averages to gauge price momentum pre- and post-earnings.
5.3 Sentiment Analysis
Monitor social media, news releases, and analyst reports for market sentiment.
Positive sentiment can amplify price moves, while negative sentiment can exacerbate declines.
5.4 Quantitative Models
Statistical models can predict probability of earnings surprises and subsequent price movements.
Machine learning algorithms are increasingly used to forecast earnings-driven volatility and trade outcomes.
6. Risk Management in Earnings Trading
Event-driven trading carries elevated risk due to volatility and uncertainty. Effective risk management strategies include:
Position Sizing
Limit exposure per trade to manage potential losses from unexpected moves.
Stop-Loss Orders
Predefined exit points prevent catastrophic losses.
Diversification
Spread trades across sectors or asset classes to reduce idiosyncratic risk.
Hedging
Use options or futures contracts to offset directional risk.
Liquidity Assessment
Ensure sufficient market liquidity to enter and exit positions without excessive slippage.
Conclusion
Event-driven trading around quarterly earnings offers substantial opportunities for informed traders. By combining fundamental analysis, technical tools, options strategies, and disciplined risk management, traders can capitalize on the predictable yet volatile nature of earnings season. While challenges exist, a structured and strategic approach allows market participants to profit from both anticipated and unexpected outcomes.
The key to success lies in preparation, flexibility, and understanding market psychology. Traders who master earnings-driven strategies can achieve consistent performance, turning periodic corporate disclosures into actionable investment opportunities.
XAUUSD –Today’s Trading Outlook | Sell Fill Liquidity & Buy Zone
Hello traders,
In the recent sessions, gold has continued to show strong volatility around important liquidity zones and support–resistance levels. The current structure indicates that sellers remain in control in the short term, while buyers are expected to return only if price reaches deeper support areas.
Technical View
Main Resistance: 3670 – 3680, aligning with the FVG zone → key area for Sell to Fill Liquidity.
Short-term Support: 3630 – 3627. A break below could open the way for a deeper decline.
Buy Scalping Zones: 3613 – 3615 and 3595 – 3598, suitable for quick intraday longs.
Medium-term Buy Zone: 3600 – 3590, confluence with strong liquidity zone and major support.
MACD Indicator: leaning bearish, with a negative histogram, showing selling pressure still dominant.
Trading Scenarios
Sell Setup (priority)
Sell Liquidity Zone: 3670 – 3680
SL: 3685
TP: 3650 – 3635 – 3627 – 3615 – 3600
Buy Scalping
Buy Zone 1: 3613 – 3615 | SL: 3608 | TP: 3625 – 3638 – 3645
Buy Zone 2: 3595 – 3598 | SL: 3590 | TP: 3610 – 3625 – 3638 – 3645 – 3670
Medium-term Buy
Zone: 3600 – 3590
SL: 3584
Extended TP: 3633 – 3660 – 3675
Conclusion
In the short term, gold is likely to retest the upper liquidity zone before continuing with further declines. Sellers remain in control for now, but deeper support zones will provide potential entry levels for medium-term buyers.
Keep a close watch on these key levels and align your trades with your personal strategy.
Follow along to get the earliest updates whenever market structure changes.

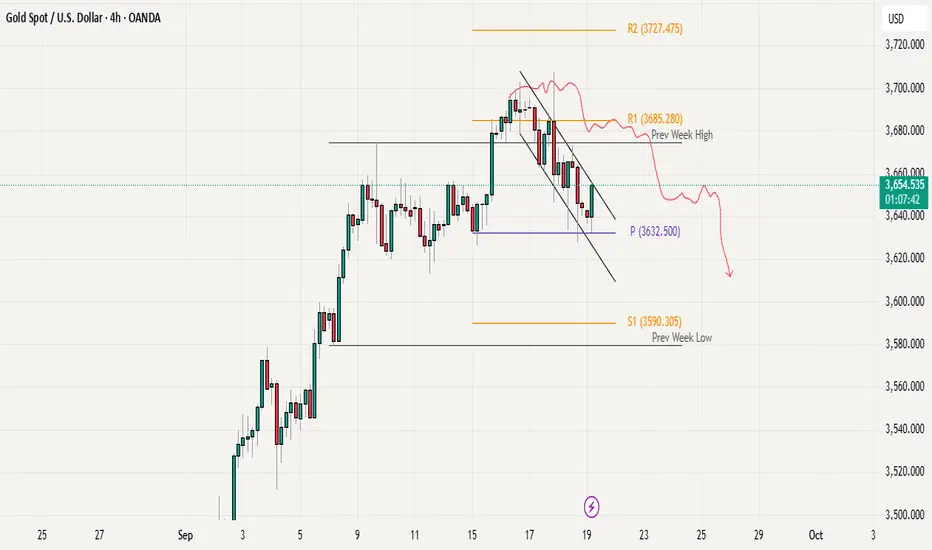
Gold Intraday Analysis: Range Play Until BreakoutGold is currently trading in a range-bound structure after pulling back from the 3700 level. The weekly pivot around 3632 is acting as strong support, while the 3700 zone serves as resistance, forming the upper boundary of the range. Price is showing signs of consolidation between these levels, suggesting a sideways market. For any breakout confirmation, we need to see a clear H1 or H4 candle close above 3700 or below 3632, along with volume or strong price rejection/follow-through. Until then, the price action favors range trading within these key levels.
Part 1 Trading Master Class With Experts1. Introduction to Options
Financial markets give investors multiple tools to manage money, speculate on price movements, or hedge risks. Among these tools, options stand out as one of the most powerful instruments. Options are a type of derivative contract, which means their value is derived from an underlying asset—such as stocks, indices, commodities, or currencies.
Think of an option like a ticket. A movie ticket gives you the right to enter a cinema hall at a fixed time, but you don’t have to go if you don’t want to. Similarly, an option contract gives you the right, but not the obligation, to buy or sell an asset at a pre-decided price before or on a fixed date.
This flexibility is what makes options both exciting and risky. For beginners, it can feel confusing, but once you grasp the basics, option trading becomes a fascinating world of opportunities.
2. Basic Concepts of Option Trading
At its core, option trading revolves around three elements:
The Buyer (Holder): Pays money (premium) to buy the option contract. They have rights but no obligations.
The Seller (Writer): Receives the premium for selling the option but must fulfill the obligation if the buyer exercises it.
The Contract: Specifies the underlying asset, strike price, expiry date, and type of option (Call or Put).
Unlike stocks, where you directly buy shares of a company, in options you are buying a right to trade shares at a fixed price. This difference is what gives options their unique power.
3. Types of Options
There are mainly two types of options:
3.1 Call Option
A Call Option gives the buyer the right (but not obligation) to buy an underlying asset at a fixed price before expiry.
👉 Example: You buy a call option on Reliance at ₹2,500 strike price. If Reliance rises to ₹2,700, you can buy it at ₹2,500 and immediately gain profit.
3.2 Put Option
A Put Option gives the buyer the right (but not obligation) to sell an asset at a fixed price before expiry.
👉 Example: You buy a put option on Infosys at ₹1,500. If Infosys falls to ₹1,300, you can sell it at ₹1,500, making profit.
These two simple instruments form the foundation of all option strategies.
4. Key Option Terminology
Before trading, you must understand the language of options.
Strike Price: The fixed price at which the option can be exercised.
Premium: The cost of buying an option. Paid upfront by the buyer.
Expiry Date: The last date until the option is valid. In India, stock options usually expire monthly, while index options may expire weekly.
In-the-Money (ITM): Option that already has intrinsic value (profitable if exercised).
Out-of-the-Money (OTM): Option that currently has no intrinsic value (not profitable if exercised).
At-the-Money (ATM): Strike price is very close to the market price.
Option Chain: A list of all available call and put options for a given asset, strike, and expiry.
Knowing these terms is like learning alphabets before writing sentences.

XAUUSD – Medium-Term Outlook After Fed Rate CutXAUUSD – Medium-Term Outlook After Fed Rate Cut
Hello fellow traders,
The most anticipated event of September is now clear: the Federal Reserve has cut interest rates by 25 basis points, the first reduction this year. Market expectations also indicate the possibility of another 50 basis points cut in the upcoming meeting. In his speech, Chairman Powell highlighted the “dual risk” – inflation could rise further while employment shows signs of weakness.
Technical View
Gold has formed an H1 candle closing below the rising price channel, signalling a possible violation of the medium-term uptrend.
The buying side failed to maintain momentum after the rate cut news, showing caution in entering at elevated price levels.
Medium-term investors may consider waiting for a lower price to enter fresh longs.
However, the downside is not fully confirmed, as price is still hovering around the ascending trendline → selling directly at current levels still carries certain risks.
Trading Scenarios
Sell Strategy
Scalping: 3676 – 3678 | SL: 3683 | TP: 3666 – 3650 – 3635 – 3628
(Stop loss can be moved to breakeven if price reacts well, to hold positions longer).
Sell Zone: 3697 – 3700 | SL: 3705 | TP: 3680 – 3666 – 3650 – 3635 – 3628
Buy Strategy
Scalping: 3634 – 3636 | SL: 3629 | TP: 3645 – 3660 – 3672
Buy Zone: 3600 – 3598 | SL: 3590 | TP: 3633 – 3645 – 3660 – 3675 (extended)
Conclusion
Gold is currently in a sensitive phase after the Fed’s decision to cut rates. Traders must watch price action carefully around major support and resistance levels to confirm a clearer direction.
Stay tuned to this outlook — I will continue to provide updates as the market structure evolves. Follow along to receive the fastest scenario changes as price action develops.

LiamTrading – XAUUSD: A New Trend EmergingHello traders, gold has just formed a new structure as it began a sharp correction following Chairman Powell’s announcement of a Fed rate cut. On the H1 chart, a clear bearish Dow structure is developing, indicating potential medium-term sustainability.
Most buy-side liquidity has already been cleared, which makes the chances of a strong recovery quite low – except for a brief FVG right after the news. However, given overall market sentiment, trading activity in that phase was not significant. The gap formation signals that sellers are now confident in taking control after the Fed’s statement.
The current decline could push gold towards the 363x region, and possibly as far as 361x. A key confirmation level remains at the strong support of 3651, where price previously bounced more than 20 dollars immediately after the news.
Trading plan for today:
Sell 3656 – 3659, SL 3666, TP 3651 – 3646 – 3638 – 3634 – 3626 – 3615
Buy 3634 – 3632, SL 3628, TP 3640 – 3652 – 3660
Buy zone 3607 – 3604, SL 3600, TP 3616 – 3625 – 3638 – 3647 – 3660
This is my personal outlook on XAUUSD for today – use it as a reference for your own trading decisions. If you find this analysis helpful, do follow me for more gold trading scenarios and daily insights.

Options Greeks & Advanced Hedging Strategies1. Introduction to Options
Options are derivative instruments that provide the right, but not the obligation, to buy or sell an underlying asset at a predetermined price before or on a specified expiry date. There are two main types:
Call Options – Give the holder the right to buy the underlying asset.
Put Options – Give the holder the right to sell the underlying asset.
Unlike equities, options are inherently more complex because their value is influenced by multiple variables such as underlying price, strike price, time to expiration, volatility, interest rates, and dividends. This multidimensionality is captured by the Greeks, which form the backbone of options risk management.
2. Understanding Options Greeks
The Greeks quantify the sensitivity of an option’s price to various market factors. They are indispensable for assessing risk and structuring trades. The primary Greeks are Delta, Gamma, Theta, Vega, and Rho, each serving a specific purpose.
2.1 Delta (Δ) – Price Sensitivity
Delta measures the rate of change of an option's price with respect to the price movement of the underlying asset.
Call Delta ranges from 0 to 1.
Put Delta ranges from -1 to 0.
Interpretation:
A delta of 0.6 for a call option indicates that if the underlying asset moves up by ₹1, the call option price will increase by ₹0.60.
Traders use delta to gauge the directional exposure of their portfolio, often referred to as delta exposure.
Delta Hedging:
Delta hedging is a strategy where traders neutralize the delta of a position by taking an offsetting position in the underlying asset. For example, if you hold a call option with a delta of 0.6 on 100 shares, you can short 60 shares of the underlying to make the position delta-neutral.
2.2 Gamma (Γ) – Rate of Change of Delta
Gamma measures the rate of change of delta with respect to changes in the underlying asset price.
High Gamma indicates that delta changes rapidly with underlying price movement.
Low Gamma implies delta is stable.
Importance of Gamma:
Gamma is crucial for understanding convexity risk, especially near the option’s expiry or at-the-money options.
Traders use gamma to anticipate how delta hedges will change as the market moves.
Gamma Hedging:
Gamma hedging involves balancing a portfolio such that it remains neutral to delta changes. Typically, it requires frequent adjustments because gamma fluctuates as underlying prices move.
2.3 Theta (Θ) – Time Decay
Theta represents the rate at which an option loses value as time passes, holding other factors constant.
Options are decaying assets, losing value every day due to time erosion.
Call and put options experience negative theta for holders (long positions) and positive theta for writers (short positions).
Applications:
Long options traders must account for theta decay, especially in volatile markets.
Strategies like calendar spreads or selling options exploit theta decay to generate income.
2.4 Vega (ν) – Volatility Sensitivity
Vega measures an option’s sensitivity to changes in implied volatility of the underlying asset.
Options prices increase with higher volatility (for both calls and puts).
Vega is higher for at-the-money options and long-dated options.
Volatility Trading:
Traders can take positions purely on expected volatility changes without relying on directional movement.
Long Vega positions profit from volatility spikes, while short Vega strategies benefit from declining volatility.
2.5 Rho (ρ) – Interest Rate Sensitivity
Rho measures sensitivity to changes in the risk-free interest rate.
More significant for long-term options.
A call option’s price rises with increasing interest rates, while put options decline.
Practical Relevance:
Rho is relatively minor compared to delta or vega but becomes crucial in macroeconomic shifts, especially for options with long maturities.
3. Combining Greeks for Portfolio Management
While each Greek provides specific insights, professional traders consider multiple Greeks simultaneously to manage comprehensive risk. This multidimensional approach allows traders to:
Maintain delta neutrality – minimize directional risk.
Control gamma exposure – manage rapid changes in delta.
Optimize theta decay – benefit from time erosion.
Manage vega risk – protect against volatility shocks.
Monitor rho impact – for long-term interest-sensitive trades.
Example:
A trader holding a long call may delta-hedge by shorting the underlying. If gamma is high, the hedge needs frequent adjustments. Additionally, they must consider theta decay, particularly if the position is near expiry.
4. Advanced Hedging Strategies
Hedging with options is a way to protect portfolios from adverse movements while retaining profit potential. Advanced hedging strategies involve using combinations of options, futures, and the underlying asset.
4.1 Delta Neutral Hedging
Objective: Make a portfolio insensitive to small price movements.
Method: Offset delta of options with underlying asset or other derivatives.
Example: Long call delta of 0.6 → Short 60 shares of the underlying.
Advantages:
Reduces directional risk.
Can be dynamically adjusted to changing deltas.
Limitations:
Frequent rebalancing is required due to gamma exposure.
4.2 Gamma Scalping
Objective: Profit from price swings in the underlying asset while remaining delta neutral.
Method: Buy options with high gamma. As underlying moves, delta changes are hedged dynamically, locking in profits from volatility.
Applications: Used by market makers and professional traders to extract profit from intraday volatility.
4.3 Vega Hedging
Objective: Neutralize exposure to volatility changes.
Method: Offset vega by taking positions in options with opposite volatility sensitivity (e.g., long a call and short a call with different strike prices or maturities).
Applications: Useful during earnings announcements, geopolitical events, or expected market turbulence.
4.4 Calendar and Diagonal Spreads
Calendar Spread: Buy a long-dated option and sell a short-dated option of the same strike.
Diagonal Spread: Combine different strikes and expiries.
Purpose: Exploit theta decay and volatility differences while limiting directional risk.
Example: A trader expecting stable markets but rising volatility may buy a long-term call and sell a near-term call.
4.5 Protective Puts & Collars
Protective Put: Buying a put option to safeguard a long stock position.
Collar: Combining a protective put with a covered call to limit downside while capping upside.
Applications: Hedging large equity positions during uncertain markets.
4.6 Ratio & Backspread Strategies
Ratio Spread: Buy/sell unequal number of options to balance cost and risk.
Backspread: Sell a small number of near-term options and buy a larger number of far-term options.
Use Case: Profitable in high volatility expectations, providing leveraged exposure with hedged downside.
5. Greeks-Based Risk Management
A sophisticated options trader actively monitors Greeks to:
Adjust positions dynamically – react to price, time, and volatility changes.
Measure risk-reward tradeoffs – understand potential loss in extreme scenarios.
Stress-test portfolios – simulate scenarios like sharp price jumps or volatility spikes.
Optimize hedging costs – reduce capital expenditure while maintaining protection.
Conclusion
Options Greeks are the foundation for advanced options trading and risk management. Understanding delta, gamma, theta, vega, and rho enables traders to quantify risk, structure trades, and implement sophisticated hedging strategies. By combining these metrics with advanced approaches like delta neutral hedging, gamma scalping, vega hedging, spreads, and collars, traders can protect portfolios against adverse movements while seizing opportunities in volatile markets.
For Indian traders, these strategies are highly relevant in indices like Nifty, Bank Nifty, and sectoral options, as well as in individual stocks. Mastery of Greeks and hedging not only enhances risk management but also opens avenues for strategic income generation, volatility trading, and portfolio optimization.
In an increasingly complex and volatile market environment, leveraging Options Greeks and advanced hedging strategies is no longer optional—it is essential for any serious options trader aiming for consistent, risk-adjusted returns.
LiamTrading – XAUUSD OutlookSharing my personal view on the possible next move for gold.
Based on the current chart structure, the wave formation suggests that XAUUSD is most likely in Wave 4. The correction started yesterday after price touched the 3,700 mark – a round resistance level which also coincides with the 1.618 Fibonacci extension. This area often attracts heavy liquidity, and the subsequent pullback further supports the view that Wave 4 has been activated.
At present, the key support to watch is 3,675. If this level breaks, the corrective structure could complete around 3,656. On the H1 timeframe, the RSI has moved below the 30 level, indicating oversold conditions. In my view, while the market remains in this phase, it is still preferable to look for selling opportunities, though patience is needed until clearer confluence signals appear.
Trading plan (short-term focus):
Sell entry 3685–3687, SL 3693, TP 3670 – 3656
Buy entry 3656–3654, SL 3648, TP 3675 – 3690 – 3702 – 3721 – 3740
I will continue to share further updates if there are significant moves in price. Wishing everyone successful and effective trading.

Buy, Sell or Skip? Read Breakouts and VolumesExplore how to judge breakouts using TradingView's bar replay, leveraging 3-month-old charts and price action principles that apply from 5-min to monthly timeframes. Sharpen your technical edge—educational insights only.
Disclaimer: This content is for educational purposes and not financial advice. Always do your own research before making trading decisions.

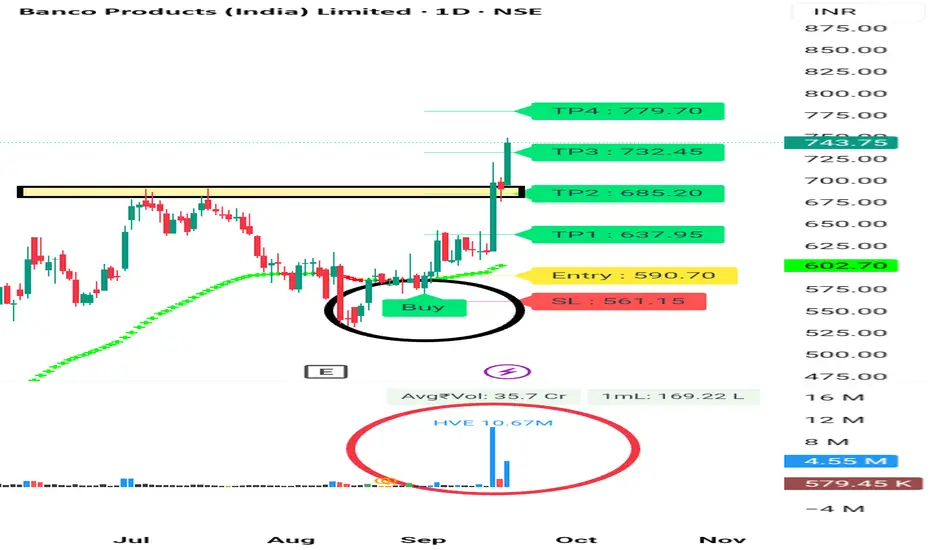
Breakout Stock For Swing Trading Banco india is a very good stock in his secret. It's given breakout with high volume.
It's looking good for Swing trading tgt 5 -8%
SL 5% . then Trail SL.
It's given good breakout.
You can Visit my Tradingview Profile for more information.
Consult your financial advisor before making any position in stock market.
PCR Tradng StrategiesTypes of Options Strategies
Options strategies can be classified based on complexity and purpose:
A. Basic (Beginner) Strategies
Covered Call
Protective Put
Long Call / Long Put
B. Intermediate Strategies
Bull Call Spread
Bear Put Spread
Collar Strategy
Straddle and Strangle
C. Advanced (Professional) Strategies
Butterfly Spread
Iron Condor
Calendar Spread
Ratio Spreads
Diagonal Spreads
Each of these strategies has its own setup, payoff diagram, and risk–reward profile. Let’s explore the most important ones.
Popular Options Strategies Explained with Examples
Covered Call
Setup: Buy stock + Sell Call option (same stock).
When to Use: Mildly bullish or neutral view.
Logic: You earn premium from the call while holding stock. If stock rises, gains are capped at strike price.
Example: Stock at ₹100. Buy stock and sell a Call at strike ₹110 for ₹5. If stock goes to ₹115, your profit is capped at ₹15 (₹10 from stock + ₹5 premium). If stock stays flat, you still keep the ₹5 premium.
Protective Put
Setup: Buy stock + Buy Put option.
When to Use: Bullish but want downside protection.
Logic: Works like insurance—limits potential loss if stock falls.
Example: Stock at ₹100. Buy stock + Put at strike ₹95 for ₹3. If stock drops to ₹80, your loss is capped (you can sell at ₹95).

Part 2 Support and Resistance Advantages of Options Trading
Leverage: Control a large position with limited capital.
Hedging: Protect stock holdings from adverse movements.
Flexibility: Multiple strategies for different market conditions.
Income Generation: Sell options for premium income.
Speculation: Profit from both rising and falling markets.
Market Dynamics and Participants
Options markets involve diverse participants:
Retail Traders – Individual investors trading for speculation or hedging.
Institutional Traders – Hedge funds, mutual funds, and banks use options for portfolio strategies.
Market Makers – Ensure liquidity by continuously quoting bid-ask prices.
Regulators – SEBI in India, SEC in the US, maintain fair and transparent trading practices.
Options trading occurs in exchanges like NSE, BSE, CBOE, offering standardized contracts. Indian markets primarily trade in equity options and index options.
Practical Tips for Options Trading
Start Small – Begin with limited capital while learning strategies.
Understand Greeks – They help manage risk and strategy adjustments.
Focus on Liquid Options – Avoid thinly traded contracts for better execution.
Use Stop Loss and Risk Management – Limit losses in volatile markets.
Monitor Time Decay – Be aware of how options lose value as expiration nears.
Combine Strategies – Mix calls, puts, and spreads for hedging or speculation.
Stay Updated on Market News – Earnings, policy changes, and global events impact volatility.

Part 1 Support and Resistance Option Trading Strategies
Options are highly versatile, allowing traders to implement strategies for bullish, bearish, or neutral markets. Some key strategies include:
a) Basic Strategies
Long Call – Buy a call option expecting price rise.
Long Put – Buy a put option expecting price fall.
Covered Call – Own the underlying stock and sell a call for income.
Protective Put – Own the stock and buy a put for downside protection.
b) Intermediate Strategies
Straddle – Buy both call and put with the same strike to profit from volatility.
Strangle – Buy out-of-the-money call and put to capture larger moves.
Bull Call Spread – Buy a lower strike call and sell a higher strike call to reduce premium.
Bear Put Spread – Buy a higher strike put and sell a lower strike put to limit risk.
c) Advanced Strategies
Iron Condor – Sell an out-of-the-money call and put while buying further OTM options to limit loss; profits in low volatility.
Butterfly Spread – Use multiple calls/puts to profit from minimal movement.
Calendar Spread – Sell a near-term option and buy a long-term option to profit from time decay differences.
Risk and Reward in Options
Options provide leverage, meaning a small price movement can result in substantial gains or losses. Understanding risk is crucial:
For Buyers
Maximum loss is the premium paid.
Potential profit can be unlimited (for calls) or substantial (for puts).
For Sellers (Writers)
Maximum loss can be unlimited if uncovered (naked) calls.
Premium received is the maximum gain.
Key Risks
Time decay (Theta) erodes value.
Volatility risk (Vega) can reduce option price.
Liquidity risk if the option is thinly traded.

XAUUSD H1 – Pennant + Head & ShouldersXAUUSD H1 – Pennant + Head & Shoulders: Two Key Levels 3657 / 3627
Hello Traders,
Gold opened the week with a bounce of over 20 points from the rising trendline and is now consolidating within a Pennant, which aligns with a small Head & Shoulders structure on the H1 chart. At the moment, the market is waiting for a breakout and confirmation to establish a clearer direction.
Pattern: A narrowing Pennant Flag alongside an H&S (left shoulder – head – right shoulder).
Key Zones to Watch
3655–3660: Crucial reaction zone (trendline + Pennant top).
3627: Critical support — a break below would invalidate the short-term bullish structure.
Fibonacci Levels:
1.618 in the mid-range, 2.618 lower — possible targets for a deeper correction.
MACD (12,26,9): Histogram has turned negative → short-term bearish momentum has the edge, though clear confirmation is still pending.
Trading Scenarios
Bullish Setup
Entry: Retest around 3654–3657
Targets: 3663 – 3670 – 3680 → 3695
Stop: Below 3648
Bearish Setup
Entry: Sell directly on breakdown, or wait for a retest near 3671–3674
Targets: 3663 – 3650 – 3633 – 3615 → 3595 → 3568 → 3540
Stop: Above 3679
the market is currently pricing in near certainty of a 0.25% Fed rate cut on 17th September, while the probability of a 0.50% cut still remains on the table.
If you find this analysis helpful, feel free to share your thoughts in the comments. I’ll update the outlook as soon as the price structure changes — follow me to get the latest setups first.

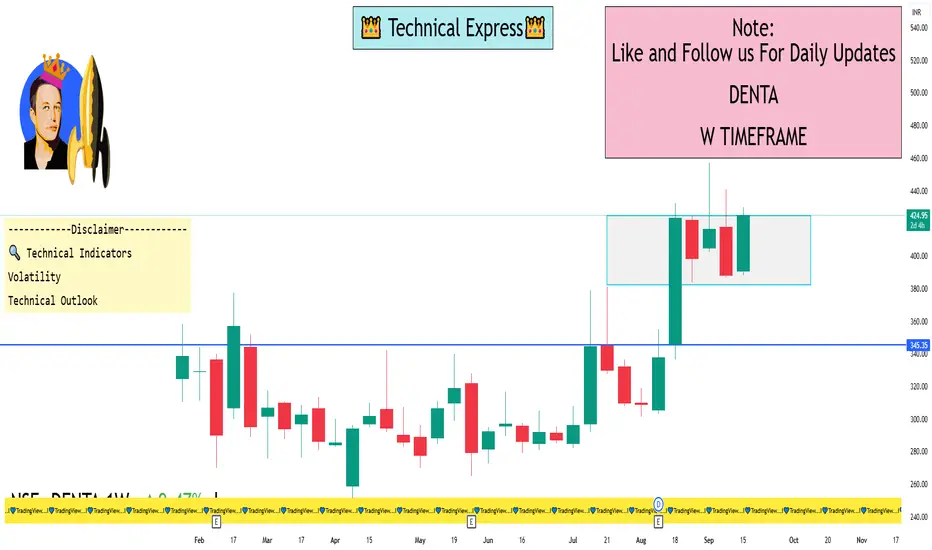
DENTA 1 Week View📈 1-Week Performance Snapshot
Current Price: ₹426.65
Week’s High/Low: ₹429.70 / ₹409.65
Weekly Change: Approximately −6.12%
📊 1-Month and 3-Month Trends
1-Month Change: +24.43%
3-Month Change: +41.61%
📉 1-Year Overview
52-Week High: ₹457.00
52-Week Low: ₹251.25
Current Price: ₹426.65
1-Year Return: Approximately +70%
🔍 Technical Indicators
Volatility: Weekly volatility stands at 8%, higher than 75% of Indian stocks, indicating relatively higher price fluctuations
Technical Outlook: Based on moving averages and other indicators, the daily buy/sell signal is currently a Strong Buy
💡 Summary
Despite a slight dip over the past week, Denta Water and Infra Solutions Ltd continues to exhibit strong growth, with significant gains over the past month and year. The stock's higher volatility suggests active trading interest, and the positive technical indicators may appeal to investors looking for momentum opportunities.
PSU vs Private Banks: Investment Battle1. Banking Landscape in India
India’s banking sector is unique, blending legacy government-run institutions with modern, technology-driven private entities. As of 2025, there are:
Public Sector Banks (PSBs): 12 major banks, including SBI, Punjab National Bank, Bank of Baroda. Government holds a majority stake.
Private Sector Banks: Around 20 significant players, including HDFC Bank, ICICI Bank, Axis Bank, and Kotak Mahindra Bank.
Foreign Banks: Limited presence, serving niche segments.
Regional Rural Banks and Cooperative Banks: Focused on rural and agricultural lending.
PSUs historically had a social mission, prioritizing financial inclusion and rural credit, sometimes at the cost of profitability. Private banks, by contrast, prioritize efficiency, profitability, and innovation, targeting urban and retail segments. This sets the stage for the ongoing investment debate between the two.
2. Understanding PSU Banks
History and Role
PSU banks have roots in the post-independence era, where the government sought to consolidate fragmented banks and direct credit toward nation-building projects. The nationalization of 14 major banks in 1969, followed by six more in 1980, created the PSU banking system we see today. The objective was to:
Expand banking access to rural areas.
Fund agriculture, small businesses, and priority sectors.
Ensure financial stability during economic challenges.
Strengths of PSU Banks
Government Backing: Full support in crises, ensuring deposit safety.
Wide Reach: Extensive branch networks, especially in rural India.
Trust and Stability: Legacy institutions like SBI enjoy strong brand recognition.
Policy Benefits: Preferential government deposits and funding.
Weaknesses of PSU Banks
High NPAs (Non-Performing Assets): Historically, poor credit appraisal led to stressed assets.
Operational Inefficiency: Legacy systems, bureaucracy, and slow decision-making.
Lower Profitability: ROE and NIM often lag private peers.
Limited Innovation: Digital adoption and customer experience often lag private banks.
3. Understanding Private Banks
Emergence and Growth
Private banks gained prominence post-liberalization (1991), focusing on urban and semi-urban markets. HDFC Bank (1994) and ICICI Bank (1994) pioneered private sector banking with modern technology, efficient risk management, and customer-centric products.
Strengths of Private Banks
Higher Profitability: Strong ROE, better margins, and lean operations.
Innovation: Digital banking, mobile apps, and AI-driven solutions.
Asset Quality: Lower NPAs due to stricter credit appraisal.
Brand and Service: Emphasis on customer experience and retail lending.
Weaknesses of Private Banks
Limited Rural Reach: Focus on profitable urban segments, neglecting rural credit.
Dependence on Retail Credit: Vulnerable to interest rate fluctuations and economic cycles.
Higher Competition: Niche banks face intense competition from both PSUs and fintechs.
4. Investor Perspective
Dividend vs Growth Investing
PSU Banks: Often provide stable dividends due to government support, appealing to income-focused investors.
Private Banks: Focus on growth; dividends may be lower but capital appreciation is higher.
Risk vs Return Profile
PSU banks are lower-risk in terms of deposit safety but higher operational and credit risk.
Private banks offer higher returns but are more exposed to economic cycles and market volatility.
Long-Term vs Short-Term Outlook
Long-term investors may benefit from PSU reforms and privatization, while private banks continue to grow due to market share gains and digital adoption.
5. Regulatory & Policy Support
RBI Oversight: Capital adequacy, NPAs, and risk management regulations apply to all banks.
Government Reforms: Privatization plans and capital infusion for PSU banks aim to improve competitiveness.
Priority Sector Lending: PSUs are mandated, private banks have optional compliance with targets.
6. Future Outlook
Digital Disruption
Private banks are adopting AI, fintech partnerships, and advanced analytics faster, potentially widening the performance gap.
Credit Demand
India’s growth trajectory (targeting a $5 trillion economy) ensures rising credit demand. Both PSU and private banks will benefit, but private banks may gain market share in retail and SME segments.
PSU Revival
With government reforms, improved risk management, and digitization, PSUs could become more efficient, making them attractive for long-term value investors.
Private Expansion
Private banks continue to expand in semi-urban and rural markets, leveraging technology to offer competitive products.
Conclusion: The Investment Battle
The battle between PSU and private banks is essentially a trade-off between safety, stability, and growth:
PSU Banks: Suitable for risk-averse investors seeking dividends and potential long-term gains from reforms.
Private Banks: Suitable for growth-focused investors seeking high returns and digital innovation exposure.
Balanced Portfolio Approach: Combining both can provide a mix of stability, income, and growth potential.
The investment choice depends on individual risk appetite, investment horizon, and market outlook. PSU banks represent legacy, government backing, and potential undervaluation, while private banks symbolize efficiency, innovation, and growth. Understanding these dynamics is critical for investors navigating India’s complex banking sector.

Commodities & MCX Gold-Silver Trading: A Complete Guide1. Introduction to Commodity Markets
Commodities have been the backbone of trade for centuries. They represent raw materials or primary agricultural products that can be bought, sold, and exchanged. Commodity markets are essential because they provide a platform for producers, consumers, and investors to manage price risks, discover prices transparently, and facilitate investment opportunities.
Globally, commodities are divided into two main types:
Hard Commodities – Naturally mined resources like gold, silver, crude oil, and copper.
Soft Commodities – Agricultural products such as wheat, coffee, sugar, and cotton.
In India, the commodities market has evolved significantly, moving from physical trade in traditional markets to electronic platforms where futures contracts are traded. Among these, gold and silver have gained prominence due to their dual role as both an investment asset and a hedge against inflation.
2. Evolution of Commodity Trading Globally & in India
Commodity trading has a long history, dating back to ancient civilizations where merchants and farmers would trade goods in local bazaars. In the modern era, commodity exchanges were established in Europe and the United States to provide standardization, transparency, and regulated trading.
In India, organized commodity trading began in the 19th century with local exchanges, but it gained structure with the Multi Commodity Exchange (MCX) in 2003. The MCX enabled electronic trading, introduced standardized contracts, and attracted institutional and retail investors alike. Today, India has several commodity exchanges, but MCX remains the most popular platform for trading gold, silver, and other metals.
3. What is MCX (Multi Commodity Exchange)?
The Multi Commodity Exchange of India (MCX) is India’s largest commodity derivatives exchange. It provides a regulated platform for trading futures contracts in metals, energy, and agricultural commodities. MCX’s key features include:
Transparency: Real-time prices are displayed, ensuring price discovery.
Liquidity: High trading volume allows investors to enter and exit positions efficiently.
Standardization: Contracts have defined lot sizes, expiry dates, and quality specifications.
Risk Management: Use of margins and clearing mechanisms protects both buyers and sellers.
MCX has become a gateway for both domestic and global traders to participate in India’s commodities market, particularly in precious metals like gold and silver.
4. Gold & Silver as Commodities
Gold and silver are unique commodities. They are not just raw materials but also financial assets. Globally, they are recognized as stores of value and act as hedges during times of economic uncertainty.
Gold: Primarily used in jewelry, electronics, and as an investment instrument. Central banks also hold gold reserves as a financial security measure.
Silver: Used in industrial applications (electronics, solar panels, medical instruments) and jewelry. Silver is more volatile than gold due to its dual role as both an industrial metal and a store of value.
The prices of these metals are influenced by global demand-supply dynamics, currency movements, interest rates, and geopolitical events.
5. Factors Driving Gold & Silver Prices
Several factors impact gold and silver prices in the MCX market:
Global Economic Conditions: During economic uncertainty, gold and silver attract investors as safe-haven assets.
US Dollar Strength: Gold and silver are priced in USD globally; a strong dollar often depresses their prices.
Inflation: Precious metals act as a hedge against inflation, driving demand during rising price levels.
Interest Rates: Higher interest rates make non-yielding assets like gold less attractive.
Industrial Demand: Silver prices are more sensitive to industrial usage compared to gold.
Geopolitical Tensions: Conflicts and crises boost demand for safe-haven metals.
6. Gold-Silver Ratio in Trading
The gold-silver ratio represents the amount of silver needed to buy one ounce of gold. It is a key tool for traders:
High ratio: Indicates silver is undervalued relative to gold, potentially a buying opportunity.
Low ratio: Suggests silver is expensive relative to gold, signaling a potential sell or hedge.
MCX traders often use this ratio to make pair trades, hedging one metal against the other to minimize risk while capitalizing on market trends.
7. How MCX Gold & Silver Contracts Work
MCX offers futures contracts for gold and silver. A futures contract is an agreement to buy or sell a specified quantity of metal at a predetermined price on a future date.
Gold Contracts: Standard lot sizes of 1 kg.
Silver Contracts: Standard lot sizes of 30 kg.
Contracts are traded electronically on MCX, and prices fluctuate based on market demand, global metal prices, and domestic factors.
8. Trading Mechanisms (Spot vs Futures)
There are two main trading methods in gold and silver:
Spot Market: Immediate delivery of physical gold/silver at current market price. Mostly used by jewelers and industrial buyers.
Futures Market: Traders speculate on future price movements without owning physical metals. Futures are more popular among investors seeking leverage and hedging opportunities.
MCX focuses on futures trading, allowing participants to profit from both rising and falling markets through buying (long) or selling (short) positions.
9. Risks & Challenges in Commodities Trading
While gold and silver trading is lucrative, it carries risks:
Market Volatility: Precious metal prices can swing sharply.
Leverage Risk: High margins amplify both gains and losses.
Liquidity Risk: Less liquid contracts may be harder to exit at desired prices.
Regulatory Risk: Changes in taxation, import duties, or trading rules can affect profits.
Global Dependence: Prices are influenced by global events beyond domestic control.
Risk management through stop-loss orders, position sizing, and diversification is essential for MCX traders.
10. Conclusion
Gold and silver trading on MCX represents a dynamic intersection of investment, speculation, and hedging. These metals are not just financial instruments but are deeply intertwined with global economic conditions, currency movements, and geopolitical developments.
By understanding contract specifications, trading mechanisms, price drivers, and risk management, traders can navigate the complex world of MCX commodities effectively. While risks exist, disciplined trading strategies, combined with global insights, can make gold and silver futures a profitable and rewarding venture for both retail and institutional investors.
MCX gold and silver trading is more than just buying and selling; it is an art of balancing global insights, domestic trends, and personal risk appetite, making it one of the most engaging markets in India’s financial ecosystem.
Currency Derivatives & INR VolatilityPart 1: Understanding Currency Derivatives
1.1 What are Currency Derivatives?
Currency derivatives are financial contracts whose value is derived from the exchange rate of one currency against another. They allow market participants to lock in, hedge, or speculate on future currency movements.
For example:
An Indian importer of crude oil may use a USD/INR futures contract to protect themselves from the risk of a weakening rupee.
A trader may buy options on USD/INR expecting volatility around an RBI policy announcement.
1.2 Types of Currency Derivatives
1.2.1 Currency Forwards
A forward contract is a customized agreement between two parties to exchange a certain amount of currency at a future date at a fixed exchange rate. In India, forwards are widely used by corporates with genuine foreign exchange exposure.
1.2.2 Currency Futures
Futures are standardized contracts traded on exchanges like NSE or BSE. For example, USD/INR futures allow participants to buy or sell US Dollars at a future date at a predetermined price. Futures provide transparency, liquidity, and are regulated by SEBI.
1.2.3 Currency Options
Options give the buyer the right (but not the obligation) to buy or sell currency at a predetermined rate before a specific date. They are powerful tools for hedging uncertain outcomes. For instance, an exporter expecting USD payments may buy a put option to safeguard against INR appreciation.
1.2.4 Currency Swaps
Swaps involve exchanging principal and interest payments in different currencies. They are often used by companies or governments borrowing abroad to manage currency and interest rate risks.
Part 2: The Dynamics of INR Volatility
2.1 What is INR Volatility?
INR volatility refers to fluctuations in the value of the Indian Rupee against other currencies. It can be measured using indicators like standard deviation of returns, implied volatility from options, or volatility indices.
For example:
If USD/INR moves from 83.20 to 84.10 within a week, that 90-paisa move reflects volatility.
2.2 Causes of INR Volatility
2.2.1 Trade Deficit & Balance of Payments
India imports more than it exports, especially crude oil. A rising trade deficit often puts downward pressure on INR.
2.2.2 Capital Flows (FII/FPI Investments)
Large inflows of foreign capital strengthen INR, while sudden outflows (like during global risk-off events) weaken it.
2.2.3 Interest Rate Differentials
If US interest rates rise while Indian rates remain steady, investors may prefer USD assets, leading to INR depreciation.
2.2.4 Global Commodity Prices
A surge in oil prices increases India’s import bill, weakening INR. Conversely, stable or falling prices support INR.
2.2.5 Geopolitical Tensions & Global Uncertainty
Events like wars, sanctions, or global financial crises drive investors to safe-haven assets like the USD, increasing INR volatility.
2.2.6 Domestic Policies & RBI Intervention
The Reserve Bank of India (RBI) frequently intervenes in the forex market to prevent sharp swings. However, such interventions cannot fully eliminate volatility.
2.3 Measuring INR Volatility
Historical Volatility (HV): Based on past exchange rate movements.
Implied Volatility (IV): Derived from option prices, showing expected future volatility.
Rupee Volatility Index (INR VIX): Similar to equity VIX, a market measure of expected volatility in INR.
Part 3: The Role of Currency Derivatives in Managing INR Volatility
3.1 Hedging Through Derivatives
Currency derivatives help corporates, banks, and individuals manage the risks of adverse INR movements.
Importers: Hedge against INR depreciation (higher cost of imports).
Exporters: Hedge against INR appreciation (reduced export earnings).
Investors: Hedge foreign equity/debt portfolio risks.
3.2 Speculation & Arbitrage
Apart from hedging, derivatives also attract traders who speculate on short-term INR movements. Arbitrageurs exploit price differences between spot, futures, and options markets.
3.3 Corporate Case Example
Suppose an Indian IT company expects $100 million in revenue in 3 months. If INR strengthens from 83 to 81, revenue in INR terms falls by ₹200 crore. By using a USD/INR forward contract, the company can lock in the rate and secure predictable cash flows.
3.4 Risk Management in Banks
Banks are major participants in currency derivative markets. They manage client exposure while also using derivatives to balance their own positions. RBI regulations ensure banks don’t take excessive speculative risk.
Part 4: Regulatory Framework in India
4.1 Role of RBI & SEBI
RBI: Regulates over-the-counter (OTC) forex derivatives.
SEBI: Regulates exchange-traded derivatives (ETDs).
4.2 Exchange-Traded Currency Derivatives in India
Launched in 2008, currency futures and options on exchanges like NSE, BSE, and MCX-SX have grown rapidly. Contracts are available in USD/INR, EUR/INR, GBP/INR, JPY/INR, and cross-currency pairs.
4.3 RBI’s Intervention Policy
RBI often uses its reserves to prevent extreme INR volatility, but avoids pegging INR to a fixed rate. This “managed float” system balances stability and flexibility.
Part 5: Impact of INR Volatility
5.1 On Businesses
Importers: Weaker INR increases costs of raw materials.
Exporters: Stronger INR reduces competitiveness abroad.
SMEs: Smaller firms often lack hedging mechanisms, making them more vulnerable.
5.2 On Investors
Equity Investors: INR depreciation hurts foreign investors’ returns, leading to outflows.
Debt Investors: Currency risk affects bond investments, especially government securities.
5.3 On the Economy
Inflation: Weaker INR makes imports expensive, adding to inflation.
Growth: Currency instability affects trade, investment, and financial confidence.
Forex Reserves: RBI may need to use reserves to stabilize INR, impacting balance sheet strength.
Part 6: Opportunities & Challenges
6.1 Opportunities
Deepening of Currency Markets: Growing participation increases liquidity and efficiency.
New Instruments: Cross-currency derivatives (e.g., EUR/USD in India) expand opportunities.
Retail Participation: Rising awareness allows individuals to hedge or invest.
6.2 Challenges
Speculative Excesses: Over-leverage by traders can cause instability.
Regulatory Restrictions: Limited participation compared to global FX markets.
Information Asymmetry: SMEs and retail participants lack knowledge on hedging tools.
Conclusion
Currency derivatives and INR volatility are two sides of the same coin in India’s financial landscape. The rupee, being influenced by domestic and international factors, will always experience fluctuations. These fluctuations, if unmanaged, can disrupt businesses, trade, and investment.
Currency derivatives provide a structured way to manage risks, offering corporates, banks, and investors tools to hedge exposure while also opening avenues for speculation and arbitrage. However, their effectiveness depends on proper usage, regulatory oversight, and awareness among participants.
In the long run, as India’s economy expands, INR’s role in global finance will increase. With it, the need for efficient currency derivative markets will only grow. Proper risk management, coupled with regulatory prudence, can turn volatility from a threat into an opportunity, ensuring stability and growth in India’s financial ecosystem.
Volume Profile & Market Structure AnalysisPart 1: Understanding Market Structure
1.1 What is Market Structure?
Market structure is the framework of price movement. It’s the natural rhythm of the market, made up of highs, lows, trends, ranges, breakouts, and consolidations. Think of it as the skeleton of price action, which reveals how institutions and retail traders interact.
In simple terms, market structure helps us answer:
Is the market trending up, trending down, or consolidating?
Where are liquidity pools likely located?
Which price levels matter most to big players (banks, hedge funds, market makers)?
1.2 The Building Blocks of Market Structure
Swing Highs and Swing Lows
Swing High: A peak where price fails to continue higher.
Swing Low: A valley where price fails to continue lower.
These levels often act as liquidity pools where stop losses gather.
Trends
Uptrend: Higher highs (HH) and higher lows (HL).
Downtrend: Lower lows (LL) and lower highs (LH).
Sideways/Range: Price oscillates between support and resistance with no clear direction.
Break of Structure (BoS)
When price violates the previous high or low, signaling a shift in trend. Example: if price makes a new higher high after a downtrend, that could signal a bullish shift.
Change of Character (ChoCh)
A sudden break in the short-term market rhythm, often the first clue of a potential trend reversal.
Liquidity
Stop orders, pending orders, and clusters of positions sitting around obvious levels (support, resistance, round numbers).
Market makers often push price toward these liquidity zones to fill large institutional orders.
1.3 Institutional vs. Retail Market Structure
Retail traders often focus on patterns (double tops, triangles, flags).
Institutions care about liquidity and order flow. They engineer moves to trap retail positions and accumulate their own.
This is why understanding structure at an institutional level (smart money concepts) is crucial. It explains phenomena like false breakouts, liquidity sweeps, and stop hunts.
Part 2: Understanding Volume Profile
2.1 What is Volume Profile?
Volume Profile is a charting tool that shows how much trading volume occurred at each price level during a given period. Instead of just telling you “when” trades occurred (time-based volume), it tells you “where” trades occurred in price.
The Volume Profile is plotted as a horizontal histogram along the price axis. This makes it easier to see which price zones attracted the most participation from traders and institutions.
2.2 Key Components of Volume Profile
Point of Control (POC)
The price level with the highest traded volume.
Acts as a magnet for price because it represents “fair value.”
Value Area (VA)
The range where about 70% of trading volume occurred.
Split into:
Value Area High (VAH)
Value Area Low (VAL)
High-Volume Nodes (HVN)
Areas of heavy participation (accumulation zones).
Price often consolidates here.
Low-Volume Nodes (LVN)
Areas where price quickly passed through with little trading.
Often act as support/resistance.
2.3 Why Volume Profile Matters
Shows institutional footprints: Institutions need liquidity to fill big orders, so they often transact heavily around POC and HVNs.
Highlights imbalances: When price rejects LVNs, it suggests aggressive buying/selling dominance.
Helps with trade entries & exits: Knowing where fair value is (POC) vs. imbalance zones helps traders time reversals or continuations.
Part 3: Combining Market Structure & Volume Profile
Market Structure tells you the direction of the market, while Volume Profile shows you where the heavy battles occur. Used together, they create a powerful framework.
3.1 Example: Trend Continuation Setup
Step 1: Identify the trend using Market Structure (higher highs, higher lows).
Step 2: Look at Volume Profile to find the POC or Value Area Low (support).
Step 3: If price retraces to VAL while maintaining bullish structure, it’s often a high-probability continuation zone.
3.2 Example: Reversal Setup
Step 1: Notice a Change of Character (ChoCh) in structure.
Step 2: Check if price swept liquidity near an HVN or POC.
Step 3: If Volume Profile shows rejection of that value area, it signals strong reversal potential.
3.3 Liquidity & Volume Synergy
Liquidity pools (stop-loss clusters) often sit near low-volume nodes because price moves fast through those zones.
Institutions push price into these LVNs to trigger stops and then absorb liquidity.
Once filled, price usually returns to HVNs (fair value).
Part 4: Practical Strategies with Volume Profile & Market Structure
4.1 The Volume Profile Rejection Strategy
Identify LVNs.
Wait for price to test and sharply reject.
Enter with trend confirmation from market structure.
4.2 Breakout + Volume Profile Confirmation
If price breaks a structural level (BoS), check if it’s supported by high volume near POC.
Strong volume = genuine breakout.
Weak volume = likely false breakout.
4.3 Value Area Rotations
Price often oscillates between VAH and VAL.
Strategy: Buy near VAL, sell near VAH, exit at POC.
Works best in ranging conditions.
Part 5: Psychological & Institutional Insights
Retail Traps: Market structure fakeouts occur around LVNs, engineered by institutions.
Smart Money Accumulation: Seen in HVNs—where large players accumulate before big moves.
Auction Theory: Markets function as auctions—Volume Profile is essentially a visualization of that auction process.
Conclusion
Volume Profile and Market Structure Analysis are not “magic bullets,” but together they form one of the most institutionally aligned trading frameworks available to retail traders.
Market Structure explains where price wants to go.
Volume Profile explains where participants are most active.
By combining them, traders can anticipate moves with higher probability, avoid traps, and align themselves closer to the behavior of professional market participants.
Ultimately, the goal is to stop thinking like a retail trader chasing indicators and start thinking like a liquidity hunter—someone who understands where the market is auctioning, who’s trapped, and where the next wave of orders is likely to hit.