Trading Master ClassIntroduction to Options Trading
Options trading is one of the most flexible and powerful tools in the financial markets. Unlike stocks, where you simply buy and sell ownership of a company, options are derivative contracts that give you the right, but not the obligation, to buy or sell an underlying asset at a predetermined price within a specified time frame.
The beauty of options lies in their strategic possibilities — they allow traders to make money in rising, falling, or even sideways markets, often with less capital than buying stocks outright. But with that flexibility comes complexity, so understanding strategies is crucial.
Key Terms in Options Trading
Before we jump into strategies, let’s understand the key terms:
Call Option – Gives the right to buy the underlying asset at a fixed price (strike price) before expiry.
Put Option – Gives the right to sell the underlying asset at a fixed price before expiry.
Strike Price – The price at which you can buy/sell the asset.
Premium – The price you pay to buy an option.
Expiry Date – The date the option contract ends.
ITM (In-the-Money) – When exercising the option would be profitable.
ATM (At-the-Money) – Strike price is close to the current market price.
OTM (Out-of-the-Money) – Option has no intrinsic value yet.
Lot Size – Minimum number of shares/contracts per option.
Intrinsic Value – The real value if exercised now.
Time Value – Extra premium based on time left to expiry.
Trading

Learn Institutional TradingIntroduction to Options Trading
Options trading is one of the most flexible and powerful tools in the financial markets. Unlike stocks, where you simply buy and sell ownership of a company, options are derivative contracts that give you the right, but not the obligation, to buy or sell an underlying asset at a predetermined price within a specified time frame.
The beauty of options lies in their strategic possibilities — they allow traders to make money in rising, falling, or even sideways markets, often with less capital than buying stocks outright. But with that flexibility comes complexity, so understanding strategies is crucial.
Key Terms in Options Trading
Before we jump into strategies, let’s understand the key terms:
Call Option – Gives the right to buy the underlying asset at a fixed price (strike price) before expiry.
Put Option – Gives the right to sell the underlying asset at a fixed price before expiry.
Strike Price – The price at which you can buy/sell the asset.
Premium – The price you pay to buy an option.
Expiry Date – The date the option contract ends.
ITM (In-the-Money) – When exercising the option would be profitable.
ATM (At-the-Money) – Strike price is close to the current market price.
OTM (Out-of-the-Money) – Option has no intrinsic value yet.
Lot Size – Minimum number of shares/contracts per option.
Intrinsic Value – The real value if exercised now.
Time Value – Extra premium based on time left to expiry.

Part 2 Ride The Big MovesHow Options Work in Trading
Imagine a stock is trading at ₹1,000.
You believe it will rise to ₹1,100 in a month. You could:
Buy the stock: You need ₹1,000 per share.
Buy a call option: You pay a small premium (say ₹50) for the right to buy at ₹1,000 later.
If the stock rises to ₹1,100:
Stock profit = ₹100
Call option profit = ₹100 (intrinsic value) - ₹50 (premium) = ₹50 net profit (but with much lower capital).
This leverage makes options attractive but also risky — if the stock doesn’t rise, your premium is lost.
Categories of Options Strategies
Options strategies can be divided into three main categories:
Directional Strategies – Profit from price movements.
Non-Directional (Neutral) Strategies – Profit from sideways markets.
Hedging Strategies – Protect existing positions.

Part 1 Ride The Big MovesIntroduction to Options Trading
Options trading is one of the most flexible and powerful tools in the financial markets. Unlike stocks, where you simply buy and sell ownership of a company, options are derivative contracts that give you the right, but not the obligation, to buy or sell an underlying asset at a predetermined price within a specified time frame.
The beauty of options lies in their strategic possibilities — they allow traders to make money in rising, falling, or even sideways markets, often with less capital than buying stocks outright. But with that flexibility comes complexity, so understanding strategies is crucial.
Key Terms in Options Trading
Before we jump into strategies, let’s understand the key terms:
Call Option – Gives the right to buy the underlying asset at a fixed price (strike price) before expiry.
Put Option – Gives the right to sell the underlying asset at a fixed price before expiry.
Strike Price – The price at which you can buy/sell the asset.
Premium – The price you pay to buy an option.
Expiry Date – The date the option contract ends.
ITM (In-the-Money) – When exercising the option would be profitable.
ATM (At-the-Money) – Strike price is close to the current market price.
OTM (Out-of-the-Money) – Option has no intrinsic value yet.
Lot Size – Minimum number of shares/contracts per option.
Intrinsic Value – The real value if exercised now.
Time Value – Extra premium based on time left to expiry.

Technical Analysis for Modern Markets1. Introduction to Technical Analysis (TA)
Technical Analysis (TA) is the study of price action, volume, and market data to forecast future price movements. Unlike Fundamental Analysis (FA), which focuses on the intrinsic value of an asset, TA focuses on how the market is behaving rather than why it behaves that way.
The core idea is simple:
All known information is already reflected in the price, and market behavior tends to repeat because human psychology is consistent.
However, in modern markets — dominated by high-frequency trading (HFT), AI algorithms, global interconnection, and social media-driven sentiment — TA has evolved far beyond simple chart patterns.
2. The Core Principles of Technical Analysis
Charles Dow, considered the father of TA, laid the groundwork in the late 19th century. His principles still hold today, even with algorithmic speed:
Price Discounts Everything
All factors — earnings, news, global events — are already priced in.
Prices Move in Trends
Markets move in identifiable trends until they reverse.
History Tends to Repeat Itself
Patterns emerge because market participants (humans or algorithms programmed by humans) react in similar ways over time.
3. Evolution of Technical Analysis in Modern Markets
Old Era (pre-2000s):
Hand-drawn charts, daily candles, minimal computing power.
Indicators like RSI, MACD, and Moving Averages dominated.
Modern Era (2000s–Present):
Intraday data down to milliseconds.
AI-powered trading systems scanning thousands of instruments simultaneously.
Social sentiment analysis integrated into price action.
Cross-market correlations (forex, equities, crypto, commodities).
Volume profile, order flow, and market microstructure becoming mainstream.
Why it matters:
Today’s TA must adapt to speed, complexity, and noise.
4. Types of Technical Analysis
4.1. Chart-Based Analysis
This is the visual study of price movement:
Candlestick Charts — Show open, high, low, close (OHLC) data.
Line Charts — Simpler, based on closing prices.
Heikin Ashi & Renko — Smooth out market noise.
Modern use: Candlestick charts are still king, but traders combine them with volume profile and order flow data for deeper insight.
4.2. Indicator-Based Analysis
Indicators transform price/volume data mathematically to highlight trends and momentum.
Categories:
Trend Indicators
Moving Averages (SMA, EMA)
Ichimoku Cloud
Supertrend
Momentum Indicators
RSI (Relative Strength Index)
Stochastic Oscillator
MACD (Moving Average Convergence Divergence)
Volatility Indicators
Bollinger Bands
ATR (Average True Range)
Volume Indicators
On-Balance Volume (OBV)
Chaikin Money Flow (CMF)
Volume Profile (Modern favorite)
Modern twist:
Traders often use custom-coded indicators and multi-timeframe confluence instead of relying on one default indicator.
4.3. Market Structure Analysis
Instead of just indicators, traders look at:
Support & Resistance zones
Swing highs/lows
Break of Structure (BoS)
Liquidity zones (stop-hunt areas)
Modern adaptation: Market structure is paired with order flow & footprint charts for precision.
5. Volume Profile and Order Flow in Modern TA
Traditional TA often ignored volume’s deeper story. Now, Volume Profile and Order Flow show where trading activity is concentrated.
Volume Profile — Plots volume at price levels, revealing high-volume nodes (support/resistance zones).
Order Flow Analysis — Tracks buy/sell imbalances at specific prices using Level II and footprint charts.
Why it matters:
Institutions place orders at certain price clusters — knowing these can reveal hidden market intentions.
6. Multi-Timeframe Analysis (MTA)
Modern markets demand MTA:
Higher timeframe: Identifies the main trend (weekly, daily).
Lower timeframe: Finds precise entries (1-min, 5-min).
Example:
Weekly chart shows uptrend.
Daily chart shows pullback.
5-min chart shows bullish reversal candle at support → high-probability long entry.
7. Market Psychology in Technical Analysis
TA works largely because human emotions — fear and greed — repeat over time:
Fear causes panic selling at lows.
Greed causes overbuying at highs.
Even in algorithmic markets, humans program the algorithms — embedding the same patterns of overreaction.
8. Chart Patterns in Modern Context
Classic patterns still work but require confirmation due to fake-outs caused by HFT.
Common patterns:
Head & Shoulders
Double Top/Bottom
Triangles
Flags/Pennants
Modern approach:
Pair patterns with:
Volume confirmation
Breakout retests
Order flow validation
9. Fibonacci & Harmonic Trading
Fibonacci retracements/extensions identify potential reversal zones.
Harmonic patterns (Gartley, Bat, Butterfly) extend this with specific ratios.
Modern adaptation:
Combine Fibonacci with Volume Profile to find strong confluence zones.
Use algorithmic scanners to detect patterns instantly.
10. Supply and Demand Zones
Supply zones = where sellers overwhelm buyers.
Demand zones = where buyers overwhelm sellers.
Modern use:
Use multi-timeframe supply/demand mapping.
Watch for liquidity grabs before major moves.
Conclusion
Technical Analysis for modern markets is not just about drawing lines — it’s about understanding the story behind the price.
From candlesticks to order flow, from Fibonacci to AI sentiment tools, TA has evolved into a fusion of art and science.
In modern markets:
Speed matters.
Data depth matters.
Adaptability matters most.
Mastering TA means blending classic principles with cutting-edge tools, managing risk, and continuously learning — because markets, like technology, never stop evolving.
Intraday Scalping & Momentum Trading1. Introduction
In the high-speed world of financial markets, two strategies stand out for traders who thrive on quick decisions and rapid results: Intraday Scalping and Momentum Trading.
While both are short-term trading styles, they differ in execution speed, trade duration, and the logic behind entries and exits.
Intraday Scalping focuses on capturing tiny price movements — sometimes just a few points — multiple times throughout the trading session.
Momentum Trading aims to ride significant price moves caused by strong buying or selling pressure, often holding positions for minutes to hours until the trend exhausts.
In both strategies:
Speed is critical.
Precision is non-negotiable.
Discipline is the backbone.
2. The Core Concepts
2.1 Intraday Scalping
Scalping is like market sniping — taking small, precise shots. The goal is not to hit a home run but to consistently hit singles that add up.
Key traits:
Very short holding times (seconds to a few minutes).
Multiple trades per day (5–50+ depending on style).
Targets are small (0.1%–0.5% price move per trade).
Relies on high liquidity and tight bid-ask spreads.
Example:
Stock XYZ is trading at ₹100.25/₹100.30.
Scalper buys at ₹100.30.
Price ticks up to ₹100.40 in 30 seconds.
Exit at ₹100.40 — profit of ₹0.10 per share.
Tools used:
Level 2 order book (market depth).
Time & sales tape.
Tick charts (1-min, 15-sec).
Volume profile for micro-trends.
2.2 Momentum Trading
Momentum trading is like surfing a wave. Once a strong move starts (due to news, earnings, sector activity, or breakout), momentum traders jump in to ride the surge until it slows.
Key traits:
Holding time is longer than scalping (minutes to hours).
Focus on directional moves with high relative volume.
Larger price targets (0.5%–3% or more per trade).
Relies on trend continuation until exhaustion.
Example:
Stock ABC breaks resistance at ₹250 on high volume after earnings.
Trader buys at ₹252 expecting further upside.
Price runs to ₹260 before showing weakness.
Exit at ₹259 — profit of ₹7 per share.
Tools used:
1-min to 15-min charts.
Moving averages for trend confirmation.
Relative Volume (RVOL) scanners.
Momentum oscillators like RSI, MACD.
3. Scalping vs Momentum — Quick Comparison
Feature Scalping Momentum Trading
Trade Duration Seconds to few minutes Minutes to hours
Profit Target 0.1%–0.5% 0.5%–3%+
Risk per Trade Very small Small to medium
Frequency High (10–50 trades/day) Moderate (2–10 trades/day)
Chart Timeframes Tick, 15s, 1m 1m, 5m, 15m
Market Conditions High liquidity, volatile Trending, news-driven
Mindset Ultra-fast decisions Patient within trend
4. Market Conditions Suitable for Each
Scalping Works Best When:
Market is choppy but liquid.
Bid-ask spread is tight.
Price moves in micro-waves.
There is high intraday volatility without a clear trend.
Momentum Works Best When:
Market has strong trend days.
There’s a news catalyst or earnings.
Breakouts/breakdowns occur with volume surge.
A sector rotation drives capital into specific stocks.
5. Technical Tools & Indicators
For Scalping
VWAP (Volume Weighted Average Price) – Used as a magnet for price action; scalpers fade moves away from VWAP or trade rejections.
EMA 9 & EMA 20 – For micro-trend direction.
Order Flow Analysis – Reading the tape to identify big orders.
Bollinger Bands (1-min) – Spotting overextensions.
Volume Profile – Identifying intraday support/resistance.
For Momentum
Moving Averages (EMA 20, EMA 50) – Identify trend continuation.
MACD – Confirm momentum strength.
RSI (5 or 14 period) – Spotting overbought/oversold within a trend.
Breakout Levels – Pre-marked resistance/support zones.
Relative Volume (RVOL) – Ensures trade is supported by unusual buying/selling pressure.
6. Strategies
6.1 Scalping Strategies
A) VWAP Bounce Scalping
Wait for price to pull back to VWAP after a quick move.
Enter on rejection candles.
Exit after a small bounce.
B) Breakout Scalping
Identify micro-breakouts from 1-min consolidation.
Enter just before the breakout.
Exit within seconds once target is hit.
C) Market Maker Following
Watch for large limit orders on Level 2.
Follow their buying/selling pressure.
Exit when big order disappears.
6.2 Momentum Strategies
A) News Catalyst Plays
Scan for stocks with fresh positive/negative news.
Wait for first pullback after breakout.
Ride until momentum slows.
B) Trend Continuation
Identify stock above VWAP and moving averages.
Enter on EMA 9/EMA 20 bounce.
Exit when price closes below EMA 20.
C) High Relative Volume Breakouts
Use RVOL > 2.0 filter.
Enter when volume spikes confirm breakout.
Place stop-loss just under breakout level.
7. Risk Management
Both scalping and momentum trading require tight stop-losses because small moves against you can quickly turn into bigger losses.
For Scalping:
Stop-loss: 0.1%–0.3%.
Risk per trade: ≤ 0.5% of account.
Don’t average down — cut losses immediately.
For Momentum:
Stop-loss: 0.5%–1.5%.
Risk per trade: ≤ 1% of account.
Trail stops to lock in profits.
General Rules:
Use position sizing: Risk Amount ÷ Stop Size = Position Size.
Always account for slippage.
Never risk more than you can afford to lose in a single day.
8. Trading Psychology
For Scalpers:
Stay hyper-focused. Avoid hesitation. The moment you second-guess, the trade is gone. Mental fatigue sets in quickly — take breaks.
For Momentum Traders:
Patience is key. Don’t exit too early from fear or greed. Stick to the plan and avoid chasing after missed moves.
Mind Traps to Avoid:
Overtrading.
Revenge trading after a loss.
Ignoring stop-loss because “it might bounce back.”
Letting small losses turn into big ones.
9. Examples of a Trading Day
Scalping Example
9:20 AM: Identify stock XYZ near pre-market resistance.
9:25 AM: Scalper enters on small pullback.
9:26 AM: Price moves 0.15% up — exit instantly.
Repeat 12–15 times, ending with 8 wins, 4 losses.
Momentum Example
9:25 AM: News drops on ABC Ltd.
9:30 AM: Stock gaps up 3%, breaks resistance with volume.
Buy at ₹252, hold for 20 minutes as it climbs to ₹259.
Exit when volume declines and price closes under EMA 20.
10. Common Mistakes
Scalping:
Entering in low-volume stocks → big slippage.
Over-leveraging.
Trading during low volatility periods.
Momentum:
Chasing moves without pullback.
Ignoring broader market trend.
Overstaying in trade after momentum fades.
11. Advanced Tips
Use hotkeys to speed up entries and exits.
Trade during high liquidity hours (first and last 90 minutes of market).
Combine pre-market analysis with real-time setups.
Keep a trading journal to refine entries/exits.
12. Conclusion
Intraday Scalping and Momentum Trading are high-performance trading styles that can generate consistent profits for skilled traders — but they’re not for the faint-hearted.
They require:
Quick decision-making.
Iron discipline.
Solid risk management.
Technical precision.
The golden rule is: protect your capital first, profits will follow.
Market Rotation Strategies1. Introduction to Market Rotation
Market rotation (also called sector rotation or capital rotation) is a strategy where traders and investors shift their capital between different asset classes, sectors, or investment styles based on economic conditions, market sentiment, and performance trends.
The idea is simple: money flows like a river — it doesn’t disappear, it just changes direction. By positioning yourself where the money is flowing, you can potentially capture higher returns and reduce drawdowns.
Example: In an economic boom, technology and consumer discretionary stocks may outperform. But during a slowdown, utilities and healthcare might take the lead.
2. Why Market Rotation Works
Market rotation works because of capital flow dynamics. Institutional investors, hedge funds, pension funds, and large asset managers reallocate capital based on:
Economic Cycle – Growth, peak, contraction, and recovery phases affect which sectors lead or lag.
Interest Rates – Rising or falling rates change the attractiveness of certain assets.
Earnings Growth Expectations – Sectors with better forward earnings tend to attract inflows.
Risk Appetite – “Risk-on” phases favor aggressive sectors; “risk-off” phases favor defensive sectors.
Rotation strategies aim to front-run or follow these capital shifts.
3. Types of Market Rotation
Market rotation isn’t just about sectors. It happens across various dimensions:
A. Sector Rotation
Shifting between market sectors (e.g., tech, energy, financials, healthcare) depending on performance and macroeconomic signals.
Example Pattern in a Typical Economic Cycle:
Early Expansion: Industrials, Materials, Financials
Mid Expansion: Technology, Consumer Discretionary
Late Expansion: Energy, Basic Materials
Recession: Utilities, Healthcare, Consumer Staples
B. Style Rotation
Shifting between different investing styles such as:
Growth vs. Value
Large-cap vs. Small-cap
Dividend vs. Non-dividend stocks
Example: When interest rates rise, value stocks often outperform growth stocks.
C. Asset Class Rotation
Shifting between stocks, bonds, commodities, real estate, or even cash based on macroeconomic conditions.
Example: Moving from equities to bonds before an expected recession.
D. Geographic Rotation
Allocating funds between different countries or regions.
Example: Rotating from U.S. equities to emerging markets when global growth broadens.
4. The Economic Cycle & Market Rotation
Understanding the economic cycle is critical for timing rotations.
Four Main Phases:
Early Recovery: GDP starts growing, interest rates are low, credit expands.
Mid Cycle: Growth strong, inflation starts rising, central banks begin tightening.
Late Cycle: Growth slows, inflation high, corporate profits peak.
Recession: GDP contracts, unemployment rises, central banks cut rates.
Sector Leaders by Cycle:
Economic Phase Leading Sectors
Early Recovery Industrials, Financials, Technology
Mid Cycle Consumer Discretionary, Industrials, Tech
Late Cycle Energy, Materials, Healthcare
Recession Utilities, Consumer Staples, Healthcare
5. Tools & Indicators for Rotation Strategies
A. Relative Strength (RS) Analysis
Compares the performance of a sector/asset to a benchmark (e.g., S&P 500).
RS > 1: Outperforming
RS < 1: Underperforming
B. Moving Averages
Track momentum trends in sector ETFs or indexes.
50-day & 200-day MA crossovers can signal when to rotate.
C. MACD & RSI
Momentum oscillators can indicate when a sector is overbought/oversold.
D. Intermarket Analysis
Study correlations between:
Stocks & Bonds
Commodities & Currencies
Oil prices & Energy stocks
E. Economic Data
Key data points for rotation:
PMI (Purchasing Managers Index)
Inflation (CPI, PPI)
Interest Rate Trends
Earnings Reports
6. Step-by-Step: Building a Market Rotation Strategy
Step 1 – Define Your Universe
Choose what you’ll rotate between:
S&P 500 sectors (using ETFs like XLK for tech, XLF for financials)
Style indexes (e.g., Growth vs Value ETFs)
Asset classes (SPY, TLT, GLD, etc.)
Step 2 – Choose Your Indicators
Example:
3-month relative performance vs S&P 500
Above 50-day MA = bullish
Below 50-day MA = bearish
Step 3 – Establish Rotation Rules
Example:
Every month, buy the top 3 sectors ranked by RS.
Hold until the next review period.
Exit if RS drops below 0.9 or price closes below 200-day MA.
Step 4 – Risk Management
Max 20-30% of portfolio per sector
Stop-loss of 8-10% per position
Cash position allowed when no sector meets criteria
Step 5 – Backtest
Use historical data for at least 10 years.
Compare performance vs buy-and-hold S&P 500.
7. Example Rotation Strategy
Universe: 9 SPDR Sector ETFs
Indicator: 3-month price performance
Rules:
Each month, rank all sectors by 3-month returns.
Buy the top 3 equally weighted.
Hold for 1 month, then rebalance.
Exit if price drops below 200-day MA.
Result (historical):
Outperforms S&P 500 in trending markets.
Avoids big drawdowns in recessions.
8. Advanced Rotation Approaches
A. Factor Rotation
Rotate based on factors like:
Momentum
Low Volatility
Quality
Value
B. Tactical Asset Allocation (TAA)
Mix market rotation with risk-on/risk-off models.
Example:
Risk-on: Equities + Commodities
Risk-off: Bonds + Cash
C. Quantitative Rotation
Use algorithms to dynamically shift assets based on multi-factor models (momentum + macro + volatility).
D. Seasonal Rotation
Exploit seasonal trends.
Example: Energy stocks in winter, retail stocks in holiday season.
9. Risk Management in Market Rotation
Even with a rotation strategy:
Correlations can rise in market crashes (everything falls together).
Overtrading can eat into returns due to costs.
False signals can lead to whipsaws.
Mitigation:
Use confirmation from multiple indicators.
Diversify across at least 3 positions.
Keep cash buffer during high uncertainty.
10. Common Mistakes in Rotation Strategies
Chasing performance – Entering too late after a sector has already peaked.
Ignoring transaction costs – Frequent rebalancing reduces net gains.
Overfitting backtests – Strategy works historically but fails in real time.
Neglecting macro trends – Technicals alone may miss big shifts.
Conclusion
Market rotation strategies are about positioning capital where it has the highest probability of growth while avoiding weak areas.
Done right, rotation:
Improves returns
Reduces volatility
Aligns with economic and market cycles
But it requires discipline, data, and adaptability.
The market is dynamic — rotation strategies must evolve with it.
Price Action Trading1. Introduction
Price Action Trading (PAT) is one of the most natural, clean, and powerful approaches to the financial markets.
It focuses on reading the movement of price itself rather than relying heavily on indicators or automated systems.
In other words — instead of asking, “What is my MACD or RSI saying?”, you ask, “What is the market actually doing right now?”
Price action traders believe that:
Price reflects all available market information.
Price moves in patterns due to human behavior, psychology, and market structure.
You can make trading decisions by analyzing candlesticks, chart patterns, and support/resistance.
2. The Core Philosophy
The philosophy behind price action is simple:
“Price is the ultimate truth of the market.”
Economic reports, earnings, interest rates, news — all these influence price. But you don’t need to predict them directly. Price action trading accepts that all such factors are already factored into the current price movement.
Instead of chasing the “why,” we focus on the “what”:
What is price doing? (trend, consolidation, reversal)
Where is price? (key levels, breakouts, ranges)
How is price moving? (speed, momentum, volatility)
3. Why Choose Price Action Trading?
Advantages:
Clarity: Charts are clean, no clutter from too many indicators.
Universal: Works on all markets — stocks, forex, crypto, commodities.
Timeless: Price patterns remain relevant because human psychology hasn’t changed for centuries.
Adaptability: Can be used for scalping, day trading, swing trading, or even position trading.
Early Entry Signals: Often gives quicker signals than lagging indicators.
Limitations:
Requires patience to master.
Interpretation can be subjective.
Demands strict discipline and emotional control.
4. Understanding Market Structure
Before you can trade with price action, you need to understand market structure.
Market structure is the basic “road map” of price movement.
4.1 Trends
Uptrend: Price forms higher highs (HH) and higher lows (HL).
Downtrend: Price forms lower highs (LH) and lower lows (LL).
Sideways / Range: Price moves between horizontal support and resistance.
4.2 Market Phases
Accumulation: Market moves sideways after a downtrend — buyers quietly building positions.
Markup: Strong upward movement with higher highs.
Distribution: Sideways after an uptrend — sellers offloading positions.
Markdown: Strong downward move.
5. Tools in Price Action Trading
While price action traders avoid heavy reliance on indicators, they do use certain tools to understand price movement better:
Candlestick Charts – Each candle shows open, high, low, close. Patterns reveal psychology.
Support & Resistance – Zones where price historically reacts.
Trendlines & Channels – Identify slope and direction of market.
Chart Patterns – Triangles, flags, head & shoulders, double tops/bottoms.
Volume (optional) – Confirms strength of moves.
Fibonacci Levels – Identify retracement and extension zones.
6. Candlestick Analysis
Candlestick patterns are the language of price action.
6.1 Single Candlestick Patterns
Pin Bar (Hammer / Shooting Star): Signals rejection of price at a level.
Doji: Market indecision — potential reversal or continuation.
Engulfing Candle: Strong shift in control between buyers and sellers.
6.2 Multi-Candlestick Patterns
Inside Bar: Consolidation before breakout.
Outside Bar: High volatility shift.
Morning/Evening Star: Strong reversal setups.
7. Support & Resistance (S/R)
These are the “battle zones” where buying or selling pressure builds.
Support: Price level where buyers outnumber sellers.
Resistance: Price level where sellers outnumber buyers.
Key Tip: Don’t think of them as thin lines — they’re zones.
8. Price Action Trading Strategies
Here’s where we get to the heart of the game — actionable setups.
8.1 Breakout Trading
Look for price breaking above resistance or below support with strong momentum.
Confirm with retests for higher probability.
8.2 Pullback Trading
Trade in the direction of the trend after a retracement.
Example: In uptrend, wait for price to pull back to support, then buy.
8.3 Pin Bar Reversal
Identify a long-tailed candle rejecting a level.
Trade in the opposite direction of the tail.
8.4 Inside Bar Breakout
Wait for an inside bar to form after strong movement.
Trade in the breakout direction.
8.5 Trendline Bounce
Draw trendlines connecting higher lows (uptrend) or lower highs (downtrend).
Trade bounces off the trendline.
9. Risk Management in Price Action Trading
Even the best setups fail — risk management keeps you in the game.
Stop Loss Placement:
Just beyond recent swing high/low.
Position Sizing:
Risk a fixed % of account (e.g., 1–2%).
Reward-to-Risk Ratio:
Minimum 2:1 for sustainability.
Avoid Overtrading:
Only trade A+ setups.
10. Trading Psychology & Price Action
Price action is as much about mindset as it is about technical skill.
Patience: Wait for the market to come to you.
Discipline: Follow your plan, not your emotions.
Adaptability: Market conditions change — so should you.
Confidence: Comes only from backtesting and experience.
11. Step-by-Step Price Action Trading Plan
Select Market & Timeframe
Example: Nifty futures on 15m chart for intraday.
Identify Market Structure
Uptrend? Downtrend? Range?
Mark Key S/R Levels
From higher timeframes first.
Wait for Setup
Pin bar, inside bar, breakout, pullback.
Confirm Entry
Momentum, volume (optional).
Place Stop Loss
Just beyond invalidation point.
Manage Trade
Partial profits, trailing stop.
Exit
Target hit or reversal signs.
12. Backtesting Price Action Strategies
Before going live:
Backtest at least 50–100 trades.
Note win rate, average R:R ratio, and drawdowns.
Refine entry & exit rules.
Conclusion
Price action trading strips the market down to its most fundamental truth: price movement itself.
By understanding market structure, candlestick patterns, and the psychology behind moves, you can trade with clarity and precision.
It takes time, patience, and discipline — but the payoff is the ability to read the market like a story.

Part 2 Support and ResistanceIntroduction to Options Trading
Options trading is one of the most flexible and powerful tools in the financial markets. Unlike stocks, where you simply buy and sell ownership of a company, options are derivative contracts that give you the right, but not the obligation, to buy or sell an underlying asset at a predetermined price within a specified time frame.
The beauty of options lies in their strategic possibilities — they allow traders to make money in rising, falling, or even sideways markets, often with less capital than buying stocks outright. But with that flexibility comes complexity, so understanding strategies is crucial.
Key Terms in Options Trading
Before we jump into strategies, let’s understand the key terms:
Call Option – Gives the right to buy the underlying asset at a fixed price (strike price) before expiry.
Put Option – Gives the right to sell the underlying asset at a fixed price before expiry.
Strike Price – The price at which you can buy/sell the asset.
Premium – The price you pay to buy an option.
Expiry Date – The date the option contract ends.
ITM (In-the-Money) – When exercising the option would be profitable.
ATM (At-the-Money) – Strike price is close to the current market price.
OTM (Out-of-the-Money) – Option has no intrinsic value yet.
Lot Size – Minimum number of shares/contracts per option

Support and ResistancePsychological Factors
Options trading is mentally challenging:
Overconfidence after a win can cause big losses.
Patience is key — many setups fail if entered too early.
Emotional control matters more than strategy.
Pro Tips for Successful Options Trading
Master 2-3 strategies before trying complex ones.
Use paper trading to practice.
Keep an eye on Option Chain data — OI buildup can hint at support/resistance.
Avoid holding long options to expiry unless sure — time decay will hurt.
Final Thoughts
Options trading is like a Swiss Army knife — powerful but dangerous if misused. With the right strategy, discipline, and risk management, traders can profit in any market condition. Whether you’re buying a simple call or building a complex Iron Condor, always remember: the market rewards preparation and patience.

Option Trading Practical Trading Examples
Let’s take a real-world India market scenario:
Event: Union Budget Day
High volatility expected.
Strategy: Buy Straddle (ATM CE + ATM PE).
Result: If NIFTY jumps or crashes by 300 points, profits can be significant.
Event: Stock Result Announcement (Infosys)
Medium move expected.
Strategy: Strangle (slightly OTM CE + OTM PE).
Result: Lower cost, profitable if stock moves big.
Risk Management in Options Trading
Options can wipe out capital quickly if used recklessly.
Follow these rules:
Never risk more than 2% of capital per trade.
Avoid over-leveraging — options give leverage, don’t overuse it.
Use stop-losses.
Avoid buying far OTM options unless speculating small amounts.
Track implied volatility — don’t overpay in high-IV environments.

PCR Trading StrategyHedging with Options
Hedging protects your portfolio.
Portfolio Hedge with Index Options
Buy index puts to protect against market crashes.
Example: NIFTY at 20,000, buy 19,800 PE to offset losses in stocks.
Covered Puts for Short Positions
For traders shorting stocks, selling puts can hedge upside risk.
Advanced Option Concepts in Trading
To master strategies, you must understand Option Greeks:
Delta – Measures price change sensitivity.
Gamma – Measures delta’s rate of change.
Theta – Time decay rate.
Vega – Sensitivity to volatility changes.
Rho – Interest rate sensitivity.
Example: If you’re buying options before a big earnings announcement, Vega is crucial — higher volatility increases option value.

Part 8 Trading Master ClassProtective Put
When to Use: To insure against downside.
Setup: Own stock + Buy put option.
Risk: Premium paid.
Reward: Stock can rise, but downside is protected.
Example: Own TCS at ₹3,000, buy 2,900 PE for ₹50.
Bull Call Spread
When to Use: Expect moderate rise.
Setup: Buy lower strike call + Sell higher strike call.
Risk: Limited.
Reward: Limited.
Example: Buy 20,000 CE @ ₹100, Sell 20,200 CE @ ₹50.
Bear Put Spread
When to Use: Expect moderate fall.
Setup: Buy higher strike put + Sell lower strike put.
Risk: Limited.
Reward: Limited.

BTC Update 15th august BTC recovers the inefficiency left on10th July, bouncing on the support level at 111K and returning on the last target, in the red zone.
From a technical point, this is could be forecast following the empty zone, as the wick on July 14th, which underlines a POL (point of liquidity), also supported by the heatmap liquidation.
Fundamentally, this new sphere of positivity and institutional adoption is helping BTC's rally to conclude this cycle with the utter targets.
The grow in the past cycle is been sustained- less hyped than the previous two. Both due to the high currency price of the Big coin, which makes difficult have a high percentage changes in short time, and due the consistent consolidation of the VIX index. At the same time, the entrance of new institutional players, as side general traders, investors and big whales, has stabilized a bit the market in terms of entrance and exit, make it more forecastable and stable.
New targets in the next post.
Thanks for reading,
M

Part 1 Master Candlesticks PatternDirectional Strategies
These are for traders with a clear market view.
Long Call (Bullish)
When to Use: Expecting significant upward movement.
Setup: Buy a call option.
Risk: Limited to premium paid.
Reward: Unlimited.
Example: NIFTY at 20,000, you buy 20,100 CE for ₹100 premium. If NIFTY closes at 20,500, your profit = ₹400 - ₹100 = ₹300.
Long Put (Bearish)
When to Use: Expecting price drop.
Setup: Buy a put option.
Risk: Limited to premium.
Reward: Large if the asset falls.
Example: Stock at ₹500, buy 480 PE for ₹10. If stock drops to ₹450, profit = ₹30 - ₹10 = ₹20.
Covered Call (Mildly Bullish)
When to Use: Own the stock but expect limited upside.
Setup: Hold stock + Sell call option.
Risk: Stock downside risk.
Reward: Premium income + stock gains until strike price.
Example: Own Reliance at ₹2,500, sell 2,600 CE for ₹20 premium.

Gold Trading Strategy XAUUSD August 14, 2025Gold Trading Strategy XAUUSD August 14, 2025:
Gold prices continued to rise in the European session on August 13, 2025 as mild US inflation data raised expectations of a Federal Reserve rate cut in September, while a weaker US dollar also boosted demand for gold.
Fundamental news: The US labor market report earlier this month initially weighed on the greenback, but the latest US CPI data added pressure as it did not show a clear acceleration in inflation due to tariffs in July. The inflation data reinforced the possibility that the Fed will take a more dovish stance in September, which is what the market is expecting.
Technical analysis: After a deep correction to the 3330 area, gold prices showed signs of increasing again. On the H1 frame, an upward price channel has been formed, but the current MA lines are still moving sideways, not showing a clear trend. The 3350 - 3355 area will be the important area to decide whether this uptrend channel can hold or not. RSI on H1 and H4 timeframes has entered the buy zone, this is a very good condition for us to trade. We will trade at the support zones and large liquidity zones of gold prices.
Important price zones today: 3350 - 3355, 3335 - 3340.
Today's trading trend: BUY.
Recommended orders:
Plan 1: BUY XAUUSD zone 3350 - 3352
SL 3347
TP 3355 - 3365 - 3375 - 3390.
Plan 2: BUY XAUUSD zone 3335 - 3337
SL 3332
TP 3340 - 3350 - 3370 - 3390.
Plan 3: SELL XAUUSD zone 3388 - 3390
SL 3393
TP 3385 - 3375 - 3365 - 3355 (small volume).
Wish you a safe, successful and profitable trading day.🥰🥰🥰🥰🥰

Retail vs Institutional Trading1. Introduction
In financial markets, traders can be broadly categorized into two groups: retail traders and institutional traders. While both operate in the same markets—stocks, forex, commodities, derivatives, cryptocurrencies—their goals, resources, and impact differ significantly.
Think of it like a chess game:
Retail traders are like passionate hobbyists, playing with personal strategies, smaller capital, and limited tools.
Institutional traders are like grandmasters with advanced chess engines, big teams, and massive resources.
Understanding the differences between these two groups is crucial for anyone involved in trading because:
It helps retail traders set realistic expectations.
It reveals how market moves are often driven by institutional flows.
It allows traders to align their strategies with the "big money" rather than fighting against it.
2. Defining the Players
Retail Traders
Who they are: Individual traders using their own capital to trade.
Examples: You, me, the average person with a brokerage account.
Capital size: Typically from a few hundred to a few hundred thousand dollars.
Trading style: Often short-term speculation, swing trading, or occasional long-term investing.
Motivation: Profit, financial freedom, hobby, or passive income.
Institutional Traders
Who they are: Professional traders working for large organizations, handling pooled funds.
Examples: Hedge funds, mutual funds, pension funds, banks, proprietary trading firms.
Capital size: Millions to billions of dollars.
Trading style: Long-term positions, algorithmic trading, arbitrage, high-frequency trading.
Motivation: Generate consistent returns for clients/investors, maintain market share, and manage risk.
3. Key Differences Between Retail & Institutional Trading
Aspect Retail Trading Institutional Trading
Capital Small, personal funds Huge pooled funds
Execution speed Slower, via broker platforms Ultra-fast, often via direct market access
Tools & technology Basic charting tools, retail brokers Advanced analytics, proprietary algorithms
Market impact Negligible Can move markets significantly
Risk tolerance Usually higher (due to smaller size) Often lower per trade but diversified
Regulations Fewer compliance rules Strict regulatory oversight
Information access Public data, delayed feeds Direct market data, insider networks (legal)
Strategy type Swing/day trading, small-scale strategies Large-scale arbitrage, hedging, portfolio balancing
4. Trading Infrastructure & Technology
Retail
Uses broker platforms like Zerodha, Upstox, Robinhood, E*TRADE.
Relies on charting software (TradingView, MetaTrader).
Order execution passes through multiple intermediaries, adding milliseconds or seconds of delay.
Limited access to Level 2 data and dark pool information.
Institutional
Uses Direct Market Access (DMA), bypassing middlemen.
Employs co-location — placing servers physically close to exchange data centers to reduce latency.
Custom-built AI-driven trading algorithms.
Access to Bloomberg Terminal, Reuters Eikon—costing thousands of dollars a month.
5. Market Impact
Retail Traders’ Impact
Individually, they have minimal effect on price.
Collectively, they can cause temporary market surges—e.g., GameStop 2021 short squeeze.
Often act as liquidity providers for institutional strategies.
Institutional Traders’ Impact
Can move prices by large orders.
Use order slicing (Iceberg Orders) to hide trade size.
Influence market sentiment through research, investment reports, and large portfolio shifts.
6. Trading Strategies
Retail Strategies
Day Trading – Quick in-and-out trades within the same day.
Swing Trading – Holding for days or weeks based on technical setups.
Trend Following – Buying in uptrends, selling in downtrends.
Breakout Trading – Entering when price breaches support/resistance.
Options Trading – Buying calls/puts for leveraged moves.
Copy Trading – Following successful traders’ trades.
Institutional Strategies
Algorithmic Trading – Automated, high-speed trade execution.
Market Making – Providing liquidity by quoting buy and sell prices.
Arbitrage – Exploiting price differences between markets.
Quantitative Strategies – Using statistical models for predictions.
Index Fund Management – Matching market indexes like S&P 500.
Hedging & Risk Management – Using derivatives to protect portfolios.
7. Advantages & Disadvantages
Retail Advantages
Flexibility: No need to report to clients.
Ability to take high-risk/high-reward bets.
Can enter/exit positions quickly due to small size.
Niche opportunities—small-cap stocks, micro trends.
Retail Disadvantages
Lack of insider or early information.
Higher transaction costs (relative to trade size).
Emotional trading—fear & greed affect decisions.
Lower technology access.
Institutional Advantages
Massive capital for diversification.
Best technology, research, and execution speeds.
Influence over market movements.
Access to private deals (private placements, IPO allocations).
Institutional Disadvantages
Large orders can move the market against them.
Regulatory and compliance burden.
Slower decision-making (bureaucracy).
Public scrutiny.
8. Regulatory Environment
Retail Traders:
Must follow general market rules set by SEBI (India), SEC (US), FCA (UK), etc.
Brokers are regulated; traders themselves are less scrutinized unless committing fraud.
Institutional Traders:
Heavily monitored by regulators.
Must follow reporting rules, such as 13F filings in the US.
Must ensure compliance with anti-money laundering (AML) and know-your-customer (KYC) laws.
9. Psychological Factors
Retail
Driven by emotions, social media hype, and news.
Prone to FOMO (Fear of Missing Out) and panic selling.
Often lack structured trading plans.
Institutional
Decisions made by teams, not individuals.
Uses risk-adjusted returns as a guiding principle.
Employs psychologists and behavioral finance experts to reduce bias.
10. Case Studies
GameStop 2021 – Retail Power
Retail traders on Reddit’s WallStreetBets caused a short squeeze.
Institutional short-sellers lost billions.
Showed that coordinated retail action can disrupt markets temporarily.
Flash Crash 2010 – Algorithmic Impact
Institutional algorithmic trading caused rapid market drops and rebounds.
Retail traders were mostly spectators.
Final Thoughts
Retail and institutional traders are two sides of the same market coin.
Retail traders bring diversity and liquidity, while institutional traders bring stability and efficiency—most of the time.
For retail traders, the key is to stop fighting institutional flows and instead follow their footprints. By understanding where big money is moving and aligning with it, retail traders can dramatically improve their odds of success.
In essence:
Institutional traders are the elephants in the market jungle.
Retail traders are the birds — smaller, more agile, able to grab quick opportunities the elephants can’t.
Economic Impact on Markets Introduction
Financial markets don’t move in isolation — they are deeply connected to the health and direction of the global and domestic economy. Every trader, whether in equities, commodities, currencies, or bonds, must understand that prices reflect not only company fundamentals or technical chart patterns but also broader economic forces.
Economic events and indicators act like weather reports for the market: they give traders a forecast of potential sunny growth or stormy recessions. This understanding allows traders to anticipate moves, manage risks, and identify opportunities.
In this guide, we’ll explore how economic factors impact markets, the key indicators to monitor, historical examples, and trading strategies to navigate different economic environments.
1. The Relationship Between Economy and Markets
The economy and markets are intertwined through several mechanisms:
Corporate Earnings Connection – A growing economy increases consumer spending and corporate profits, pushing stock prices higher.
Liquidity & Credit Cycle – Economic booms encourage lending, while slowdowns make credit expensive, impacting investments.
Risk Appetite – In good times, investors embrace risk; in downturns, they flock to safe assets like gold or government bonds.
Globalization Effects – Economic changes in one major country (e.g., the U.S., China) can ripple into global markets via trade, currency flows, and commodities.
Think of the market as a mirror of economic sentiment — sometimes slightly distorted by speculation, but largely reflecting real economic conditions.
2. Major Economic Indicators That Move Markets
Traders watch a set of macro indicators to gauge economic strength or weakness. These numbers often trigger sharp price moves.
2.1 GDP (Gross Domestic Product)
Definition: The total value of goods and services produced in a country.
Impact: Strong GDP growth signals economic expansion — bullish for stocks, bearish for bonds (due to potential rate hikes).
Example: U.S. Q2 2021 GDP growth of 6.7% boosted cyclical stocks like banks and industrials.
2.2 Inflation Data (CPI, WPI, PPI)
Consumer Price Index (CPI): Measures retail price changes.
Wholesale Price Index (WPI): Measures wholesale market price changes.
Producer Price Index (PPI): Measures production cost changes.
Impact: High inflation often prompts central banks to raise interest rates, which can hurt equity markets but benefit commodities.
Example: India’s CPI rising above 7% in 2022 led to RBI rate hikes and a correction in Nifty.
2.3 Employment Data
Non-Farm Payrolls (U.S.): Key job creation figure.
Unemployment Rate: Measures the percentage of jobless workers.
Impact: Strong job growth indicates economic health but can lead to inflationary pressures.
Example: U.S. unemployment dropping to 3.5% in 2019 fueled Fed tightening.
2.4 Interest Rates (Repo, Fed Funds Rate)
Central banks adjust rates to control inflation and stimulate or slow the economy.
Low rates encourage borrowing → boosts markets.
High rates slow growth → bearish for stocks, bullish for the currency.
2.5 Trade Balance & Currency Data
Surplus boosts domestic currency; deficit weakens it.
Currencies directly impact exporters/importers and global market flows.
2.6 PMI (Purchasing Managers’ Index)
Above 50 = expansion; below 50 = contraction.
Often moves manufacturing stocks.
3. Channels Through Which Economy Impacts Markets
3.1 Corporate Earnings Channel
Economic growth → higher sales → better earnings → higher stock valuations.
3.2 Consumer Spending & Confidence
Economic stability makes consumers spend more, benefiting retail, auto, and travel sectors.
3.3 Investment & Credit Flow
Low interest rates make borrowing cheaper for businesses, boosting capital investments.
3.4 Currency Valuation
A strong economy strengthens the currency, benefiting importers but hurting exporters.
3.5 Commodity Prices
Economic booms increase demand for oil, metals, and agricultural products.
4. Sectoral Impacts of Economic Conditions
4.1 During Economic Expansion
Winners: Cyclical sectors (banks, autos, infrastructure, luxury goods)
Laggards: Defensive sectors (FMCG, utilities) underperform relative to cyclical stocks.
4.2 During Economic Slowdown
Winners: Defensive sectors (healthcare, utilities, consumer staples)
Laggards: Cyclical sectors, high-debt companies.
4.3 High Inflation Environment
Winners: Commodity producers (metals, energy)
Laggards: Bond markets, growth stocks.
5. Historical Examples of Economic Impact on Markets
5.1 Global Financial Crisis (2008)
Triggered by U.S. housing collapse & credit crunch.
Nifty 50 fell over 50%.
Central banks cut rates to near zero.
5.2 COVID-19 Pandemic (2020)
GDP contraction globally.
Sharp sell-off in March 2020, followed by a massive rally due to stimulus.
Tech and pharma outperformed due to remote work & healthcare demand.
5.3 2022 Inflation & Rate Hikes
Surging commodity prices + supply chain disruptions.
Fed & RBI aggressive tightening → market volatility.
6. Trading Strategies for Different Economic Scenarios
6.1 Expansion Phase
Strategy: Buy cyclical growth stocks, high-beta sectors, small caps.
Risk: Overheated valuations.
6.2 Peak Phase
Strategy: Rotate into defensive stocks, lock profits in high-growth positions.
6.3 Recession Phase
Strategy: Defensive stocks, gold, bonds, short-selling indices.
6.4 Recovery Phase
Strategy: Gradually add cyclical exposure, focus on undervalued growth plays.
7. Economic Events Traders Should Track
Monetary Policy Meetings (RBI, Fed, ECB)
Budget Announcements
Corporate Earnings Season
Global Trade Agreements
Geopolitical Tensions
8. Risk Management in Economic-Driven Markets
Stay Hedged: Use options or inverse ETFs.
Diversify: Across sectors and asset classes.
Set Stop Losses: Especially during high-volatility data releases.
Don’t Trade Blind: Always check the economic calendar before placing trades.
9. Final Thoughts
Economic forces are the engine driving market movement. A trader who understands GDP trends, inflation patterns, interest rate cycles, and sectoral dynamics can navigate markets more effectively than someone relying only on chart patterns.
Markets anticipate — they often move before economic reports confirm the trend. This means the most successful traders not only react to data but also position themselves ahead of it, using both macroeconomic insights and technical signals.
Crypto Trading Strategies1. Introduction
Cryptocurrency trading has evolved from a niche hobby into a multi-trillion-dollar global market. Since the launch of Bitcoin in 2009, digital assets have grown in variety, market capitalization, and adoption. Today, traders have access to thousands of cryptocurrencies — from large-cap giants like Bitcoin (BTC) and Ethereum (ETH) to small-cap altcoins and DeFi tokens.
However, trading crypto is not just about buying low and selling high. It's about mastering strategies that suit the market's unique volatility, liquidity, and round-the-clock nature.
In this guide, we will explore different crypto trading strategies, breaking them down into short-term, medium-term, and long-term approaches. We’ll cover technical, fundamental, and sentiment analysis, along with tools, indicators, and risk management.
2. Characteristics of the Crypto Market
Before diving into strategies, it's essential to understand what makes the crypto market different from traditional markets:
24/7 Trading:
Unlike stock markets, cryptocurrencies trade all day, every day, without holidays.
High Volatility:
Price swings of 5–20% in a day are common, offering opportunities — and risks.
Decentralized Nature:
No single authority controls the market, which reduces regulatory safeguards but increases freedom.
Liquidity Variance:
Large-cap coins like BTC have high liquidity, while smaller altcoins can be illiquid and more volatile.
Market Sentiment Driven:
News, tweets, and community hype can significantly impact price movements.
3. Types of Crypto Trading Strategies
We can broadly classify strategies into short-term, medium-term, and long-term.
A. Short-Term Crypto Trading Strategies
These strategies aim to profit from quick price fluctuations over minutes, hours, or a few days.
1. Scalping
Definition:
Scalping involves making dozens or even hundreds of trades per day to profit from small price changes.
How It Works:
Traders look for tiny price gaps in order book spreads or reaction to short-term momentum.
Positions are often held for seconds to minutes.
Tools & Indicators:
1-minute to 5-minute charts
Moving Averages (MA)
Bollinger Bands
Order book depth
Advantages:
Frequent trading opportunities.
Lower exposure to overnight risks.
Disadvantages:
High transaction fees can eat profits.
Requires quick decision-making and focus.
2. Day Trading
Definition:
Opening and closing trades within the same day to avoid overnight market exposure.
How It Works:
Identify intraday trends using technical analysis.
Close positions before daily candle ends.
Key Indicators:
Relative Strength Index (RSI)
Moving Average Convergence Divergence (MACD)
Volume analysis
Example:
If Bitcoin breaks a resistance level at $65,000 with strong volume, a day trader might buy, targeting $66,500 with a stop loss at $64,700.
3. Momentum Trading
Definition:
Trading based on the strength of current market trends.
How It Works:
Enter trades when momentum indicators signal strong buying or selling pressure.
Ride the trend until signs of reversal appear.
Indicators:
RSI above 70 (overbought) or below 30 (oversold)
MACD crossovers
Trendlines
4. Arbitrage
Definition:
Profiting from price differences of the same asset across different exchanges.
Example:
If BTC is trading at $65,000 on Binance and $65,300 on Kraken, a trader buys on Binance and sells on Kraken for a quick profit.
Types of Arbitrage:
Cross-exchange arbitrage
Triangular arbitrage (between three pairs)
Challenges:
Execution speed
Transaction fees and withdrawal times
B. Medium-Term Crypto Trading Strategies
These involve holding positions from days to weeks.
5. Swing Trading
Definition:
Capturing medium-term trends or price “swings” within a larger trend.
How It Works:
Analyze 4-hour to daily charts.
Enter during pullbacks in an uptrend or rallies in a downtrend.
Indicators:
Fibonacci retracement levels
Moving averages
Trendlines
Example:
If Ethereum rises from $2,000 to $2,500, pulls back to $2,300, and resumes upward momentum, a swing trader might buy targeting $2,700.
6. Breakout Trading
Definition:
Entering trades when price breaks through a defined support or resistance level.
How It Works:
Identify key chart levels.
Trade the breakout with confirmation from volume.
Indicators:
Bollinger Band squeeze
Volume spikes
Price action
7. Range Trading
Definition:
Buying at support and selling at resistance in sideways markets.
Example:
If Cardano (ADA) trades between $0.90 and $1.10 for weeks, a range trader buys near $0.90 and sells near $1.10 repeatedly.
C. Long-Term Crypto Trading Strategies
These strategies involve holding positions for months or years.
8. HODLing
Definition:
A misspelling of "hold" that became a crypto meme — essentially buy and hold.
How It Works:
Invest in fundamentally strong projects.
Ignore short-term volatility.
Example:
Buying Bitcoin at $3,000 in 2018 and holding until $60,000 in 2021.
9. Value Investing in Crypto
Definition:
Identifying undervalued coins based on fundamentals like technology, adoption, and tokenomics.
Factors to Consider:
Whitepaper quality
Developer activity
Community engagement
Real-world use cases
10. Staking & Yield Farming
Definition:
Earning passive income by locking coins in proof-of-stake networks or DeFi protocols.
Advantages:
Steady returns
Increases total holdings
Risks:
Smart contract bugs
Impermanent loss in liquidity pools
4. Technical Analysis in Crypto Strategies
Most crypto strategies rely on technical analysis (TA). Key TA concepts:
Trend Identification
Uptrend: Higher highs, higher lows
Downtrend: Lower highs, lower lows
Support & Resistance
Psychological levels like round numbers often act as barriers.
Indicators
RSI
MACD
Moving Averages
Bollinger Bands
Volume Profile
Candlestick Patterns
Doji, engulfing, hammer patterns
5. Fundamental Analysis in Crypto
FA in crypto focuses on project fundamentals:
Whitepaper analysis
Tokenomics (supply, burn rate)
Team credibility
Roadmap progress
Partnerships and adoption
6. Sentiment Analysis
Crypto markets are heavily sentiment-driven.
Tools like LunarCrush, Santiment, and Twitter activity tracking can gauge market mood.
7. Risk Management in Crypto Trading
Never invest more than you can afford to lose.
Use stop losses.
Limit leverage (especially in volatile markets).
Diversify portfolio.
8. Common Mistakes to Avoid
Overtrading
Ignoring stop-loss rules
FOMO (Fear of Missing Out) buying
Lack of research
Excessive leverage
9. Tools for Crypto Trading
Exchanges: Binance, Coinbase, Kraken
Charting: TradingView
Portfolio Tracking: CoinMarketCap, CoinGecko
Automation: 3Commas, Pionex
10. Final Thoughts
Crypto trading can be extremely rewarding but also risky due to unpredictable volatility. A successful trader understands the market’s behavior, uses clear strategies, and follows strict risk management.
The choice between scalping, swing trading, or HODLing depends on your time availability, risk tolerance, and skill level.

Breakout & Breakdown Strategies in Trading1. Introduction
Trading is not just about buying low and selling high—it’s about identifying when the market is ready to move decisively in a particular direction. Among the most powerful price action-based methods, Breakout and Breakdown strategies have earned their place as timeless tools in a trader’s arsenal.
Breakout: When the price pushes above a significant resistance level or price consolidation zone, signaling potential bullish momentum.
Breakdown: When the price falls below a significant support level or consolidation zone, signaling potential bearish momentum.
The reason these strategies are so popular is simple: when price escapes a strong level, it often triggers a wave of orders—both from new traders entering the market and from existing traders closing losing positions. This can create explosive moves.
2. Understanding Market Structure
Before diving into strategies, it’s important to understand how the market’s “architecture” works.
2.1 Support and Resistance
Support is a price level where buying interest tends to emerge, preventing the price from falling further.
Resistance is a price level where selling pressure tends to emerge, preventing the price from rising further.
A breakout happens when resistance is breached, and a breakdown occurs when support is breached.
2.2 Consolidation Zones
Markets often move sideways before a breakout or breakdown. These “tight” ranges reflect indecision. The tighter the range, the stronger the potential move after the breakout.
2.3 Market Participants
Understanding who’s involved can help:
Retail traders often chase moves.
Institutions accumulate positions quietly during consolidation.
Algorithmic traders may trigger breakouts with large volume spikes.
3. Market Psychology Behind Breakouts & Breakdowns
Price movements are not just numbers; they reflect human emotions—fear, greed, and uncertainty.
3.1 Breakouts
Traders waiting for confirmation jump in as soon as resistance breaks.
Short sellers may cover their positions (buy to exit), adding buying pressure.
Momentum traders and algorithms pile on, accelerating the move.
3.2 Breakdowns
Long holders panic and sell when support breaks.
Short sellers initiate fresh positions.
Stop-loss orders below support get triggered, adding to the downward momentum.
3.3 False Breakouts/Breakdowns
Not every breakout is genuine—sometimes price quickly returns inside the range. This is often due to:
Low volume breakouts.
Manipulative “stop-hunting” by large players.
News events reversing sentiment.
4. Types of Breakout & Breakdown Setups
4.1 Horizontal Level Breakouts
Price breaks a clearly defined horizontal resistance or support.
Works best when levels are tested multiple times before the break.
4.2 Trendline Breakouts
A downward sloping trendline break signals bullish potential.
An upward sloping trendline break signals bearish potential.
4.3 Chart Pattern Breakouts
Ascending Triangle → Breaks upward most often.
Descending Triangle → Breaks downward most often.
Flags/Pennants → Continuation patterns after a sharp move.
Head and Shoulders → Breakdown after neckline breach.
4.4 Range Breakouts
Price has been moving sideways; breaking the range signals a new directional trend.
4.5 Volatility Breakouts
Using Bollinger Bands or ATR to identify when volatility expansion may trigger breakouts.
5. Technical Tools for Breakout & Breakdown Trading
5.1 Volume Analysis
Genuine breakouts usually have above-average volume.
A price breakout without volume can be a trap.
5.2 Moving Averages
Breakouts above the 50-day or 200-day MA often attract attention.
Crossovers can confirm breakouts.
5.3 Bollinger Bands
Breakout beyond the upper band often signals bullish continuation.
Breakdown beyond the lower band often signals bearish continuation.
5.4 Average True Range (ATR)
Helps set stop-losses based on market volatility.
Breakouts with ATR expansion are more reliable.
5.5 RSI & Momentum Indicators
RSI crossing above 50 during a breakout supports bullishness.
Divergences can warn against false moves.
6. Step-by-Step Breakout Trading Strategy
Let’s break down a long breakout strategy:
Identify Key Level
Mark strong resistance levels or consolidation highs.
Wait for Price to Approach
Avoid preemptively entering; wait until price tests the level.
Check Volume Confirmation
Look for higher-than-average volume during the breakout candle.
Entry Trigger
Enter after a candle closes above resistance, not just a wick.
Stop-Loss Placement
Place SL below the breakout candle’s low or below the last swing low.
Profit Targets
First target: Equal to range height.
Second target: Use trailing stop to capture more upside.
7. Step-by-Step Breakdown Trading Strategy
For a short breakdown strategy:
Identify Strong Support
Multiple touches strengthen the level.
Observe Price Action
Watch for compression near support.
Volume Confirmation
High volume on breakdown increases reliability.
Entry
Enter after candle closes below support.
Stop-Loss
Above the breakdown candle high or last swing high.
Profit Targets
First: Range height projection.
Second: Trail stop for extended moves.
8. Risk Management
Breakout and breakdown trading is high-reward but also high-risk without proper risk controls.
8.1 Position Sizing
Risk only 1–2% of capital per trade.
8.2 Avoid Overtrading
Not every breakout is worth trading—quality over quantity.
8.3 Stop-Loss Discipline
Never widen stops once placed.
8.4 Recognizing False Breakouts
No volume surge.
Price rejection at the breakout point.
Sudden reversal candles (shooting star, hammer).
9. Advanced Tips for Success
9.1 Multi-Timeframe Analysis
Confirm breakouts on higher timeframes for reliability.
9.2 Retest Entries
Instead of chasing the breakout, wait for price to retest the broken level and bounce.
9.3 Combine With Indicators
MACD crossovers, RSI breakouts, or Ichimoku Cloud confirmations can filter false signals.
9.4 Avoid News-Driven Breakouts
These are often short-lived spikes unless supported by strong fundamentals.
10. Real-World Example
Breakout Example
Stock consolidates between ₹950–₹1000 for weeks.
Volume surges as it closes at ₹1015.
Entry at ₹1015, SL at ₹990.
Price rallies to ₹1080 within days.
Breakdown Example
Nifty support at 19,800 tested thrice.
Price closes at 19,750 with high volume.
Short entry at 19,750, SL at 19,880.
Price drops to 19,500.
11. Pros and Cons
Pros:
Captures explosive moves early.
Works in all markets (stocks, forex, crypto).
High reward-to-risk potential.
Cons:
False breakouts can be frustrating.
Requires discipline to wait for confirmation.
Volatility can trigger stop-losses before the real move.
12. Summary Table: Breakout vs Breakdown
Feature Breakout (Long) Breakdown (Short)
Key Level Resistance Support
Volume Signal High volume on upward candle High volume on downward candle
Stop-Loss Below breakout candle low Above breakdown candle high
Target Range height or trend ride Range height or trend ride
13. Final Thoughts
Breakout and breakdown strategies work because they align with the natural order flow of the market—when key levels are breached, they often trigger a flood of buying or selling activity. However, success depends heavily on patience, confirmation, and risk management.
A trader who learns to differentiate between a true breakout and a false move has a powerful edge. By combining technical levels, volume analysis, and disciplined execution, breakout/breakdown trading can become a cornerstone strategy in any trading plan.
Building a Consistent Trading PlanIntroduction
Trading without a plan is like sailing without a compass — you may catch some winds, but without direction, you’ll eventually drift into trouble. A consistent trading plan is the blueprint that guides your decision-making, helps control your emotions, and allows you to measure performance objectively. It’s the difference between gambling and structured, calculated trading.
In this guide, we’ll explore how to build a complete trading plan from scratch, the core components every trader must include, the psychological discipline needed, and real-world implementation steps to maintain consistency.
1. Why a Trading Plan Matters
Before we start building, let’s understand the why.
Removes Emotional Decision-Making
Without a plan, traders tend to react impulsively to market moves, buying out of greed or selling out of fear. A trading plan gives a predefined set of rules, reducing emotional bias.
Creates Measurable Consistency
Consistency is key in trading. A trading plan ensures that every trade is based on the same logic, making it easier to identify strengths and weaknesses in your approach.
Improves Risk Management
It forces you to define how much you’re willing to lose per trade and per day/week/month, helping to protect your capital.
Enables Continuous Improvement
When you follow a documented plan, you can review your trades, find patterns in mistakes, and improve over time.
2. Foundations of a Trading Plan
A good trading plan rests on four pillars:
Clear goals – Defining what you want to achieve and in what timeframe.
Trading strategy – How you find, enter, and exit trades.
Risk management – Protecting capital and managing exposure.
Psychological discipline – Staying consistent under stress.
Step 1: Define Your Trading Goals
Your goals need to be Specific, Measurable, Achievable, Relevant, and Time-bound (SMART).
Example:
Earn 3% per month on average.
Limit monthly drawdown to 5%.
Execute no more than 20 trades per month.
Review performance weekly.
Long-term vs. Short-term goals:
Short-term: Develop discipline, avoid overtrading, stick to stop-loss rules.
Long-term: Build a track record, scale position sizes, move toward full-time trading.
Step 2: Choose Your Trading Style
Different trading styles require different plans. Choose the one that matches your time availability, personality, and capital.
Trading Style Holding Time Time Commitment Risk Profile Example Assets
Scalping Seconds–Minutes High High Forex, Index Futures
Day Trading Minutes–Hours High High Stocks, Commodities
Swing Trading Days–Weeks Medium Medium Equities, ETFs
Position Trading Weeks–Months Low Low Stocks, Bonds
Step 3: Select Your Market & Instruments
A trading plan should specify exactly what markets you trade to avoid distraction.
Example:
Markets: Nifty50, Bank Nifty, Gold, EUR/USD
Instruments: Futures, Options, Spot Market
Avoid spreading yourself too thin — mastering one market is more profitable than dabbling in many.
3. Core Components of a Trading Plan
Let’s break down exactly what to include in your plan.
A. Entry Criteria
Clearly define the conditions that must be met before you enter a trade.
Example (Technical-based Entry):
Price must be above the 50 EMA for long trades.
Entry trigger: Breakout of last swing high with above-average volume.
Confirmation: RSI above 50 but below overbought.
Example (Fundamental-based Entry):
Quarterly earnings growth > 20%.
Stock in strong sector outperforming the market.
Institutional buying trend confirmed.
Tip: Avoid vague signals like “when I feel it’s right” — your rules should be objective and back-testable.
B. Exit Criteria
Exits are more important than entries for profitability.
Two types of exits:
Stop Loss Exit – A predefined loss limit per trade.
Target Profit Exit – A predefined profit goal, or trailing stop for trend-following.
Example:
Stop Loss: 1.5% below entry.
Target: 3% above entry (2:1 reward-to-risk ratio).
Trailing Stop: Move stop to breakeven after 1% gain.
C. Risk Management Rules
Without risk control, even the best strategy will fail.
Key Rules:
Risk per trade: 1–2% of capital.
Max daily loss: 4% of capital.
Max open positions: 3 at a time.
Position sizing formula:
Position Size = (Account Size × Risk %) / Stop Loss (in price terms)
Example:
Account Size = ₹5,00,000
Risk per trade = 1% = ₹5,000
Stop loss distance = ₹10
Position size = 500 shares.
D. Money Management
Money management focuses on how profits are reinvested and how losses are recovered.
Approaches:
Fixed Fractional: Risk a fixed percentage of current equity.
Kelly Criterion: Optimize bet size based on historical win rate and payoff ratio.
Scaling In/Out: Increase size in winning trades, reduce exposure in losing trades.
E. Trade Management
Trade management deals with what you do after entering a trade.
Do you let profits run or take partial profits?
Do you move your stop loss after a certain gain?
Do you hedge positions?
A strong trading plan has exact decision points for trade management.
F. Trading Journal
A trading journal is non-negotiable. It records:
Date & time
Market & instrument
Entry & exit price
Stop loss & target
Trade rationale
Result (profit/loss)
Emotional state
Why it’s important: Reviewing past trades exposes patterns of mistakes and successes.
4. Psychological Discipline in Trading
A trading plan is useless if you don’t follow it.
Key Mental Challenges:
Fear of Missing Out (FOMO) – Chasing moves without confirmation.
Revenge Trading – Trying to recover losses quickly.
Overtrading – Taking too many trades without quality setups.
Loss Aversion – Cutting winners too early and letting losers run.
Solutions:
Pre-market checklist.
Daily routine.
Accountability partner or trading community.
Meditation or breathing exercises to reset focus.
5. Backtesting and Forward Testing
Before trading live, your plan must be tested.
Backtesting:
Test your strategy on at least 1–2 years of historical data.
Track win rate, average profit/loss, drawdowns.
Forward Testing (Paper Trading):
Execute trades in a simulated account.
Evaluate performance under current market conditions.
6. Building Your Trading Routine
Consistency comes from habits.
Pre-Market Routine:
Review overnight news.
Identify key support/resistance levels.
Prepare watchlist.
Plan possible entry/exit levels.
During Market Hours:
Follow plan strictly.
Avoid unplanned trades.
Post-Market Routine:
Review trades.
Update journal.
Analyze mistakes.
7. Continuous Improvement
The market evolves — so should your plan.
Monthly Review Checklist:
What rules did I break?
Which setups worked best?
Is my win rate improving?
Is my risk/reward ratio holding?
Quarterly Updates:
Adjust stop loss levels.
Modify position sizing.
Test new indicators or filters.
8. Common Mistakes to Avoid
Trading multiple strategies without mastery.
Ignoring risk rules after a streak of wins.
Changing strategies too often.
Not accounting for transaction costs and slippage.
9. Example of a Simple Trading Plan
Trading Style: Swing Trading
Market: Nifty50 stocks
Strategy: 50 EMA trend-follow with RSI confirmation
Entry Rules:
Price above 50 EMA.
RSI between 50–70.
Breakout of last 10-day high with volume spike.
Exit Rules:
Stop Loss: 2% below entry.
Target: 4% above entry or trailing stop.
Risk Management:
Risk per trade: 1% of account.
Max open positions: 4.
Routine:
Pre-market: Scan for setups.
Post-market: Journal trades, review performance.
Conclusion
A consistent trading plan is not a guarantee of profits — but it guarantees discipline, risk control, and structured decision-making, which are the foundations for profitability. The best traders are not those who predict the market perfectly, but those who manage their trades systematically over years.
Your plan should be written down, tested, followed, and reviewed regularly. The market will keep changing, but your disciplined approach will keep you in the game.
Gold Recovery Stalls at Fibonacci Resistance - Key Levels to WatWe have seen a strong recovery from the monthly pivot point, which acted as solid support. However, the price is now facing significant resistance in the Fibonacci golden zone between 3,370-3,379, based on the recent decline from 3,409 to 3,331. This resistance level presents the main challenge for bulls at this point.
For the bullish momentum to continue, buyers need to push the price above 3,379, which would confirm the upward trend and signal further strength. The positive sign is that gold has been holding steady above the 3,350 level, showing some underlying support at this price point.
Looking at key levels to watch, 3,350 serves as the immediate support level . If this level fails to hold, the next major support comes in at 3,331. A breakdown below these support levels could trigger further selling pressure and lead to additional declines in gold price.
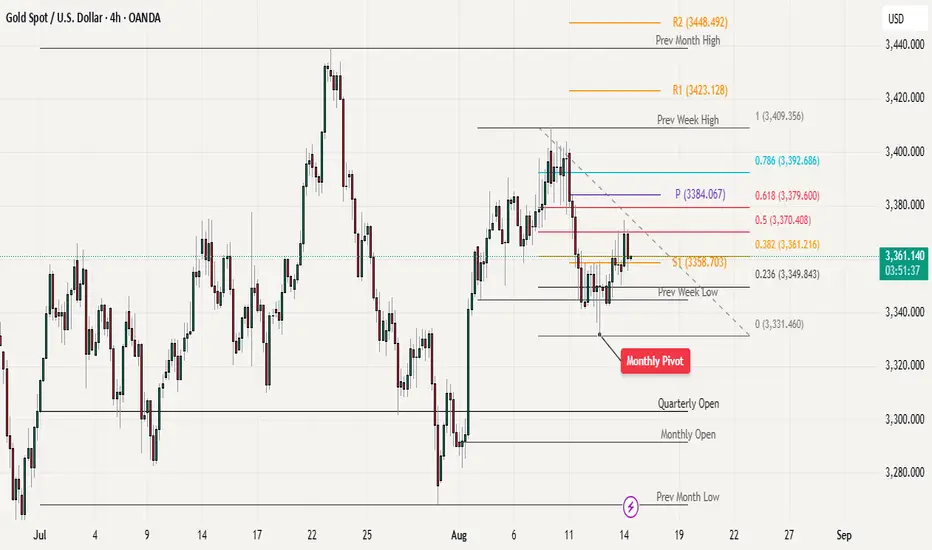
Will TRON hit $1 Club?TRON rise has been nothing short of epic.
From $0.0068 at launch to $0.36 today, over 50x growth.
$1 isn’t a dream anymore… it’s getting closer every day.
Who’s ready for CRYPTOCAP:TRX to crash into the $1 club? 🚀
NFA & DYOR
