Why Gold Loves Trapping Both Buyers and Sellers!Hello Traders!
If you have traded Gold for some time, you’ve probably felt this frustration more than once. You take a clean buy, price stops you out and reverses. You flip to sell, and the same thing happens again. It starts feeling personal, like Gold is hunting you specifically.
The truth is, Gold doesn’t hate buyers or sellers.
Gold loves liquidity, and liquidity comes from trapped traders on both sides.
This is not manipulation in the emotional sense. This is how a highly liquid, institution-driven market functions.
Why Gold Rarely Moves in a Straight Line
Gold is one of the most actively traded instruments in the world. Because of this, it cannot afford to move cleanly for long. Straight moves don’t provide enough participation.
Clean trends attract late buyers at the worst possible prices
Obvious breakdowns invite emotional sellers too early
Both sides place stops at similar, predictable levels
Before Gold commits to direction, it usually clears both sides first.
How Buyers Get Trapped in Gold
Buy side traps often appear after a strong bullish candle or breakout. The structure looks convincing, momentum feels strong, and buyers feel safe.
Price breaks a visible resistance and attracts breakout buyers
Stops get placed just below the breakout level
Gold pulls back sharply to test liquidity below
Buyers aren’t wrong on direction.
They’re early, and early entries are expensive in Gold.
How Sellers Fall Into the Same Trap
Sell-side traps usually form after a sharp rejection or false breakdown. Fear builds quickly, and sellers assume the move is done.
Price dips below support and invites aggressive shorts
Stops cluster just above the rejected level
Gold spikes upward to clear those stops
Again, direction is not the issue.
Timing is.
Why Gold Needs Both Traps
Gold doesn’t choose a side until enough liquidity is collected. Buyers provide one side of liquidity. Sellers provide the other.
Trapped buyers fuel downside liquidity
Trapped sellers fuel upside liquidity
Only after both sides react does structure become clean
This is why Gold feels chaotic to emotional traders and logical to patient ones.
How This Changed My View on Gold
Once I understood that traps are part of the process, not mistakes, my trading became calmer.
I stopped reacting to the first breakout
I waited for both sides to show their hand
I focused more on reactions than predictions
Gold didn’t change.
My expectations did.
Rahul’s Tip
If Gold traps you once, learn from it.
If it traps you repeatedly, it’s not the market, it’s impatience. The real opportunity usually appears after frustration peaks on both sides.
Buyers get trapped.
Sellers get trapped.
Patient traders get paid.
If this post matches your Gold trading experience, drop a like or share your thoughts in the comments.
More real, experience-based lessons coming.
Tradingeducation

The Second Move Strategy in Gold – Why the First Spike Is a TrapHello Traders!
There is a moment in Gold trading that has trapped more traders than bad analysis ever did. It’s that sudden spike, fast, aggressive, and convincing, where everything on the chart screams this is the move. Your instincts tell you not to miss it. Your emotions tell you to act now. And that’s exactly why most traders lose money there.
Gold is not a market that rewards excitement. It rewards restraint. The first spike is rarely the opportunity, it is usually the test.
Why the First Spike Feels Impossible to Ignore
The first move in Gold often arrives with speed and confidence. Candles expand, momentum increases, and breakouts appear clean. This creates urgency, not clarity.
Fast candles trigger fear of missing out
Indicators flip direction almost instantly
Breakout traders pile in without confirmation
The move looks strong because it is designed to look strong.
Strength attracts participation, and participation creates liquidity.
What That First Spike Is Really Doing
In many cases, the first spike is not commitment, It is information gathering. Actually market is checking who is chasing, where stops are sitting, and how much emotional money is willing to enter without patience.
Early entries get trapped during shallow pullbacks
Stops cluster around obvious support or resistance
Traders confuse volatility with direction
This is where most losses begin, not from bad direction, but from bad timing.
Why the Second Move Is Where Professionals Act
After the initial spike, Gold usually pauses. It retraces, consolidates, or retests key levels. This is not weakness, this is clarity forming.
Liquidity from the first move gets absorbed
Weak hands exit under pressure
Structure becomes visible instead of emotional
The second move lacks drama, But it carries intent.
How This Changed My Gold Trading
Once I stopped chasing the first candle, my trading changed quietly but completely. I started letting price reveal itself instead of reacting to it.
I stopped entering during emotional expansion
I waited for retests and structural confirmation
I reduced position size until direction proved itself
Nothing fancy changed, Just patience, and patience did the heavy lifting.
Rahul’s Tip
If a Gold move makes you feel rushed, excited, or pressured, step back. That feeling is not intuition. It’s emotion. The best Gold trades usually feel boring at entry and obvious only in hindsight.
Final Thought
Gold doesn’t trap traders with complexity. It traps them with urgency. The first spike grabs attention. The second move offers opportunity. Learn to wait, and you stop trading reactions. You start trading structure.
If this post made you rethink how you enter Gold trades, drop a like or share your experience in the comments. More real trading lessons coming.

How Market Makers Trap Retail Traders & How to Avoid It?Hello Traders!
Have you ever taken a perfect-looking trade, only to see price hit your stop loss and then move exactly in your direction?
You felt unlucky.
You blamed manipulation.
You thought the market was against you.
But here’s the uncomfortable truth.
Most retail traders don’t lose because their setup is bad.
They lose because they don’t understand how market makers operate.
Once you understand how traps are created, your entire way of reading charts changes.
Who Are Market Makers (In Simple Words)?
Market makers are not sitting there to hunt you personally.
Their job is to provide liquidity and execute large orders.
To do that, they need one thing from the market.
Orders.
Stop losses, breakout entries, panic exits, all of these are liquidity.
Common Ways Retail Traders Get Trapped
False Breakouts
Price breaks an obvious high or low.
Retail traders jump in expecting a strong move.
Within a few candles, price reverses sharply and traps them.
Stop-Loss Hunts
Price suddenly spikes just enough to take out stop losses placed below support or above resistance.
Once liquidity is collected, price moves in the opposite direction.
Emotional Candles
Big red or green candles appear after news or during high volatility.
Retail reacts emotionally.
Market makers use this emotion to fill positions.
Choppy Ranges
Price keeps moving up and down inside a range, stopping out both buyers and sellers.
Retail overtrades.
Smart money accumulates quietly.
If this feels familiar, don’t worry.
Almost every trader learns this the hard way.
Why Retail Traders Fall Into These Traps
They chase obvious levels that everyone can see.
They place predictable stop losses at exact highs and lows.
They trade based on excitement instead of structure.
They react instead of waiting for confirmation.
Market makers don’t need to predict the future.
They simply exploit predictable behavior.
How I Avoid Market Maker Traps
This part changed my trading completely.
I Stop Chasing Breakouts
If a level looks too obvious, I wait.
Real moves usually come after trapping traders, not before.
I Wait for Confirmation
I look for price to break a level and then fail.
False moves often reveal real direction.
I Respect Liquidity Zones
Highs, lows, equal highs, equal lows, these are liquidity pools.
I expect reactions there, not blind continuation.
I Trade With Calm, Not Urgency
When I feel FOMO, I know I’m late.
Good trades never force you emotionally.
Trading became much easier once I stopped trying to be right and started trying to be patient.
The Biggest Mindset Shift
The market’s job is not to be fair.
Your job is not to be emotional.
Once you accept this, traps stop hurting you.
Sometimes you even start using them to your advantage.
Rahul’s Tip
If price does something that feels “too obvious,” pause.
Ask yourself one question
“Who benefits if retail enters here?”
That single question has saved me from many bad trades.
Conclusion
Market maker traps are not a conspiracy.
They are a result of human psychology and predictable behavior.
When you stop reacting and start observing,
the market stops feeling random and starts making sense.
If this post helped you see traps differently, like it, share your thoughts in the comments, and follow for more real-world trading psychology content.
Why Bitcoin Hits Your Stop Loss Before the Real MoveWhy Bitcoin Hits Your Stop Loss Before the Real Move
Have you ever placed a Bitcoin trade and noticed this? 🤔
Your stop loss 😭💸 gets hit… just a few pips from your entry… then the price suddenly rockets 🚀💎 in the direction you were expecting!
This is not bad luck. It’s a Stop Loss Hunt 💥, used by smart money 🏦💰 to collect liquidity before the real trend begins.
1️⃣ Liquidity Pools Above Highs & Below Lows 📊💎
Retail traders place stop losses at obvious highs/lows 📈📉
These stops create liquidity zones 💧, which smart money targets 🔍
Price moves to these zones to collect liquidity → fuels the next trend 🚀
Example:
BTC trending upward 📈
Traders place buy stops above the previous high ⬆️
Smart money pushes price to trigger stops 💥 → collects liquidity 💎 → then moves the price in the real trend direction 🚀
2️⃣ Stop Loss Sweep 💥⚡
Price triggers retail stop losses 🛑
Retail traders get stopped out 😭💸
Institutions enter large positions with minimal resistance 💹
Key Insight:
Price needs liquidity 💧 to move strongly.
Without collecting stops, smart money cannot drive momentum efficiently ⚡
3️⃣ Fake Breakouts & Wicks 🌪️🔥
Watch for wick spikes or sudden breakouts 🕵️♂️
These are stop loss hunts
Many traders panic 😱 and exit positions
Smart money uses this to trap retail traders and continue the trend 🚀
4️⃣ The Real Move Begins 🚀🔥
After liquidity is collected 💎💧
The true trend resumes 📈
Traders who waited can enter safely 🧘♂️💹
Often, the move is stronger and faster ⚡ because institutions now control the market
5️⃣ Market Psychology Behind Stop Hunts 🧠💭
Retail traders panic when stops are triggered 😅💸
Fear is used to manipulate sentiment 🧲
Recognizing this psychological trap helps you stay calm 🧘♂️ and trade strategically 🏆
6️⃣ How to Trade Stop Loss Hunts 💡🧠
✅ Avoid stops at obvious highs/lows 🚫
✅ Wait for liquidity sweep ⏳💧
✅ Watch for wick spikes 🌟 — early signs of stop hunts
✅ Follow market structure 📊 (BOS/CHoCH)
✅ Trade after confirmation ⏱️
✅ Patience + discipline = profits 💎💹
7️⃣ Examples in Bitcoin Trading 🔍
Double top wicks above high → triggers stops 💥 → continues trend 🚀
Price dips below support → triggers stops 😭 → rebounds ⬆️
💡 Observation: Every wick tells a story 🌟 — learn to read it!
💬 Key Takeaways
Stop Loss Hunts = institutional footprints 👣
Price hunts liquidity 💧 — that’s why your SL is hit 💥
Understanding this helps you:
Trade smarter 💎
Avoid losses 😅💸
Spot trends before they happen 🚀

Why Gold Hits Your SL🌟 Why Gold Hits Your SL 😭💛📈
Gold is one of the most aggressive and volatile assets in the market — and if you’ve ever wondered “Why does gold ALWAYS hit my stop-loss before moving in my direction?”, this post explains the real reason.
Let’s break it down clearly 👇
🔶 1. Gold Loves Liquidity — Not Levels 💦💰
Gold doesn’t move based on your support/resistance lines.
It moves based on liquidity, meaning:
Where traders place stop-losses ❌
Where pending orders sit 🎯
Where large institutions want to fill positions 🏦
Your SL is simply sitting where everyone else puts theirs, which makes it prime liquidity.
🔶 2. XAUUSD Spikes Are Designed to Collect Orders ⚡💥
Gold often creates sudden:
Wicks
Fake breakouts
Quick pumps or dumps
Sharp candle spikes
These moves are NOT random — they’re engineered to:
🔸 Trigger stop-losses
🔸 Activate pending buy/sell orders
🔸 Grab liquidity before the real move
This is why your SL gets hit by $1–$3 before price completely reverses.
🔶 3. Gold Moves Session-by-Session 🕒🌍
Gold behaves differently depending on the time of day:
Asia session → Slow, tight range
London session → First big manipulation
New York session → Volatility explosion + real direction
Most SL hunts take place when London opens or when NY session begins ⚠️🔥
🔶 4. Clean Highs & Lows = SL Magnets 🧲📌
Gold LOVES attacking:
Previous day’s high/low
Asian range high/low
London session extremes
Double tops & bottoms
Round numbers (like 4000 / 4050 / 4100)
These areas hold thousands of stop-losses.
So before gold takes a real direction — it sweeps them first. 🏹😈
🔶 5. The Classic Gold Pattern: Trap → Reversal → Expansion 🔁🚀
Most XAUUSD moves follow this sequence:
1️⃣ Sweep liquidity 😭
2️⃣ Fake breakout 😈
3️⃣ Sharp rejection 👋
4️⃣ Real trend begins 🚀
If you’ve ever seen price:
Break a level
Wick hard
Then reverse the entire move
That’s gold performing a liquidity grab.
🔶 6. How To Avoid Getting Stopped Out ✔️
Here’s what actually helps:
🌟 A. Don’t put SL exactly at obvious levels
Move it beyond common liquidity zones.
🌟 B. Wait for the sweep before entering
Let gold perform the trap first.
🌟 C. Trade reaction — not prediction
Look for re-entry after the wick forms.
🌟 D. Use sessions to your advantage
Avoid placing SL right before London/NY opens.
🌟 Final Words
Gold isn’t hunting you —
it’s hunting liquidity.
Your job is simple:
👉 Stop placing stops where everyone else does
👉 Let gold sweep liquidity first
👉 Then catch the real move
Trade smarter, not tighter. 💛⚡

Jio Financial Services: The Art of Trading Inside a ChannelA down-channel isn’t chaos — it’s structure.
It exposes who understands rhythm… and who trades out of impulse.
Jio Financial has been moving inside a clear descending channel for months.
Nothing random about it — price is respecting every touch.
🔎 Technical Context
Price continues to oscillate between the upper and lower channel boundaries.
The latest bounce pushed it near ₹307–309, close to mid-channel resistance.
200 EMA is flat → long-term trend still neutral.
Short-term MAs (20/50) are crossing upward → momentum is improving, but not confirmed.
Volume steady → no aggressive buyers yet, no panic either.
This is classic controlled movement — a market moving with intention, not noise.
🧠 Mindset Lesson
Traders lose money in channels because they want certainty in a structure designed to punish it.
They do three things wrong:
Chase breakouts inside the channel.
Fight the trend expecting “reversal soon.”
Lose patience during sideways stretches.
Professionals play it differently:
They trade edges, not expectations.
They wait for clean confirmation outside the channel.
They don’t confuse movement with opportunity.
A channel teaches the hardest market truth:
You don’t need to act on every candle. You need to understand the structure.
👉 Patience inside a channel is not passive — it’s positioning.
💡 Save this. Follow for daily trader mindset + price-action education that sharpens discipline and execution.

Stop Trying to Recover Losses. Start Trying to Build ConsistencyHello Traders!
Every trader goes through losses. But what separates a struggling trader from a successful one is not the size of their wins, it’s what they focus on after a loss.
Most traders waste months trying to “get back” the money they lost.
But the truth is simple: the more you chase recovery, the more you lose.
Your real job is not to recover losses, it’s to build consistency.
1. Loss Recovery Creates Emotional Pressure
When you trade just to recover what you lost, you stop thinking logically.
You increase lot size, enter without confirmation, and ignore your plan.
This emotional pressure makes you take trades you would never take in a calm state.
Recovery trading doesn’t fix losses, it multiplies them.
2. Consistency Has No Ego
Consistency doesn’t care about your last loss or last win.
It’s about following the same rules every day, no matter what happened yesterday.
Small, controlled wins compound over time, and slowly replace every old loss.
Consistency creates stability. Stability creates clarity. Clarity creates profits.
3. When You Stop Chasing, You Start Thinking
You no longer rush entries, you wait for your setup.
You risk only what fits your plan, not what your emotions whisper.
You accept that losses are part of your business, not threats to your ego.
A calm mind sees opportunities a stressed mind can’t.
4. The Real Recovery Happens Naturally
When your focus shifts from recovering to improving, your trades automatically become better.
Consistency makes your equity curve smoother.
Slow, steady growth quietly replaces big losses without you forcing anything.
Professional traders don’t “recover”, they simply continue.
Rahul’s Tip:
Your next breakthrough won’t come from a big winning trade, it will come from a week where you followed your plan perfectly, even if the profits were small.
Consistency is your strongest weapon in trading. Use it.
Conclusion:
Stop fighting your past losses, they’re already gone.
Focus on building the habits that ensure you never repeat them again.
Recovery is temporary. Consistency is permanent.
If this post shifted your mindset, like it, share your thoughts in comments, and follow for more honest trading psychology lessons!
The Herd Mentality – Why Everyone Buys When It’s Too Late?Hello Traders!
You’ve seen it a hundred times, the market rallies, social media explodes, and suddenly everyone starts buying.
Then, just when retail traders feel “safe” entering, the price crashes.
It’s not bad luck, it’s herd mentality .
And unless you understand how it works, you’ll keep following the crowd straight into losses.
1. What is Herd Mentality in Trading?
Herd mentality is the instinct to do what everyone else is doing, buying when others buy, selling when others sell.
It’s rooted in human psychology, our brains feel safer when we’re part of a group.
In trading, this instinct is deadly because the crowd always reacts late.
When you feel comfortable entering a trade, it’s usually because the market has already moved.
2. The Cycle of Fear and Greed
Every bull run begins with a few smart traders who buy quietly when no one’s interested.
As prices rise, social media hype builds, the crowd starts joining in.
Then, when “everyone” is talking about the coin, smart money exits, leaving the herd trapped at the top.
The same happens in bear markets, panic selling at bottoms while professionals buy patiently.
It’s not about intelligence, it’s about emotion.
3. How the Market Exploits the Crowd
Institutions and big traders understand herd behavior better than anyone.
They create liquidity by pushing prices to levels where retail traders feel emotionally forced to act.
The market uses human nature, fear and greed, as its fuel.
The crowd provides the liquidity, and professionals use that liquidity to enter or exit quietly.
4. How to Avoid Becoming Part of the Herd
Develop your own plan, if your entry depends on others’ excitement, it’s not your setup.
Buy when the market feels uncomfortable; sell when everyone feels confident.
Learn to think independently. The best trades usually feel the hardest to take.
Patience and conviction are your weapons against the herd.
5. The Truth Most Traders Don’t Want to Hear
If you wait for social proof to feel confident, you’ll always be late.
By the time the crowd “believes,” the move is already priced in.
You don’t get rich by following others, you get rich by understanding why others behave the way they do.
Rahul’s Tip:
The market doesn’t punish retail traders because they lack knowledge, it punishes them because they act emotionally together.
Train your mind to do what’s uncomfortable, not what’s popular. That’s where the profit hides.
Conclusion:
The herd mentality is the silent killer of most portfolios.
The more people talk about an asset, the less opportunity it holds.
Smart traders buy silence and sell noise.
Once you learn to think independently, you’ll stop being the liquidity, and start trading like the ones who create it.
If this post opened your eyes to herd psychology, like it, share your view in comments, and follow for more deep market insights!
Emotional Discipline and Risk Control in Trading🧠 1. Why Emotional Discipline Matters
Emotional discipline means sticking to your plan regardless of fear or greed.
Markets are designed to test your patience, confidence, and decision-making. Every losing trade tempts you to change your system — but consistency wins.
✅ Key habits of emotionally disciplined traders:
They accept losses without revenge trading.
They follow rules, not impulses.
They manage expectations — no trade will make them rich overnight.
💰 2. Risk Control — Protect Before You Profit
Your risk management defines your survival. Successful traders think in probabilities, not certainties. They never risk too much on one idea.
📏 Golden Rules of Risk Control:
Risk 1–2% of your capital per trade.
Always use a stop-loss, never a “mental” one.
Define your R:R ratio (minimum 1:2 or better).
Never add to a losing position — only to confirmed winners.
Risk control is not about avoiding losses — it’s about limiting damage and staying consistent over time.
🧩 3. How to Strengthen Emotional Discipline
Like a muscle, discipline grows with routine. Try this daily:
Pre-trade routine – review your plan before every session.
Post-trade journal – log your emotions, not just results.
Take breaks – emotional fatigue leads to poor judgment.
Detach from outcomes – focus on process, not profit.
💡 Tip: When you reduce emotional pressure, your clarity and accuracy both improve.
⚙️ 4. Professional Mindset Shift
Amateurs chase profit; professionals protect capital.
Each trade is just one data point — not a reflection of your worth. Once you start thinking like a risk manager first, your results change naturally.
🗣️ “Discipline is choosing what you want most over what you want now.”
📊 Conclusion
To grow as a trader, focus on controlling yourself before controlling the market.
Emotional stability + strict risk control = long-term success.
Be the trader who executes with logic, not emotion. 🧘♂️
How Smart Money Moves Gold (XAUUSD)Every spike, every fake breakout, every sharp reversal… it’s all part of a bigger plan by smart money (institutions) to trap emotional traders and collect liquidity.
Let’s break it down 👇
⚡ 1️⃣ Liquidity Grab (The Trap Phase)
Before any real move, gold sweeps stop-losses above highs or below lows.
Retail traders think it’s a breakout — but it’s actually a liquidity hunt.
Smart money fills large positions here while emotions run high.
⚡ 2️⃣ Market Structure Shift (The Clue)
After collecting liquidity, watch for a BOS (Break of Structure) or CHoCH (Change of Character) — these reveal when the real move is starting.
⚡ 3️⃣ Smart Money Entry (The Real Move)
Once the trap is set, gold often makes a strong impulsive push.
This is where institutions enter — and where smart traders follow with confirmation, not emotion.
⚡ 4️⃣ Emotional Traders Lose, Logical Traders Win
The market doesn’t hate you — it simply feeds on emotional reactions.
Be patient, wait for liquidity sweep ➜ structure shift ➜ confirmation entry.
🧭 Pro Tip:
👉 Stop chasing candles.
👉 Study liquidity and market structure.
👉 Let the chart show who’s trapped — and then trade against them.
💬 Remember:
“The market rewards patience, not panic.”
💎 Gold (XAUUSD) moves on liquidity — not luck.
#TradeSmart #ThinkLikeInstitutions #XAUUSD

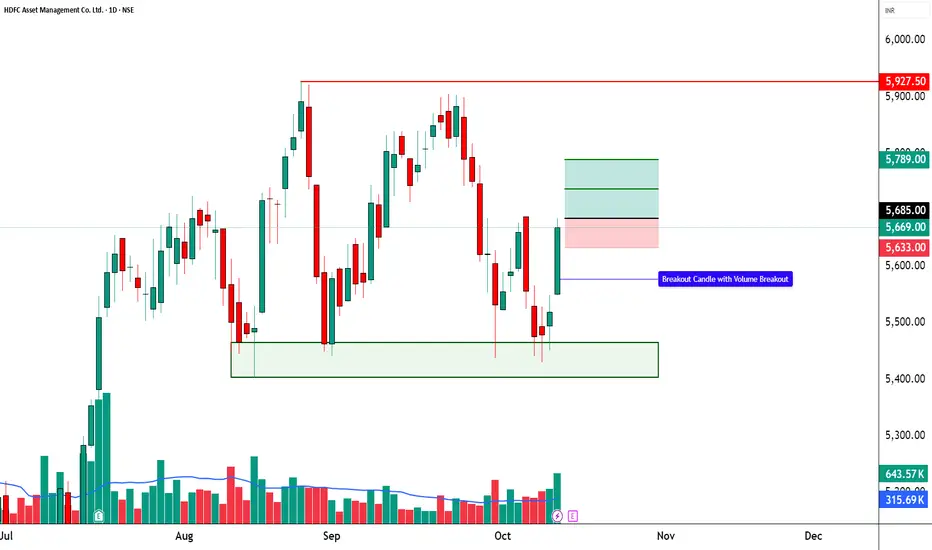
HDFC AMC LTD | Bullish Momentum + Possible Breakout📈 HDFC AMC LTD | Bullish Momentum + Possible Breakout 🚀
🔹 Bullish Breakout Zone: 5,660 – 5,685
🔹 Stop Loss: 5,633 (Risk ~₹52)
🔹 Supports: 5,584 / 5,499 / 5,448
🔹 Resistances: 5,719 / 5,770 / 5,855
🔑 Key Highlights
HDFC AMC has formed a strong bullish candle with a notable volume surge, clearly confirming aggressive buying interest. The RSI breakout signals a shift in momentum after a prolonged consolidation phase, indicating that the stock is gaining renewed strength. Additionally, a Bollinger Band Squeeze-Off pattern is visible, suggesting a potential volatility expansion and a short-term breakout on the upside. The spike in trading volume further reinforces the bullish sentiment, hinting at possible institutional participation behind this move.
🎯 STWP Trade View
📊 Price has reclaimed control above near-term resistances with improving momentum.
A sustained close above ₹5,719 can trigger a move toward ₹5,770–₹5,855 levels in the short term.
Pullbacks toward ₹5,640–₹5,660 may offer favorable entry zones with tight risk control.
⚠️ Supports at ₹5,584 and ₹5,499 remain crucial for maintaining the swing structure and protecting positions.
________________________________________
📊 Final Outlook
Momentum: 🔥 Strong
Trend: 📉 Bearish (but reversing)
Risk: 🟢 Low
Volume: 📈 High
________________________________________
💡 Learning Note
This setup demonstrates the power of confluence — RSI breakout + BB squeeze + volume surge.
Such multi-signal alignments often mark the start of a momentum phase, offering early entry opportunities before a confirmed breakout rally.
________________________________________
________________________________________
⚠️ Disclosure & Disclaimer – Please Read Carefully
The information shared here is meant purely for learning and awareness. It is not a buy or sell recommendation and should not be taken as investment advice. I am not a SEBI-registered investment adviser, and all views expressed are based on personal study, chart patterns, and publicly available market data.
Trading—whether in stocks or options—carries risk. Markets can move unexpectedly, and losses can sometimes exceed the money you have invested. Past performance or past setups do not guarantee future results.
If you are a beginner, treat this as a guide to understand how the market works and practice on paper trades before risking real money. If you are experienced, always assess your own risk, position sizing, and strategy suitability before entering trades.
Consult a SEBI-registered financial adviser before making any real trading decision. By engaging with this content, you acknowledge full responsibility for your trades and investments.
Position Status: No active position in HDFCAMC at the time of analysis.
Data Source: TradingView & NSE India (Past Chart Reference) (Historical levels)
💬 Found this useful?
🔼 Give this post a Boost to help more traders discover clean, structured learning.
✍️ Drop your thoughts, questions, or setups in the comments — let’s grow together!
🔁 Share with fellow traders and beginners to spread awareness.
👉 “If you liked this breakdown, follow for more clean, structured setups with discipline at the core.”
🚀 Stay Calm. Stay Clean. Trade With Patience.
Trade Smart | Learn Zones | Be Self-Reliant 📊
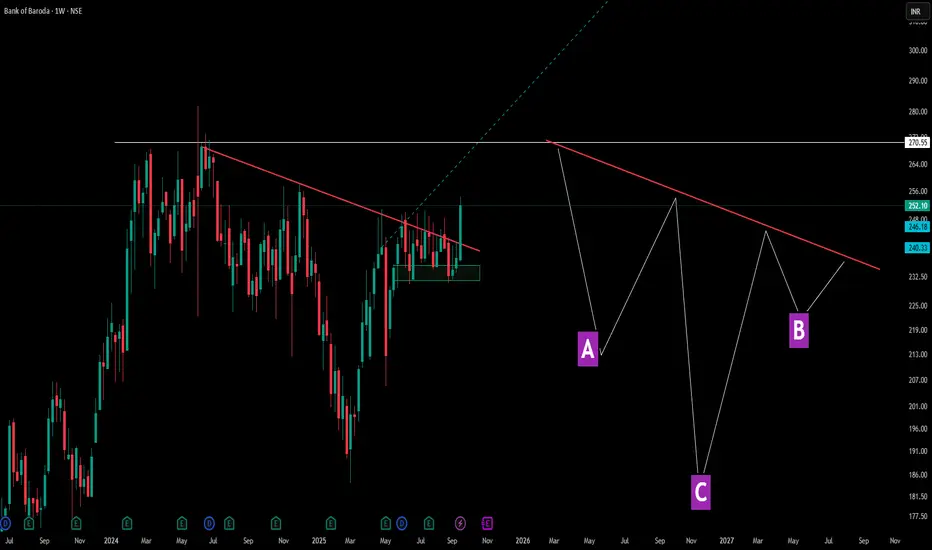
Decoding Angled Necklines in Inverted Head & ShouldersThis chart showcases a perfect example of how inverted head and shoulders patterns don't always follow textbook formations. Points A and B represent the shoulders, while C forms the deeper head—but notice the crucial difference: the neckline (red line) is tilted rather than horizontal.
Pattern Education Points:
- Traditional vs Reality: While many educational materials show horizontal necklines, real market patterns frequently display angled necklines, which are equally valid
-Shoulder Structure: The left shoulder (A) and right shoulder (B) don't need perfect symmetry—market patterns reflect actual supply and demand dynamics, not geometric precision
Market Structures:
- Before A, There was serious consolidation and then a Lower Low formation in the markets -> showcasing a dry volume dip and significant correction ( marking C ) as well as a result .
- Accompanied by a decent V shape recovery, tilted neckline is been touched again - showcasing market multi structure patterns are really important and there identification can lead to a decent trade idea
- later the next shoulder ( B ) gives solid consolidation but this time the dip is not solid unlike the normal Inverted HnS which makes the 2nd dip equal to the 1st shoulder dip here its a solid consolidation with small dip and a marubozu green candle after that .
Disclaimer: This content is for educational purposes and not financial advice. Always do your own research before making trading decisions.
Buy, Sell or Skip? Read Breakouts and VolumesExplore how to judge breakouts using TradingView's bar replay, leveraging 3-month-old charts and price action principles that apply from 5-min to monthly timeframes. Sharpen your technical edge—educational insights only.
Disclaimer: This content is for educational purposes and not financial advice. Always do your own research before making trading decisions.

SIEMENS LTD. – INTRADAY ZONE ANALYSIS________________________________________
📈 SIEMENS LTD. – INTRADAY ZONE ANALYSIS
📆 Date: July 1, 2025 | ⏱ Timeframe: 15-Minute Chart
🔍 Educational Analysis for Learning Purposes Only
________________________________________
📊 Zone Breakdown:
• 🔴 Top Range Resistance – 3,271.90
Marked in Red: This is a clearly defined supply zone where the price faced sharp rejection after testing highs. Bearish opportunity zone if a reversal pattern appears — watch for signs like bearish engulfing, double top, or rising volume + long upper wicks.
• 🟠 No Trade Zone – Around 3,225–3,260
Marked in Orange: This range has seen volatile, choppy action without clear bias. Traders may avoid fresh positions here unless directional strength emerges with volume confirmation.
• 🟢 Demand Zone – 3,182.60 to 3,165 | SL: 3,160.35
Marked in Green: Price reversed sharply from this area in the past with strong bullish candles. Acts as a low-risk buying area on retest with bullish confirmation. Risk-managed entries possible here.
• 🟩 Bottom Support – 3,101.10
Marked in Dark Green: Crucial structural support zone. Breakdown below this level could change the short-term trend to bearish. Currently a “last line of defense” for bulls.
________________________________________
🔍 Candlestick & Chart Pattern Observation:
✅ Bearish Rejection Near Top Zone:
A strong upper rejection candle (long wick) appeared right at the top resistance (3,271.90), followed by consistent lower highs and lower closes. This confirms seller presence. No double top yet, but early signs of a potential short-term top formation are visible.
✅ Bullish Reversal from Demand Zone:
The candle near 3,170 zone shows a sharp bullish engulfing move on higher volume — signaling potential institutional interest. This zone has repeatedly offered bounce opportunities.
📉 Volume Clue:
Volume expanded during the bounce from demand zone and tapered near resistance — confirming participation during dips and caution near highs.
________________________________________
⚙️ Educational Trade Ideas (Study Purpose Only)
▶️ Reversal Setup – Bearish Bias
• Entry: Below 3,245 on bearish continuation candle
• Stop Loss: Above 3,272 (Top Range)
• Risk-Reward: 1:1 | 1:2+
________________________________________
🧠 Ideal for studying exhaustion after a resistance test and confirmation through lower highs.
▶️ Pullback Setup – Bullish Bias
• Entry: Between 3,170–3,182 (Demand Zone)
• Stop Loss: 3,160.35
• Risk-Reward: 1:1 | 1:2+
🧠 Classic demand zone bounce setup. Strong volume + engulfing candle supports bullish case.
________________________________________
⚠️ Disclaimer (SEBI-Compliant):
This content is strictly for educational and informational purposes. It is not investment advice or a recommendation to buy/sell any securities. Always consult a SEBI-registered financial advisor before making any financial decisions.
STWP | Learn. Trade. Grow.
________________________________________
💬 Do you think the top is strong enough for a short? Or will bulls take control at demand again?
Drop your thoughts and analysis below ⬇️
________________________________________

Why Option Writers Win Even if They're Wrong About Direction?Hello Traders!
Have you ever noticed that option sellers often make money even when their market direction isn’t perfect? That’s because option writing is not just about predicting direction — it’s about predicting behavior : time, range, and volatility. Let’s understand why this strategy works and how you can use it smartly.
Why Option Writers Have the Edge
Time Decay (Theta) Works for Them:
Every passing minute eats away option value — and option sellers profit from that decay . Even in sideways or slightly wrong trades, they gain as time works in their favor.
Range-Based Strategies:
Writers often use strangles, straddles, or iron condors to bet on the market staying within a range. If the price doesn’t move wildly, they win — even if the direction isn’t exact.
Volatility Crush After Events:
After big events (like budget, earnings, Fed meetings), IV drops sharply , causing option premiums to collapse — again benefiting writers.
High Probability of Profit:
Most out-of-the-money options expire worthless. Statistically, writers win more often , even with a lower reward compared to risk.
Rahul’s Tip
If you don’t want to always predict direction, learn non-directional option writing setups based on support/resistance, OI data, and VIX levels. Always hedge your positions and respect risk.
Conclusion
Option writing is not about being right — it's about being smart. When done with discipline and proper risk management, it can generate consistent income, even if the market doesn’t move as expected.
Are you an option buyer or writer? Share your favorite strategy in the comments below!
How to Trade "Mitigation Blocks" – Secret Used by Big Boys!Hello Traders!
Today we’re diving into an advanced Smart Money Concept – the Mitigation Block . If you’ve ever wondered how institutional traders quietly manage their risk and re-enter trades with precision, this is it. Learning to identify and trade Mitigation Blocks can completely change how you see charts — and give you an edge most retail traders miss!
What is a Mitigation Block?
A Mitigation Block is formed when smart money (institutions, banks) enter a position, price reacts strongly, but later returns to the same zone to “mitigate” their risk or add more positions. This block acts as a powerful zone of support or resistance , depending on trend direction.
How to Identify a Mitigation Block
Look for Imbalance + Strong Reaction: A large impulsive candle followed by a return to the origin zone.
Price Fills the Fair Value Gap: Smart money wants to re-enter at the best price — this creates the mitigation block.
Previous Break of Structure: The block should follow a BOS (Break of Structure) that confirms a new trend.
How to Trade the Mitigation Block
Mark the Origin Candle Zone: Identify the candle or small range where the impulse began. This is your block.
Wait for Price to Return: When price comes back to that zone, look for entry confirmation (candlestick rejection, SMC confirmation, etc.).
Use Proper SL and RR: Place stop loss below/above the mitigation zone and target next liquidity level or BOS zone.
Rahul’s Tip
Most traders chase breakouts. Smart money plans for the pullback to mitigation zones. Be patient, wait for confirmation, and strike where big players do — not where the crowd is jumping in.
Conclusion
Mitigation Blocks are not just support/resistance — they are institutional footprints. Learn to spot them, understand the intent behind them, and you’ll start entering where the big boys load up.
Have you ever traded mitigation blocks before? Share your experience in the comments!

Retail vs Smart Money: Learn to Spot the Real Market Movers!Hello Traders!
Today, we’re diving into one of the most important yet least talked about market dynamics — the constant battle between Retail Traders vs. Smart Money . Every chart hides a silent war where emotions meet strategy, and it’s time you learn how to spot it!
What is Smart Money vs Retail Behavior?
Retail traders often follow price, news, and momentum. Smart money (institutions, big players) create the setups that retail ends up chasing.They accumulate silently during fear, distribute during euphoria — and use chart patterns, volume, and sentiment to their advantage.
Key Signs You’re Competing Against Smart Money
False Breakouts Near Highs: Smart money sells into breakout buying volume as retail jumps in too late.
Volume Divergence: Price rises but volume fades — big players aren’t buying anymore.
Traps Around Support/Resistance: Retail stops get hunted just before big reversals.
Sudden Wicks & Spikes: Quick candle spikes in low liquidity zones often indicate manipulation.
VWAP & Order Flow Conflicts: Price trades above VWAP but fails to sustain — institutions are likely offloading.
How to Avoid Being the Liquidity for Smart Money
Don’t Chase Moves: Always wait for confirmation. Avoid impulsive entries.
Track Volume + Context: High volume at breakout = strength. Low volume = trap.
Observe VWAP and Institutional Zones: Use tools like VWAP, anchored VWAP, and order blocks to detect smart accumulation/distribution.
Think Like a Trap Setter: Ask — where are people trapped? That’s where smart money will act.
Rahul’s Tip If you feel excited to buy, ask yourself — who’s selling to you? If you feel panic to sell, who’s buying from you?That’s how smart money survives — by playing the opposite side of your emotion.
Conclusion Markets are less about technicals and more about psychology. The faster you learn how smart money uses charts to influence emotions, the faster you’ll level up as a trader.
Have you ever fallen into a smart money trap? Share your experience in the comments — let’s all learn together!

Why Market Moves Against You After Entry–It’s Not a Coincidence!Hello Traders!
Ever felt like the moment you enter a trade, the market just turns against you? You’re not alone. Today, we’ll break down why this happens and how you can avoid getting trapped. This common phenomenon is not just bad luck — it’s often a result of liquidity hunting, stop-loss triggering, and retail behavior predictability .
The Real Reason Behind Entry Reversals:
Liquidity Zones Near Obvious Entry Areas: Most traders enter at breakout or breakdown levels with tight stop-losses. Market makers and institutions know this and target these zones to fill their large orders.
Stop-Loss Clusters = Opportunity: When many traders place SLs at the same level, it creates a liquidity pool. Big players trigger these to generate volatility and enter at better prices.
Retail Predictability: Most traders use similar strategies – entering on breakout candles, using fixed SLs, or chasing momentum. Algos are trained to identify these patterns and act accordingly.
No Confirmation Entry: Entering without waiting for confirmation — like candle close, volume spike, or retest — increases the chances of being trapped.
How to Avoid Getting Trapped:
Don’t Enter at Obvious Levels: Instead of breakout candle entry, wait for retest or structure confirmation.
Use Liquidity Awareness: Identify where other traders may be placing SLs — avoid entering right before those levels.
Watch Volume and Price Behavior: Sharp moves on low volume are often traps. Entry should align with volume strength.
Wait for Retests: A retest after breakout/breakdown gives better R:R and filters out fakeouts.
Conclusion:
The market isn’t random — it’s designed to hunt the predictable. If you want to stay ahead, start thinking like the smart money. Avoid entering at the obvious point, understand where liquidity lies, and build a habit of confirmation-based trading.
Have you ever faced a market reversal just after your entry? Let’s talk about your experience and how you manage such traps in the comments below!

Learn Peter Lynch’s Proven Investment Strategies! Hello everyone, i hope you all will be doing good in your life and your trading as well. Today again i have brought an educational post on Peter Lynch's Golden Rules for Smart Investing, So let's Start and apply this in your Trading and Investing to achieve Success.
Invest in What You Know: Stick to businesses whose products and services you understand. Pay attention to companies you regularly interact with.
Do Your Homework: After identifying a good company, analyze its financials thoroughly. Look at sales growth, earnings, and the balance sheet.
Avoid the Hype: Don’t follow the crowd or invest in hot stocks based on market trends. Stick to your analysis and logic.
Look for Growth: Invest in companies with strong long-term growth potential, especially in expanding industries.
Know What You Own: Always understand why you are investing in a particular stock. Learn about its business model, competitive advantages, and risks.
Be Patient: Successful investing takes time. Don’t expect instant results; focus on the long-term potential of your investments.
The Stock Market is Not a Lottery: Investing requires research and knowledge, not random guesses.
Ignore Short-Term Fluctuations: Avoid reacting to daily price movements; focus on a company's fundamentals.
What This Means for Investors:
Following these principles will help you build a strong investment strategy based on knowledge, patience, and discipline.
Outcome:
By applying Peter Lynch’s principles, you can develop a systematic and confident approach to investing.

Warren Buffett’s 10 Golden Rules for Smart InvestingWhen it comes to investing, no name shines brighter than Warren Buffett. Known as the "Oracle of Omaha," Buffett has shared timeless principles that can help every investor achieve long-term success. Here's a breakdown of his golden rules to guide your trading and investment journey:
1. Never lose money.
Buffett's most famous rule: "Rule No. 1: Never lose money. Rule No. 2: Never forget Rule No. 1." Protecting your capital is more important than chasing high returns.
2. Invest in what you understand.
Focus on industries and businesses that you can analyze and comprehend. Investing in areas where you lack knowledge is a recipe for unnecessary risk.
3. Quality over quantity.
Choose businesses with strong competitive advantages, consistent earnings, and exceptional management. Buffett calls these "wonderful businesses."
4. Patience pays.
Buffett famously said, "The stock market is a device for transferring money from the impatient to the patient." Successful investing requires the discipline to wait for the right opportunities.
5. Price vs. Value.
"Price is what you pay, value is what you get." Always look for companies trading below their intrinsic value to maximize returns.
6. Avoid unnecessary debt.
Buffett avoids borrowing money for investments and prefers companies with low debt. High leverage can amplify risks and lead to losses.
7. Think long-term.
Invest with the mindset of holding a stock indefinitely, provided the business remains strong and continues to grow.
8. Be contrarian.
Buffett advises, "Be greedy when others are fearful and fearful when others are greedy." Market downturns are opportunities to buy great companies at discounted prices.
9. Reinvest your earnings.
Reinvest dividends and profits to harness the power of compounding, which is the key to exponential growth over time.
10. Commit to lifelong learning.
Buffett spends hours reading every day to expand his knowledge. Continuous learning is essential to stay ahead in the market.
By following these rules, you can build a strong foundation for long-term success in the stock market. Remember, investing isn’t about luck—it’s about strategy, discipline, and staying informed.

Mastering Emotional Discipline: The Key to Trading SuccessMastering Emotional Discipline: The Key to Becoming an Emotionless Trader
Trading is not just about strategies or market knowledge—it’s a mental game. It tests your patience, your discipline, and most importantly, your ability to keep emotions in check. If you’ve ever felt fear, greed, or overconfidence while trading, you’re not alone. The truth is, even the most seasoned traders struggle with emotions. But what sets successful traders apart is their ability to master these emotions and make decisions based on logic, not impulse.
Let’s dive into why emotions are a challenge and how you can conquer them to trade with confidence and consistency.
_______________________________________________________________
Why Emotions Are a Trader’s Biggest Challenge
Trading can feel like a rollercoaster ride. One moment you’re on top of the world with a winning streak, and the next, you’re doubting every decision after a loss. Here’s how emotions like fear, greed, and overconfidence can impact your trading:
Fear: The fear of losing money can paralyze you. It might make you close trades too early or avoid taking trades altogether, even when they align perfectly with your strategy.
Greed: That voice in your head saying, "Just a little more profit," can push you to overtrade or hold on to losing positions longer than you should.
Overconfidence: After a few wins, it’s easy to feel invincible. But overconfidence often leads to risky decisions and can derail your trading plan.
The key is not to eliminate these emotions but to recognize and control them.
_______________________________________________________________
What Happens When Emotions Take Over?
Fear
Makes you second-guess yourself.
Leads to missed opportunities or premature exits.
Keeps you stuck in your comfort zone, limiting your growth.
Greed
Encourages overtrading, depleting your capital.
Makes you hold onto trades too long, hoping for a miracle.
Clouds your judgment, causing you to ignore your strategy.
Overconfidence
Makes you take unnecessary risks.
Leads to impulsive trades based on gut feelings rather than logic.
Prevents you from learning from mistakes because losses feel like exceptions.
_______________________________________________________________
How to Trade Without Emotions?
The goal isn’t to suppress your emotions—it’s to master them. Here’s how:
1. Stick to a Clear Plan
Have a plan for every trade. Know your entry, exit, and stop-loss levels before you even place the order.
Treat your strategy like a trusted friend—it’s there to guide you, so stick with it, no matter what.
2. Master Risk Management
Protect your capital. Limit your risk to 1-2% of your portfolio per trade.
Diversify your investments to avoid getting too emotionally attached to a single trade.
Position sizing is your secret weapon—use it wisely.
3. Keep a Trading Journal
Write down everything—why you entered a trade, how it played out, and how you felt.
Reviewing your journal helps you spot patterns and understand what works (and what doesn’t).
It’s not just about tracking numbers; it’s about understanding yourself as a trader.
4. Leverage Technology
Use tools like stop-loss and take-profit orders to keep your emotions out of decision-making.
If you’re tech-savvy, explore algorithmic trading to automate your strategy.
Let alerts and notifications do the heavy lifting while you stay focused on the big picture.
5. Develop a Mindful Mindset
Take breaks during your trading day. Sometimes stepping away is the best move you can make.
Practice mindfulness—deep breaths or even a few minutes of meditation can help you reset.
Accept that losses are part of the game. Learn from them and move on.
_______________________________________________________________
The Outcome
When you master emotional discipline, trading becomes less stressful and more rewarding. You’ll make decisions based on logic, avoid costly mistakes, and see consistent progress over time. Remember, it’s not about being emotionless—it’s about staying in control.
Every successful trader started where you are today. The difference is they learned to trust their process and stick to their plan. You can do the same.
If you found this post helpful, give it a like and follow! I’m here to share more insights to make your trading journey smoother and smarter. Don’t forget to check out my profile @TraderRahulPal for more educational content and actionable trading ideas. Let’s grow together! 🚀

Unlocking the Secrets of Divergence in Trading- A Complete GuideMastering Divergence: Real-Life Examples of Bullish and Bearish Divergence in UPL Ltd and Tata Motors
Divergence is an incredibly powerful tool in technical analysis that helps traders spot potential trend reversals. By comparing price action with momentum indicators like RSI, you can catch subtle signs of market shifts and make more informed trading decisions.
In this post, I’m sharing two real-life examples of bullish and bearish divergence to help you understand how this works and how you can use it to improve your trading.
1. Bullish Divergence Example: UPL Ltd
Here’s what happened:
Price Action: UPL Ltd made a lower low on the chart.
RSI Indicator: At the same time, RSI formed a higher low, creating a clear bullish divergence.
What does it mean?
Even though the price was dropping, the RSI hinted that momentum was picking up. This is often a clue that a reversal might be on the horizon.
Outcome:
Right after confirming the divergence, UPL Ltd saw a strong rally, rewarding traders who caught the signal early.
2. Bearish Divergence Example: Tata Motors
Here’s another case:
Price Action: Tata Motors was climbing, forming a higher high on the chart.
RSI Indicator: But the RSI didn’t agree—it created a lower high, signaling a bearish divergence.
What does it mean?
The rising price didn’t have the momentum to back it up. This imbalance often leads to a downward reversal.
Outcome:
As expected, Tata Motors experienced a bearish reversal soon after, validating the divergence and giving traders a great shorting opportunity.
Why Divergence Is a Must-Know for Traders
Divergence is so effective because it reveals hidden shifts in market momentum before they show up on price charts. Here’s why it’s worth paying attention to:
Early Signals: Divergences give you a head start by showing potential reversals before they happen.
Versatile Tool: You can use divergence with multiple indicators like MACD or Stochastic for extra confirmation.
Better Timing: Pairing divergence with support/resistance levels or trendlines helps you fine-tune your entries and exits.
How to Trade Divergence Like a Pro
Combine divergence signals with major support/resistance levels for stronger setups.
Always wait for confirmation—like a breakout or a reversal candlestick—before taking action
Use stop losses to protect your trades in case the divergence doesn’t play out.
Visual Examples on the Charts
Take a look at the attached chart showing UPL Ltd (Bullish Divergence) and Tata Motors (Bearish Divergence) side by side.
UPL Ltd: The price made a lower low, but RSI made a higher low, leading to a strong bullish rally.
Tata Motors: The price formed a higher high, but RSI made a lower high, resulting in a bearish reversal.
Your Turn!
Have you spotted any divergences in stocks you’re tracking? Let me know in the comments!
If you found this helpful, don’t forget to like and follow for more educational trading content.

NAUKRI - INFOEDGE BUY IDEACMP - 6715
TARGET - 2%
STOPLOSS - 6543 (Trailing)
Naukri.com is an Indian employment website operating in India and Middle East. Naukri.com was founded in March 1997 by Indian businessman Sanjeev Bikhchandani, who started Info Edge Ltd. in 1995.
