FINCABLES 1 Day Time Frame 📈 Latest Price Snapshot (Daily)
Approx. Current Price: ~ ₹780 – ₹786 (recent trading close / live range)
Recent Day’s High/Low Range: ~ ₹748 – ₹789
52-Week Range: Low ~₹707 | High ~₹1,189
📊 Daily Technical Levels (Support / Resistance / Pivot)
Technical pivot zones for today’s 1-day timeframe:
Level Type Price Approx.
Resistance 3 (R3) ~ ₹805
Resistance 2 (R2) ~ ₹797
Resistance 1 (R1) ~ ₹785
Pivot Point (PP) ~ ₹777
Support 1 (S1) ~ ₹765
Support 2 (S2) ~ ₹758
Support 3 (S3) ~ ₹745
Derived from real-time pivot calculations & chart studies for daily timeframe.
📌 How to Use These Levels Today
🔹 Bullish Scenario
Break & hold above ₹785–₹790 → potential short-term continuation up to ₹797–₹805.
A strong daily close above ~₹805 signals further upside momentum for the next legs.
🔸 Bearish Scenario
Below Pivot ~₹777 → increased risk toward ₹765 and deeper to ₹758–₹745.
A daily close under ₹758 could expose sellers and widen the downside.
📍 Key Intraday Reference
Pivot ~₹777 — acts as the central reference for trend bias today.
Range watch: ₹765–₹785 is the immediate trade zone.
🧠 Summary (1-Day View)
✔ Immediate resistance: ₹785–₹805
✔ Immediate support: ₹765–₹745
✔ Pivot: ~₹777
✔ Price action bias: Neutral-to-bearish with potential for short-term retracement or bounce
Tradingforlife

XAUUSD (H1) – Trading BUY Liquidity Stay bullish with the rising channel, buy the pullback into liquidity
Quick view
Gold is still moving inside a rising channel. After the strong impulsive push, price is now consolidating / compressing. For today, I’m prioritising BUY setups at liquidity + trendline retests, while keeping a reaction SELL plan at the premium Fibonacci zone above.
Macro context (why volatility can stay elevated)
Trump signing a record number of executive orders and the growing shift of power towards the executive branch increases policy uncertainty (tariffs, federal cuts, geopolitical moves). In uncertain environments, flows often rotate into safe-haven assets like gold.
That said, this kind of headline risk can also move the USD sharply, so the best approach is still: trade the levels, not emotions.
Key Levels (from your chart)
✅ Buy zone Liquidity: 4410 – 4413
✅ Buy trendline retest: 4480 – 4483
✅ Sell zone (Fibo 1.618): 4603 – 4606
Today’s trading scenarios (Liam style: trade the level)
1) BUY scenario (priority)
A. Trendline retest = best structural entry
Buy: 4480 – 4483
SL: below the zone (guide: 4472–4475, adjust on lower TF / spread)
TP1: 4515 – 4520
TP2: 4580 – 4600
B. Deeper liquidity buy (if we get a sweep)
Buy: 4410 – 4413
SL: below the zone (guide: 4402–4405)
TP: 4480 → 4520
Logic: These are the cleanest liquidity areas on the chart. No chasing mid-range — I only act when price returns to the zone and reacts.
2) SELL scenario (reaction only — no chasing)
Sell: 4603 – 4606
SL: 4612
TP1: 4550
TP2: 4483
Logic: The 1.618 premium zone often attracts profit-taking. I only sell if price taps the zone and shows clear weakness on the lower timeframe.
Notes
If price keeps holding the trendline and printing higher lows → BUY bias remains stronger.
If we break the trendline and fail to reclaim it → reduce size and wait for a fresh structure.
Which side are you leaning today: buying the pullback, or waiting for 4603–4606 to sell the reaction?

SME IPO Buzz: The New-Age Gateway to Huge Profit OpportunitiesIn recent years, SME IPOs (Small and Medium Enterprise Initial Public Offerings) have emerged as one of the most talked-about wealth-creation avenues in the Indian stock market. While mainboard IPOs attract headlines and institutional money, SME IPOs have quietly delivered extraordinary listing gains and multi-bagger returns, especially during bullish market phases. For investors willing to understand the structure, risks, and strategy behind SME IPO investing, this segment can unlock outsized profit potential compared to traditional equity investments.
Understanding SME IPOs
SME IPOs are public issues launched by small and medium-sized companies on dedicated platforms such as NSE Emerge and BSE SME. These companies are typically in early or growth stages and use IPO proceeds to fund expansion, working capital, technology upgrades, or debt reduction. Unlike mainboard IPOs, SME IPOs have lower issue sizes, limited float, and fewer participants, which often leads to sharp price movements after listing.
The regulatory framework for SME IPOs is simpler, with reduced compliance costs. However, these IPOs usually come with higher minimum investment requirements, often ranging from ₹1–2 lakh per lot, making them more suitable for serious investors rather than casual retail participants.
Why SME IPOs Create Huge Buzz
The buzz around SME IPOs is driven by one key factor: explosive returns. It is not uncommon to see SME IPOs listing at 50%, 100%, or even 300% premiums on debut. The reasons behind such sharp moves include low supply of shares, aggressive subscription numbers, and strong grey market sentiment.
Additionally, many SME companies operate in niche or sunrise sectors such as specialty chemicals, precision engineering, logistics, renewable components, fintech services, or digital platforms. When these businesses show scalable models and improving financials, the market quickly re-rates their valuations.
Another powerful driver of buzz is retail and HNI dominance. Since institutional participation is limited in SME IPOs, demand from high-net-worth individuals often pushes subscription figures into double or triple digits, creating a strong momentum-driven rally post listing.
Key Advantages of Investing in SME IPOs
1. High Growth Potential
SME companies start from a smaller base. Even moderate business expansion can result in exponential growth in revenues and profits, translating into sharp stock price appreciation.
2. Limited Float, Higher Volatility
Lower share availability often leads to demand-supply imbalance, causing sharp upward price movements. For short-term investors, this volatility can mean quick listing gains.
3. Early Entry into Future Mainboard Stocks
Many successful SME stocks eventually migrate to the mainboard exchanges. Investors who enter early benefit from valuation expansion and increased liquidity over time.
4. Market Inefficiency Advantage
SME IPOs are less tracked by analysts and media, allowing informed investors to spot undervalued opportunities before they become widely known.
Risks You Must Not Ignore
Despite the buzz, SME IPOs are not risk-free. The same factors that create massive upside can also result in sharp downside.
Low Liquidity Post Listing: Exiting large positions can be difficult if volumes dry up.
Corporate Governance Risks: Smaller companies may lack robust governance structures.
Business Concentration: Many SMEs depend on a single product, client, or sector.
Price Manipulation: Due to low float, prices can be easily influenced by operators.
Hence, blindly applying to every SME IPO purely based on hype can be dangerous.
How to Select Winning SME IPOs
1. Financial Strength
Focus on consistent revenue growth, improving margins, healthy return ratios (ROE, ROCE), and manageable debt levels.
2. Business Model & Scalability
Look for companies with scalable models, diversified customer bases, and clear growth visibility.
3. Promoter Credibility
Promoters’ background, industry experience, and stake retention post IPO are critical indicators of long-term intent.
4. Use of IPO Proceeds
Funds used for growth and expansion are far more positive than those primarily meant for debt repayment or promoter exits.
5. Valuation Comparison
Compare valuations with listed peers in the same sector. Overpriced issues may struggle post listing despite strong subscriptions.
Listing Gains vs Long-Term Wealth
SME IPO investing can be approached in two distinct ways:
Listing Gain Strategy: Focus on subscription trends, grey market premium (GMP), and overall market sentiment to capture quick profits.
Long-Term Holding Strategy: Identify fundamentally strong SMEs with potential to become future mid-cap or large-cap leaders.
Smart investors often blend both approaches—booking partial profits on listing day while holding the rest for long-term compounding.
SME IPOs and Market Cycles
SME IPO performance is highly sensitive to market cycles. During bullish phases, liquidity flows aggressively into high-risk, high-reward segments like SME IPOs. In bearish or volatile markets, interest fades quickly. Timing your participation based on broader market sentiment significantly improves success rates.
The Psychology Behind SME IPO Mania
The excitement around SME IPOs is also psychological. Stories of small investments turning into massive profits create FOMO (Fear of Missing Out) among investors. Social media, WhatsApp groups, and grey market chatter amplify this sentiment. Successful investors, however, separate facts from hype and rely on data-driven analysis rather than emotions.
Conclusion: Opportunity with Responsibility
The SME IPO buzz is real, and the profit potential is undeniable. For investors who combine disciplined analysis, risk management, and patience, SME IPOs can become a powerful wealth-creation tool. However, this segment rewards knowledge and punishes recklessness. Not every SME IPO is a goldmine, but carefully chosen ones can deliver returns that far outperform traditional investments.
In the evolving Indian capital market, SME IPOs represent the entrepreneurial heartbeat of the economy—small companies with big ambitions. If approached wisely, they offer not just short-term listing gains, but the chance to participate early in tomorrow’s market leaders.

Understanding Market Phases to Anticipate the FutureOutlook Cycle Secrets
In the world of investing, trading, and economic decision-making, success is rarely driven by luck alone. It is shaped by the ability to understand where the economy and markets stand in a broader cycle and how that position influences future outcomes. The concept of the outlook cycle refers to the recurring phases through which economies, industries, and financial markets move over time. These cycles are not random; they are influenced by human behavior, policy decisions, capital flows, innovation, and external shocks. Unlocking the “secrets” of the outlook cycle allows investors, businesses, and policymakers to make informed, forward-looking decisions rather than reacting emotionally to headlines.
What Is an Outlook Cycle?
An outlook cycle represents the collective expectations about the future—growth, inflation, profits, employment, and stability—and how those expectations evolve over time. Markets are inherently forward-looking. Prices today often reflect what participants believe will happen six months, one year, or even several years ahead. As expectations rise or fall, they drive asset prices, capital allocation, and risk appetite.
Typically, outlook cycles align with broader economic cycles and can be divided into four main phases: recovery, expansion, slowdown, and contraction. Each phase carries distinct characteristics in terms of sentiment, liquidity, policy stance, and asset performance. Understanding these phases is the foundation of mastering outlook cycle dynamics.
Phase One: Recovery – The Birth of Optimism
The recovery phase begins after a downturn or crisis. Economic data is still weak, unemployment may be high, and corporate earnings are often depressed. However, the outlook starts to improve because the pace of deterioration slows. This is a crucial secret of the outlook cycle: markets often bottom out when conditions look the worst, not when they look good.
During recovery, central banks usually maintain accommodative policies such as low interest rates and liquidity support. Governments may introduce stimulus measures to revive growth. Investor sentiment remains cautious, but early movers begin positioning for future improvement. Historically, equities and risk assets perform strongly in this phase because valuations are low and expectations are modest.
The key insight here is that improving expectations matter more than absolute conditions. Those who wait for “clear confirmation” often miss the most powerful part of the cycle.
Phase Two: Expansion – Confidence Takes Control
Expansion is the most comfortable and visible phase of the outlook cycle. Economic growth becomes broad-based, corporate earnings rise, employment improves, and consumer confidence strengthens. Credit flows freely, business investment increases, and innovation accelerates.
Market sentiment during expansion is optimistic. Risk appetite is high, and capital rotates into equities, commodities, and growth-oriented sectors. Media narratives reinforce positive outlooks, often highlighting long-term growth stories and structural transformations.
However, one of the hidden secrets of the outlook cycle is that the seeds of future slowdown are often planted during expansion. Excessive leverage, asset bubbles, rising costs, and overconfidence can quietly build beneath the surface. While expansion can last for years, it is also the phase where discipline becomes most important.
Phase Three: Slowdown – The Turning Point
The slowdown phase is subtle and often misunderstood. Growth does not collapse immediately; instead, it decelerates. Inflationary pressures may rise, prompting central banks to tighten monetary policy. Interest rates increase, liquidity conditions tighten, and borrowing becomes more expensive.
Corporate margins may start to compress as costs rise faster than revenues. Leading indicators—such as purchasing manager indices, yield curves, and credit spreads—begin to signal stress even while headline economic data still looks healthy.
The critical secret in this phase is recognizing that markets respond to the rate of change, not the level. Even strong growth can lead to weak market performance if expectations peak and begin to decline. Defensive sectors, quality assets, and cash preservation strategies become increasingly important during this stage.
Phase Four: Contraction – Fear and Opportunity
Contraction is marked by falling economic output, declining profits, rising unemployment, and reduced consumer spending. Sentiment turns pessimistic, risk appetite collapses, and capital seeks safety. This phase often follows a policy mistake, financial imbalance, or external shock such as geopolitical conflict or a global crisis.
While contraction is emotionally difficult, it holds some of the most powerful opportunities for long-term investors. Valuations reset, inefficient businesses are cleared out, and new cycles begin to form. Policy responses—rate cuts, stimulus packages, and reforms—lay the groundwork for the next recovery.
The ultimate outlook cycle secret is this: every contraction contains the blueprint for the next expansion. Those who can detach emotionally and focus on long-term fundamentals are best positioned to benefit.
The Role of Psychology in Outlook Cycles
Human psychology plays a central role in shaping outlook cycles. Fear and greed amplify market movements, often pushing prices far beyond intrinsic value in both directions. During expansions, optimism can become complacency. During contractions, fear can turn into despair.
Understanding behavioral biases—such as herd mentality, confirmation bias, and loss aversion—helps decode why outlook cycles tend to overshoot. Markets do not simply reflect economic reality; they reflect collective belief systems about the future.
Using Outlook Cycles as a Strategic Tool
Mastering outlook cycle secrets is not about predicting exact tops or bottoms. It is about positioning intelligently across phases. Traders may focus on short-term momentum shifts, while long-term investors align portfolios with the dominant phase of the cycle.
Diversification, risk management, and flexibility are essential. As cycles evolve, so should strategies. Static thinking is one of the biggest enemies of success in cyclical markets.
Conclusion: Thinking Ahead of the Crowd
The outlook cycle is a powerful framework for understanding how economies and markets evolve over time. By focusing on expectations, sentiment, policy direction, and the rate of change rather than headlines alone, one can gain a meaningful edge.
The real secret lies in thinking independently and ahead of the crowd—buying when optimism is scarce, exercising caution when confidence is excessive, and always remembering that cycles are inevitable. Those who respect the rhythm of the outlook cycle are better equipped not only to protect capital but also to grow it consistently across changing market environments.

Two Powerful Approaches to Understanding Financial MarketsTechnical Analysis vs Fundamental Analysis
In the world of trading and investing, decision-making is driven by analysis. Among the many methods available, technical analysis and fundamental analysis stand out as the two most widely used and debated approaches. Both aim to identify profitable opportunities in financial markets, yet they differ significantly in philosophy, tools, time horizon, and interpretation of market behavior. Understanding the strengths, limitations, and appropriate use of each method is essential for traders and investors seeking consistency and clarity in their strategies.
Understanding Technical Analysis
Technical analysis is the study of price movements, volume, and market patterns to forecast future price behavior. It is based on the belief that all available information—economic, political, and psychological—is already reflected in the price. Therefore, instead of focusing on why a price moves, technical analysts focus on how it moves.
At its core, technical analysis relies on charts and indicators. Traders examine historical price data to identify trends, support and resistance levels, chart patterns, and momentum signals. Common tools include moving averages, Relative Strength Index (RSI), MACD, Bollinger Bands, Fibonacci retracements, and candlestick patterns.
One of the foundational principles of technical analysis is that price trends tend to repeat due to human psychology. Fear, greed, hope, and panic create recognizable patterns over time. For example, breakouts, pullbacks, and reversals often occur in similar ways across different markets and time frames.
Technical analysis is especially popular among short-term traders, such as intraday traders, scalpers, and swing traders. These participants need precise entry and exit points, which technical tools provide. Since technical analysis can be applied to any tradable instrument—stocks, forex, commodities, cryptocurrencies, or indices—it is highly versatile.
However, technical analysis has limitations. Indicators are often derived from past prices, which means they can lag in fast-moving markets. False breakouts and whipsaws can lead to losses if risk management is poor. Additionally, technical analysis does not directly account for major fundamental events such as earnings surprises, policy changes, or geopolitical shocks.
Understanding Fundamental Analysis
Fundamental analysis focuses on evaluating the intrinsic value of an asset by examining economic, financial, and qualitative factors. The goal is to determine whether an asset is undervalued, fairly valued, or overvalued compared to its current market price.
In stock markets, fundamental analysis involves studying a company’s financial statements, including revenue, profit, cash flow, debt, and margins. Key metrics such as earnings per share (EPS), price-to-earnings (P/E) ratio, return on equity (ROE), and growth rates play a crucial role. Beyond numbers, analysts also assess management quality, competitive advantage, industry position, and long-term business sustainability.
In other markets, such as forex or commodities, fundamental analysis revolves around macroeconomic indicators. Interest rates, inflation, GDP growth, trade balances, central bank policies, and global supply-demand dynamics are central to valuation.
Fundamental analysis is most commonly used by long-term investors and positional traders. These market participants believe that, over time, prices will converge toward intrinsic value. For example, an investor may buy shares of a fundamentally strong company during temporary market weakness and hold them for years.
The strength of fundamental analysis lies in its ability to identify long-term wealth creation opportunities. It helps investors stay aligned with economic reality and business performance rather than short-term market noise.
However, fundamental analysis also has drawbacks. Markets can remain irrational longer than expected, meaning undervalued assets may stay undervalued for extended periods. Fundamental data is often released quarterly or monthly, making it less useful for short-term timing. Additionally, interpreting fundamentals requires assumptions about future growth, which may not always materialize.
Key Differences Between Technical and Fundamental Analysis
The most important difference between the two approaches lies in their focus. Technical analysis focuses on price behavior and market action, while fundamental analysis focuses on underlying value and financial strength.
Another major distinction is time horizon. Technical analysis is generally used for short- to medium-term trades, whereas fundamental analysis is better suited for medium- to long-term investments.
The data used also differs. Technical analysts rely on charts, indicators, and price history, while fundamental analysts study financial statements, economic reports, and industry trends.
In terms of decision-making, technical analysis emphasizes timing—when to enter and exit—while fundamental analysis emphasizes selection—what to buy or sell.
Which Is Better: Technical or Fundamental Analysis?
The debate over which approach is superior has existed for decades, but the reality is that neither is universally better. Their effectiveness depends on the trader’s goals, personality, and market conditions.
Short-term traders often prefer technical analysis because price movements and momentum matter more than long-term value in the near term. Long-term investors tend to rely on fundamental analysis because business performance and economic growth drive returns over time.
Many successful market participants adopt a hybrid approach, combining both methods. For example, an investor may use fundamental analysis to identify strong companies and then apply technical analysis to time entries and exits. This combination helps align value with market timing, reducing risk and improving consistency.
Conclusion
Technical analysis and fundamental analysis represent two different lenses through which financial markets can be understood. Technical analysis interprets market behavior through price and patterns, making it ideal for timing and short-term strategies. Fundamental analysis evaluates intrinsic value and economic strength, making it essential for long-term investment decisions.
Rather than viewing them as opposing philosophies, traders and investors should see them as complementary tools. Mastering both provides a deeper, more balanced understanding of markets, enabling better decisions across different market phases. In a complex and ever-changing financial world, the ability to adapt and integrate multiple perspectives is often the true edge.

Premium Chart Patterns Why Chart Patterns Work
Chart patterns work because they reflect real market behavior.
Key reasons:
✔ Human psychology repeats
People fear losses and chase gains. This creates repeatable price movements.
✔ Institutions accumulate or distribute slowly
Big players cannot buy or sell at once—they create patterns during accumulation/distribution.
✔ Liquidity zones
Patterns often form near liquidity pools where many stop-loss orders exist.
✔ Self-fulfilling nature
When many traders recognize the same pattern, they take similar trades, increasing accuracy.

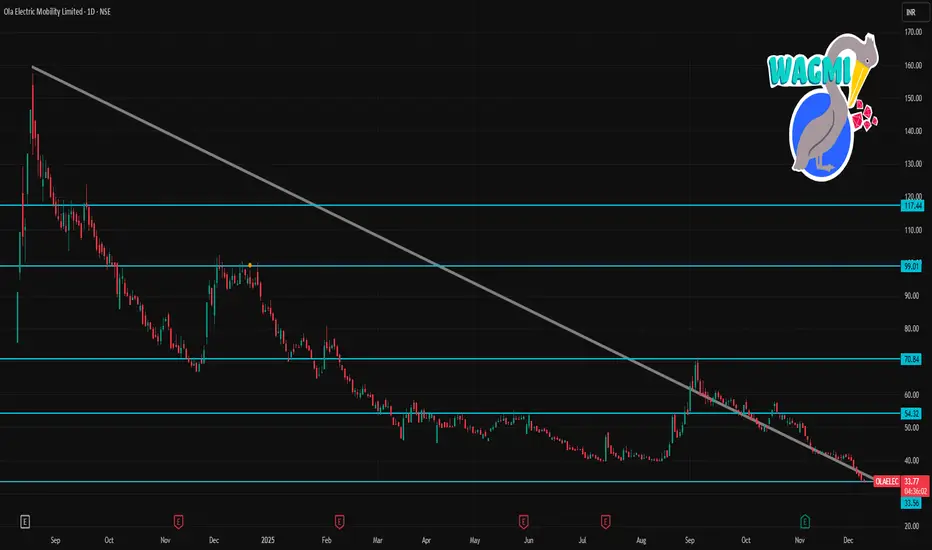
OLAELEC 1 Day Time Frame 📊 Key Daily Levels (Support & Resistance)
From pivot analysis & live technical indicators (today’s data):
Pivot: ~₹34.72
Resistance Levels:
• R1 ~ ₹35.83
• R2 ~ ₹37.56
• R3 ~ ₹38.67
Support Levels:
• S1 ~ ₹32.99
• S2 ~ ₹31.88
• S3 ~ ₹30.15
These are the real-time intraday/daily pivot support & resistance levels traders watch for short term moves.
Alternative pivot data from recent technical sites (slightly different levels):
Pivot: ~₹41.34
Resistance: ~₹41.8 / ₹42.4 / ₹42.9
Support: ~₹40.7 / ₹40.3 / ₹39.7
Part 2 Master Candle Stick PatternBasic Terminology
To understand options properly, several terms must be clear:
1. Strike Price
The price at which the option buyer can buy or sell the underlying.
2. Premium
The price paid by the option buyer to the seller.
Buyers pay the premium; sellers receive it.
3. Expiry
All options have a time limit. On expiry day, the option settles based on the underlying price.
4. In-the-Money (ITM)
Options with intrinsic value.
Example: Call with strike below current price.
5. Out-of-the-Money (OTM)
Options with no intrinsic value, only time value.
6. At-the-Money (ATM)
Strike price is closest to the underlying price.
7. Lot Size
Options are not traded 1 unit at a time. Each contract has a predefined lot size (e.g., Nifty = 50 units).

Part 1 Master Candle Stick Pattern Put Options Explained
A put option increases in value when the price of the underlying asset falls.
Example:
Nifty is at 20,000. A trader buys a Nifty 19,900 Put Option.
If Nifty falls below 19,900, the put option value rises.
Put option buyers expect the price to go down.
Put option sellers expect the price to stay above the strike.

What Are Trading Orders? A Beginner’s Guide1. Introduction to Trading Orders
A trading order is essentially an instruction from a trader to a broker or trading platform to buy or sell a financial instrument. Trading orders tell the broker:
What to trade (stock, commodity, currency, etc.)
How much to trade (quantity or lots)
When to trade (immediately or under certain conditions)
At what price (market price or specific price level)
Without an order, no trade can occur. Orders are the bridge between your trading strategy and execution in the market.
1.1 Why Trading Orders Matter
Trading orders are not just procedural—they affect your trading results. Correct order selection can:
Improve execution speed
Reduce slippage (difference between expected and actual price)
Control risk (through stop losses or limit orders)
Allow automation of trades for efficiency
Traders who understand how to use orders effectively can manage trades systematically rather than relying on guesswork or emotion.
1.2 Key Components of a Trading Order
Every trading order typically includes the following:
Type of Order: Market, limit, stop, etc.
Quantity/Size: How many shares, lots, or contracts to buy/sell.
Price Specification: At what price the order should be executed.
Duration/Validity: How long the order remains active (e.g., day order, GTC).
Special Instructions: Optional features like “all or none” (AON) or “immediate or cancel” (IOC).
Understanding these components ensures traders can communicate their intentions clearly to the market.
2. Types of Trading Orders
Trading orders can be broadly divided into market orders, limit orders, stop orders, and advanced orders. Each has distinct characteristics and uses.
2.1 Market Orders
A market order is an instruction to buy or sell immediately at the current market price. Market orders prioritize speed of execution over price.
Advantages:
Fast execution
Guaranteed to fill if liquidity exists
Disadvantages:
Price uncertainty, especially in volatile markets
Potential for slippage
Example:
You want to buy 100 shares of XYZ Corp, currently trading at ₹500. Placing a market order will buy shares at the next available price, which could be slightly higher or lower than ₹500.
2.2 Limit Orders
A limit order specifies the maximum price to buy or minimum price to sell. The trade executes only if the market reaches that price.
Advantages:
Controls execution price
Useful in volatile markets
Disadvantages:
May not execute if price is not reached
Missed opportunities if price moves away
Example:
You want to buy XYZ Corp at ₹495. A limit order at ₹495 will only execute if the price drops to ₹495 or below.
2.3 Stop Orders
Stop orders become market orders once a specific price is reached. They are primarily used to limit losses or lock in profits.
Stop-Loss Order: Sells automatically to prevent further loss.
Stop-Buy Order: Used in breakout strategies to buy when a price crosses a threshold.
Example:
You hold shares of XYZ Corp bought at ₹500. To prevent large losses, you place a stop-loss at ₹480. If the price falls to ₹480, your shares are sold automatically.
2.4 Stop-Limit Orders
A stop-limit order is a combination of stop and limit orders. Once the stop price is triggered, the order becomes a limit order instead of a market order.
Advantages:
Provides price control while using stops
Reduces risk of selling too low in volatile markets
Disadvantages:
Risk of not executing if price moves quickly beyond limit
Example:
Stop price: ₹480, Limit price: ₹478. If XYZ Corp drops to ₹480, the order becomes a limit order to sell at ₹478 or better.
2.5 Trailing Stop Orders
A trailing stop is dynamic, moving with the market price to lock in profits while limiting losses.
Useful for locking gains in trending markets
Automatically adjusts stop price as market moves favorably
Example:
You buy shares at ₹500 and set a trailing stop at ₹10. If the stock rises to ₹550, the stop automatically moves to ₹540. If the price then falls, the trailing stop triggers at ₹540.
2.6 Other Advanced Orders
One-Cancels-Other (OCO) Orders: Executes one order and cancels the other automatically. Useful for breakout or range trades.
Good Till Cancelled (GTC) Orders: Remain active until manually canceled.
Immediate or Cancel (IOC): Executes immediately, cancels unfilled portion.
Fill or Kill (FOK): Executes entire order immediately or cancels it completely.
These advanced orders allow traders to automate strategies and manage risk efficiently.
3. Order Duration and Validity
Trading orders are not indefinite. Traders must choose a duration for each order:
Day Order: Expires at market close if not executed.
Good Till Cancelled (GTC): Stays active until filled or manually canceled.
Good Till Date (GTD): Active until a specified date.
Immediate or Cancel (IOC): Executes immediately or cancels unfilled portion.
Choosing the right duration affects execution probability and risk management.
4. Choosing the Right Order Type
Choosing the appropriate order type depends on trading goals, market conditions, and risk tolerance.
For beginners: Market and limit orders are easiest to use.
For risk management: Stop-loss and trailing stops are essential.
For advanced strategies: OCO, FOK, and GTC orders help automate trades.
Key Considerations:
Market volatility
Liquidity of the asset
Time available to monitor trades
Risk tolerance
5. Practical Examples of Trading Orders
Let’s examine some real-life trading scenarios:
Buying at Market Price: You want instant execution for 50 shares of Infosys. Place a market order; shares execute at the best available price.
Buying at a Discount: You want to buy 50 shares of Infosys if the price falls to ₹1500. Place a limit order at ₹1500; the order executes only if the price drops.
Protecting Profits: You bought shares at ₹1500. To lock gains, you place a trailing stop at ₹50. If the price rises to ₹1600, the stop moves to ₹1550, securing profits if the price falls.
Breakout Strategy: You expect Infosys to rise above ₹1600. Place a stop-buy order at ₹1600. If the price crosses ₹1600, the order triggers and you enter the trade.
6. Risks and Considerations
Trading orders are powerful but not foolproof. Common risks include:
Slippage: Execution at a worse price than expected.
Partial fills: Only part of the order executes.
Liquidity risk: Low trading volume can prevent execution.
Overuse of stops: Placing stops too close may trigger premature exits.
Emotional trading: Avoid constantly changing orders based on fear or greed.
Mitigating these risks involves planning, strategy, and disciplined execution.
7. Technology and Trading Orders
Modern trading platforms have transformed order execution:
Electronic trading: Fast, accurate, with minimal human error.
Algorithmic trading: Automates orders based on pre-defined criteria.
Mobile trading apps: Allow order management on the go.
APIs: Enable advanced traders to execute complex strategies programmatically.
Technology makes trading more efficient but requires understanding to avoid mistakes.
8. Tips for Beginners
Start with market and limit orders.
Use stop-loss orders to manage risk.
Understand order duration and use GTC orders cautiously.
Avoid overcomplicating trades with too many advanced orders initially.
Practice on demo accounts before real capital.
Keep a trade journal to track order types, outcomes, and lessons.
Conclusion
Trading orders are the foundation of every trade. They bridge your strategy and market execution, determine price, timing, and risk control. Understanding the different types—market, limit, stop, stop-limit, trailing stops, and advanced orders—allows traders to execute strategies systematically. Combining the right order types with risk management, technology, and discipline empowers beginners to trade confidently and efficiently.
In essence, mastering trading orders is mastering the mechanics of trading. Without it, even the best strategies may fail. With it, even a novice trader can navigate financial markets with clarity and purpose.
Part 4 Learn Institutional TradingIntermediate Option Strategies
Straddle – Buy Call + Buy Put (same strike/expiry). Best for high volatility.
Strangle – Buy OTM Call + Buy OTM Put. Cheaper than straddle.
Bull Call Spread – Buy lower strike call + Sell higher strike call.
Bear Put Spread – Buy higher strike put + Sell lower strike put.
Advanced Option Strategies
Iron Condor – Sell OTM call + OTM put, hedge with farther strikes. Good for sideways market.
Butterfly Spread – Combination of multiple calls/puts to profit from low volatility.
Calendar Spread – Buy long-term option, sell short-term option (same strike).
Ratio Spread – Sell multiple options against fewer long options.
Hedging with Options
Options aren’t just for speculation; they’re powerful hedging tools.
Portfolio Hedge: If you own a basket of stocks, buying index puts protects against a market crash.
Currency Hedge: Importers/exporters use currency options to lock exchange rates.
Commodity Hedge: Farmers hedge crops using options to lock minimum prices.

Part 3 Learn Institutional TradingCall Options & Put Options Explained
Options are of two types:
🔹 Call Option
Gives the right to buy an asset at a fixed price.
Buyers of call options are bullish (expect prices to rise).
👉 Example:
If Nifty is at 22,000 and you buy a 22,100 Call Option for ₹100 premium, you pay ₹100 × lot size (say 50) = ₹5,000.
If Nifty rises to 22,400, the 22,100 call is worth 300 points. Profit = (300 - 100) × 50 = ₹10,000.
If Nifty stays below 22,100, you lose only the premium ₹5,000.
🔹 Put Option
Gives the right to sell an asset at a fixed price.
Buyers of put options are bearish (expect prices to fall).
👉 Example:
If Bank Nifty is at 48,000 and you buy a 47,800 Put for ₹200 premium, lot size = 15.
If Bank Nifty falls to 47,000, option value = 800 points. Profit = (800 - 200) × 15 = ₹9,000.
If Bank Nifty stays above 47,800, you lose only premium = ₹3,000.
So:
Call = Bullish bet.
Put = Bearish bet.

Mastering the Art of Risk Management in Trading 1. Introduction: Why Risk Management is the Heart of Trading
Trading is not about making big profits quickly — it’s about staying in the game long enough to let your edge work for you.
Think of trading like a professional sport. Skill matters, but survival matters more. Even the world’s best traders lose trades; what separates them from amateurs is how they manage those losses.
In simple terms:
Good trading without risk management = gambling.
Average trading with strong risk management = long-term success.
Warren Buffett’s famous rules apply perfectly here:
Don’t lose money.
Never forget rule #1.
2. Core Principles of Risk Management
Before we go deep into strategies, let’s lock in the foundation.
2.1 Risk is Inevitable
Every trade carries risk. The goal is not to avoid it but to control its size and impact.
2.2 Asymmetry in Trading
A 50% loss requires a 100% gain to break even. This means avoiding large drawdowns is far more important than chasing big wins.
Loss % Required Gain to Recover
10% 11.1%
25% 33.3%
50% 100%
75% 300%
2.3 Risk per Trade
Most professional traders risk 0.5%–2% of their account per trade.
This ensures no single bad trade can destroy the account.
3. The Psychology of Risk
Risk management is not just math — it’s deeply psychological.
Loss Aversion Bias: Humans feel losses twice as strongly as gains. This can push traders into revenge trading.
Overconfidence Bias: Winning streaks can lead to oversized positions.
Fear of Missing Out (FOMO): Chasing trades without proper entry rules increases risk.
A great risk management system removes emotional decision-making by setting clear, mechanical rules.
4. Position Sizing: The Risk Control Lever
Position sizing determines how much capital to put into a trade. Even if your strategy is perfect, bad sizing can blow up your account.
4.1 Fixed Fractional Method
Risk a fixed % of capital per trade.
Example: If account = ₹10,00,000 and risk = 1% → Risk per trade = ₹10,000.
If Stop Loss = ₹50 away from entry, position size = ₹10,000 ÷ ₹50 = 200 shares.
4.2 Volatility-Based Position Sizing
Adjust position size according to the volatility of the asset (ATR – Average True Range).
If ATR = ₹25 and your risk budget = ₹5,000, position size = ₹5,000 ÷ ₹25 = 200 shares.
4.3 Kelly Criterion (Advanced)
Maximizes capital growth based on win rate & reward/risk ratio.
Formula: K% = W – (1 – W) / R
Where:
W = Win probability
R = Reward/Risk ratio
Caution: Kelly is aggressive; use fractional Kelly for real trading.
5. Stop Loss Strategies: Your Safety Net
A stop loss is not a sign of weakness — it’s a shield.
5.1 Fixed Stop Loss
Predefined point in price where you exit.
5.2 Volatility Stop Loss
Adjust stop distance using ATR to account for market noise.
5.3 Time-Based Stop
Exit after a fixed time if the trade hasn’t moved in your favor.
5.4 Trailing Stop
Moves with price in your favor to lock in profits.
Golden Rule: Place stops based on market structure, not emotions.
6. Reward-to-Risk Ratio (RRR)
The RRR tells you how much you stand to gain for every unit you risk.
Example:
Risk: ₹1000
Reward: ₹3000
RRR = 3:1 → Even a 40% win rate is profitable.
High RRR trades allow more losers than winners while staying profitable.
7. Diversification & Correlation Risk
7.1 Asset Diversification
Avoid putting all capital into one asset or sector.
7.2 Correlation Risk
If you buy Nifty futures and Bank Nifty futures, you’re effectively doubling your risk because they move together.
8. Risk Management for Different Trading Styles
8.1 Day Trading
Keep daily loss limits (e.g., 3% of capital).
Avoid revenge trading after a loss.
8.2 Swing Trading
Use wider stops to allow for multi-day fluctuations.
Position sizing becomes even more critical.
8.3 Options Trading
Risk can be higher due to leverage.
Always calculate max loss before entering.
9. Risk Management Tools
ATR Indicator – For volatility-based stops.
Position Size Calculators – To control exposure.
Heat Maps & Correlation Tools – To avoid overexposure.
Journaling Software – To track mistakes.
10. Risk-Adjusted Performance Metrics
Professional traders measure performance relative to risk taken.
Sharpe Ratio – Risk-adjusted returns.
Sortino Ratio – Focuses on downside volatility.
Max Drawdown – Largest account drop during a period.
11. Building a Personal Risk Management Plan
Your plan should cover:
Max % of capital risked per trade.
Max daily/weekly loss limit.
Position sizing rules.
Stop loss & target placement method.
Diversification guidelines.
Rules for scaling in/out.
Plan for handling drawdowns.
12. Advanced Concepts
12.1 Portfolio Heat
Sum of all open trade risks; keep it below a set % of account.
12.2 Value at Risk (VaR)
Estimates the max expected loss over a time frame.
12.3 Stress Testing
Simulate worst-case scenarios (e.g., gap downs, black swans).
Conclusion: Risk Management is Your Superpower
In trading, capital is ammunition. Risk management ensures you never run out of bullets before the big opportunities arrive.
Mastering it is not optional — it’s the difference between a short-lived hobby and a long-term career.
SME & IPO Trading Opportunities 1. Introduction
The stock market is a living, breathing organism — constantly evolving with trends, cycles, and opportunities. Two of the most exciting and profitable niches for traders and investors are Initial Public Offerings (IPOs) and Small & Medium Enterprise (SME) IPOs.
These areas often combine market hype, information asymmetry, liquidity surges, and price volatility — all of which can create significant profit opportunities for those who understand how to navigate them.
While IPOs of large companies grab headlines, SME IPOs are quietly becoming one of the fastest-growing segments in markets like India, offering massive potential for early movers. However, both IPOs and SME IPOs require sharp analysis, disciplined execution, and awareness of risks — because for every success story, there’s a cautionary tale.
2. Understanding IPOs and SME IPOs
2.1 What is an IPO?
An Initial Public Offering (IPO) is when a private company issues shares to the public for the first time to raise capital.
It’s like opening the gates for the public to invest in a business that was previously limited to private investors and founders.
Key purposes of an IPO:
Raise capital for expansion, debt repayment, or new projects.
Increase public visibility and brand credibility.
Provide an exit or partial liquidity to existing investors (VCs, PE funds, promoters).
2.2 What is an SME IPO?
An SME IPO is similar to a normal IPO, but it’s specifically for Small and Medium Enterprises — companies with smaller scale, market cap, and turnover.
They list on dedicated SME platforms such as:
NSE Emerge (National Stock Exchange)
BSE SME (Bombay Stock Exchange)
Differences from mainboard IPOs:
Feature Mainboard IPO SME IPO
Minimum Post-Issue Capital ₹10 crore ₹1 crore
Issue Size Large (hundreds/thousands of crores) Smaller (few crores to ~50 crore)
Lot Size Smaller (say ₹15,000) Larger (₹1-2 lakh minimum)
Investor Base Retail + QIB + HNI Primarily HNI + Limited Retail
Listing Main Exchange SME Platform
2.3 The Growing Popularity of SME IPOs in India
SME IPOs in India are booming because:
Huge wealth creation in the past few years (several SME IPOs have given 100%-500% returns post-listing).
Lower competition compared to mainboard IPOs.
Increasing investor participation via HNIs and informed retail investors.
Supportive regulations from SEBI for SMEs.
3. Why IPOs and SME IPOs Offer Trading Opportunities
3.1 The Hype Cycle
IPOs are heavily marketed through roadshows, advertisements, and media coverage. This creates a buzz and often leads to:
Oversubscription → Strong listing potential.
Emotional buying on Day 1 due to FOMO (Fear of Missing Out).
SME IPOs, though less advertised, also create strong niche hype within small-cap investor communities.
3.2 Information Asymmetry
Large institutional players often have detailed financial data and business insights — but in IPOs and SME IPOs, even retail investors get access to a prospectus (DRHP/RHP). Those who know how to read and interpret it can identify hidden gems before the crowd.
3.3 Volatility and Liquidity
Mainboard IPOs: Usually see high trading volumes on listing day → intraday traders love it.
SME IPOs: Lower liquidity but can see massive price jumps due to small free-float shares.
3.4 First-Mover Advantage
For fundamentally strong IPOs, getting in at the IPO price can mean riding a long-term growth story from the very beginning. Example: Infosys, TCS, Avenue Supermarts (DMart) IPO investors made multifold returns over years.
4. Types of Opportunities in IPO & SME IPO Trading
4.1 Listing Gains
Buy in IPO → Sell on listing day for profit.
Works best for oversubscribed IPOs with strong demand.
Example:
Nykaa IPO (2021) listed at ~78% premium.
Some SME IPOs list with 100%-300% premium.
4.2 Short-Term Swing Trades Post Listing
After listing, many IPOs see price discovery phases:
Some shoot up further due to momentum buying.
Others fall sharply after hype fades.
Traders can capture these 2–10 day swings.
4.3 Long-Term Investing
Identify fundamentally strong IPOs and SMEs that can grow significantly over 3–5 years.
Example: IRCTC IPO at ₹320 in 2019 → over ₹5,500 in 2021 (17x in 2 years).
4.4 SME Platform Migration
Some SME-listed companies eventually migrate to the mainboard exchange after meeting eligibility criteria — which can cause valuation re-rating and price jumps.
4.5 Pre-IPO Investments
For advanced traders/investors, investing in companies before they announce IPO plans can yield extraordinary gains when the IPO finally happens.
5. How to Identify High-Potential IPOs & SME IPOs
5.1 Key Financial Metrics
Revenue Growth Rate (Consistent >15–20%)
Profit Margins (Improving over time)
Return on Equity (ROE) (>15% is good)
Debt-to-Equity Ratio (Lower is better)
Cash Flow Consistency
5.2 Qualitative Factors
Industry growth potential.
Competitive advantage (Moat).
Strong management track record.
Promoter holding and their skin in the game.
5.3 Subscription Data
For IPOs, tracking subscription numbers daily:
High QIB (Qualified Institutional Buyer) subscription → good sign.
SME IPOs with oversubscription in HNI and retail often see strong listing.
5.4 Grey Market Premium (GMP)
The Grey Market is an unofficial market where IPO shares are traded before listing. GMP gives a rough idea of market expectations, but it’s not always reliable.
6. Risk Factors in SME & IPO Trading
6.1 Listing Day Disappointments
Not all IPOs list at a premium — some open below issue price (listing loss).
6.2 Hype vs Reality
Companies might look attractive in marketing materials but have weak fundamentals.
6.3 Low Liquidity in SME IPOs
Getting out quickly in SME IPOs can be tough — spreads can be huge.
6.4 Regulatory & Compliance Risks
SMEs sometimes face corporate governance issues or delayed disclosures.
7. Trading Strategies for IPOs & SME IPOs
7.1 For Listing Gains
Focus on IPOs with >20x oversubscription in QIB category.
Track GMP trends — consistent rise before listing is a bullish signal.
Avoid low-demand IPOs.
7.2 Post-Listing Momentum Trading
Use 5-min/15-min charts to catch intraday breakouts.
Set tight stop-loss (2–3%) due to volatility.
Volume analysis is critical.
7.3 Swing Trading SME IPOs
Wait for first 5–7 trading days after listing.
Buy on dips when price consolidates above listing price.
7.4 Long-Term Positioning
Enter strong companies post-listing dip (common after initial hype).
Monitor quarterly results for sustained growth.
7.5 Pre-IPO Placement Investing
Requires large capital and network access.
Higher risk but can yield 2x–5x returns at IPO.
8. Tools & Resources for IPO & SME IPO Trading
Stock exchange websites (NSE/BSE) for official IPO details.
SEBI filings for DRHP/RHP.
IPO subscription trackers (e.g., Chittorgarh, IPOWatch).
Financial news platforms for sentiment analysis.
Charting tools like TradingView for technical setups.
9. Case Studies
Case Study 1: Mainboard IPO Success
Avenue Supermarts (DMart)
IPO Price: ₹299 (2017)
Listing Price: ₹604 (+102%)
5-Year Return: 7x
Key Takeaway: Strong fundamentals + brand recall = multi-year wealth creation.
Case Study 2: SME IPO Multi-bagger
Essen Speciality Films (Listed on NSE Emerge)
Issue Price: ₹101 (2022)
1-Year Price: ₹400+ (4x)
Key Takeaway: Low float + strong earnings growth can lead to explosive returns.
Case Study 3: Listing Loss
Paytm
IPO Price: ₹2,150 (2021)
Listing Price: ₹1,950 (−9%)
Fell to ₹540 in 1 year.
Key Takeaway: High valuations without profitability can lead to severe post-listing crashes.
10. Future Outlook for SME & IPO Trading
Digital revolution → More SMEs tapping capital markets.
Retail investor growth → Higher demand for IPOs.
Regulatory support → Easier SME listings.
Sectoral trends like EV, renewable energy, fintech, and AI are likely to dominate IPO pipelines.
Conclusion
IPOs and SME IPOs present some of the most exciting and potentially profitable opportunities in the stock market — but they’re not for blind speculation.
Success requires:
Understanding the business and its valuation.
Reading market sentiment via subscription data, GMP, and news flow.
Executing trades with discipline (entry/exit plans).
Managing risk, especially in volatile SME IPOs.
For traders, these segments offer short bursts of high liquidity and volatility, perfect for intraday and swing plays. For long-term investors, they provide a chance to get in early on the next market leader.
In the coming years, SME IPOs are likely to become the new hotspot for aggressive wealth creation — but only for those who master the art of filtering hype from genuine opportunity.
