ZUARI 1 Week Time Frame 📊 Current Price Snapshot
The stock is trading around ₹330‑₹331 (approx) recently — showing strength above many moving averages.
📈 Weekly Time Frame – Key Levels
🔹 Support (Weekly)
₹303 – ₹305 — First major support zone (short‑term weekly) based on classic pivot & S2/S1 cluster.
₹300 – ₹302 — Secondary support (previous weekly pivot levels).
₹295 – ₹298 — Broader weekly support if deeper correction occurs.
📍 Important: These support levels align with pivot calculations and moving averages clustered below the current price.
🔺 Resistance (Weekly)
₹314 – ₹316 — Immediate resistance cluster seen on pivot and classic weekly resistance area.
₹318 – ₹320 — Next upside zone — breakout above this adds bullish reinforcement.
₹324 – ₹326+ — Higher weekly resistance if momentum sustains.
📍 Pivot calculations (classic & Fibonacci) place weekly R1 ~318, R2 ~324 and R3 near ~326‑329 zone.
📊 Moving Averages & Oscillators (Weekly Context)
Price above 20, 50, 100 & 200‑day EMAs indicating weekly bullish bias.
RSI ~57‑69 range — showing strength but not extreme overbought across short‑term weekly context.
Some oscillators show near‑neutral to bullish signals — supportive of upside continuation if resistance levels break.
Tradinghub

Part 4 Learn Institutional Trading Option Terminology
To trade options effectively, one must understand key terminologies:
Premium: The price paid to buy an option. It’s influenced by intrinsic and extrinsic factors.
Intrinsic Value: The value of the option if exercised immediately. For calls, it’s the difference between the underlying price and strike price if positive; for puts, it’s the difference between strike price and underlying price if positive.
Extrinsic Value (Time Value): The part of the premium based on time until expiration and volatility.
In-the-Money (ITM): A call is ITM if the underlying price is above the strike; a put is ITM if the underlying price is below the strike.
Out-of-the-Money (OTM): A call is OTM if the underlying price is below the strike; a put is OTM if above.
At-the-Money (ATM): The underlying price is equal to the strike price.

Part 4 Learn Institutional Trading Advantages of Options
1. Limited Risk for Buyers
Risk is capped at premium paid.
2. Leverage
You control large positions with small capital.
3. Flexibility
Trade direction, volatility, or time.
4. Income Generation
Option sellers earn steady premium income.
5. Hedging Capability
Protect long-term investments through puts.

Momentum Trading SecretsHow Traders Capture Powerful Market Moves
Momentum trading is one of the most popular and effective trading styles in financial markets. It is based on a simple but powerful idea: stocks, indices, or other assets that are moving strongly in one direction tend to continue moving in that direction for some time. Momentum traders do not try to predict bottoms or tops; instead, they ride the strength of an existing trend and exit when momentum weakens. Below is a detailed explanation of momentum trading secrets, strategies, and mindset, explained in depth.
1. Understanding the Core Concept of Momentum Trading
Momentum trading focuses on price strength, not valuation. Unlike value investors who look for underpriced stocks, momentum traders look for assets that are already performing well. The logic behind this approach is rooted in market psychology. When prices rise, more traders notice the move, news coverage increases, and buying pressure intensifies, creating a self-reinforcing cycle.
Momentum can exist in:
Stocks
Indices (like Nifty or Bank Nifty)
Commodities
Currencies
Cryptocurrencies
The key secret is recognizing that price action reflects collective market belief, and momentum traders align themselves with that belief rather than fighting it.
2. Identifying High-Momentum Stocks and Assets
One of the biggest secrets of successful momentum trading is stock selection. Not all assets move with strong momentum. Traders often scan the market for:
Stocks making new 52-week highs
Assets breaking above key resistance levels
Strong volume expansion alongside price movement
Sectors showing relative strength compared to the broader market
Momentum traders often focus on sector leadership. For example, if banking or IT stocks are outperforming the market, chances are that the strongest momentum trades will be found within those sectors.
3. Role of Volume: The Fuel Behind Momentum
Price alone is not enough. Volume is the fuel that confirms momentum. A price breakout with low volume may fail, while a breakout with high volume often signals strong institutional participation.
Key volume-based insights include:
Rising prices + rising volume = healthy momentum
Rising prices + falling volume = weakening momentum
Sudden volume spikes often indicate the start of a new momentum phase
Experienced momentum traders always check volume before entering a trade. This is one of the most overlooked but powerful secrets.
4. Technical Indicators That Reveal Momentum
Momentum trading heavily relies on technical analysis. Some of the most commonly used indicators include:
Relative Strength Index (RSI): Helps identify strong momentum when RSI stays above 60–70 during an uptrend.
Moving Averages: Price staying above short-term and medium-term moving averages indicates strength.
MACD: Confirms momentum shifts and trend continuation.
Rate of Change (ROC): Measures how fast price is moving.
The real secret is not using too many indicators but understanding how price behaves around them. Indicators should support price action, not replace it.
5. Entry Timing: Buying Strength, Not Weakness
A common mistake beginners make is trying to buy at the lowest price. Momentum traders do the opposite: they buy strength. Typical momentum entries occur:
On breakouts above resistance
After short consolidations in an uptrend
On pullbacks to moving averages within a strong trend
Patience is critical. Momentum traders wait for confirmation rather than guessing. Entering too early often leads to false breakouts and losses.
6. Risk Management: Protecting Capital Is the Real Secret
Momentum trading can generate large profits, but it also comes with sharp reversals. This is why risk management is the biggest secret behind long-term success.
Key principles include:
Always using stop-loss orders
Risking only a small percentage of capital per trade
Exiting quickly when momentum fails
Never averaging down on losing momentum trades
Successful traders understand that small losses are part of the game, but big losses are unacceptable.
7. Riding Winners and Letting Profits Run
Momentum traders differ from short-term scalpers because they allow winners to grow. Once momentum is established, the goal is to stay in the trade as long as the trend remains intact.
This often involves:
Trailing stop-losses
Partial profit booking
Holding positions until momentum indicators weaken
One of the biggest secrets is emotional discipline. Many traders exit winning trades too early due to fear, while momentum traders trust their system and let the market reward them.
8. Market Psychology and Crowd Behavior
Momentum trading works because markets are driven by human emotions like fear and greed. When prices rise, fear of missing out (FOMO) pushes more participants to buy. When prices fall, panic accelerates selling.
Understanding crowd psychology helps traders:
Avoid chasing extended moves blindly
Recognize exhaustion points
Stay calm during pullbacks
Momentum traders do not react emotionally; they react systematically.
9. Adapting Momentum Strategies to Market Conditions
Momentum does not work equally well in all market phases. Strong trending markets favor momentum strategies, while sideways or choppy markets reduce their effectiveness.
Smart momentum traders:
Reduce position size during volatile periods
Avoid overtrading in range-bound markets
Focus on fewer, high-quality setups
Adaptability is a hidden secret that separates consistent traders from inconsistent ones.
10. Discipline and Consistency: The Ultimate Momentum Secret
The final and most important secret is discipline. Momentum trading success does not come from one big trade but from repeating the same process over and over.
This includes:
Following predefined rules
Maintaining a trading journal
Reviewing mistakes regularly
Staying patient and focused
Momentum trading rewards those who are consistent, emotionally stable, and process-driven.
Conclusion
Momentum trading is not about predicting the future; it is about aligning with the present strength of the market. By focusing on strong price moves, confirming them with volume, managing risk carefully, and maintaining emotional discipline, traders can unlock the true potential of momentum strategies. The real secrets are not hidden indicators or complex systems, but clarity, patience, and discipline. When applied correctly, momentum trading can become a powerful tool for consistent growth in any market environment.

Small-Cap Trading PotentialsUnlocking High-Growth Opportunities with Calculated Risk
Small-cap trading refers to investing or trading in companies with relatively smaller market capitalization compared to large-cap and mid-cap stocks. In the Indian equity market, small-cap companies typically have a market capitalization below the top 250 listed companies. These stocks often operate in niche segments, emerging industries, or early growth phases, making them attractive for traders and investors seeking higher returns. However, small-cap trading is not just about chasing quick profits—it requires discipline, research, and a clear understanding of risk.
Why Small-Cap Stocks Offer High Potential
The primary appeal of small-cap stocks lies in their growth potential. Unlike large-cap companies that are already well-established and grow steadily, small-cap firms are still expanding their business models, market reach, and revenue streams. Even a moderate improvement in earnings, market share, or management efficiency can lead to sharp price appreciation. This asymmetric return potential—where upside can be significant compared to invested capital—is what attracts traders to small caps.
Small-cap stocks also benefit from lower institutional coverage. Many of these companies are under-researched, which creates pricing inefficiencies. Skilled traders who can identify strong fundamentals early may enter before institutional investors, mutual funds, or foreign investors step in. Once big money flows into a fundamentally strong small-cap stock, price movement can be fast and substantial.
Volatility: A Double-Edged Sword
Volatility is a defining characteristic of small-cap trading. Due to lower liquidity and fewer market participants, small-cap stocks tend to move sharply in both directions. News events, quarterly results, management commentary, or even rumors can cause significant price swings. For traders, this volatility creates opportunity, but it also increases risk.
Sharp corrections are common in small-cap stocks, especially during market-wide risk-off phases. When broader indices fall or global uncertainty rises, small caps are usually the first to face heavy selling. Therefore, traders must respect stop-losses and position sizing. Volatility rewards preparation but punishes emotional decision-making.
Liquidity and Volume Considerations
Liquidity is a critical factor in small-cap trading. Unlike large-cap stocks, where thousands of shares can be traded instantly, small caps may have limited daily volumes. This can result in higher bid-ask spreads and slippage during entry and exit. Traders should always analyze average daily volume before entering a position.
Stocks with improving volume trends are particularly attractive. Rising volume often signals growing interest and accumulation. A price breakout supported by strong volume is generally more reliable than a low-volume move. Liquidity management ensures that profits remain real and executable, not just theoretical.
Fundamental Triggers That Drive Small-Cap Rallies
Small-cap stocks often rally due to specific triggers rather than broad market trends. Earnings growth, debt reduction, capacity expansion, new product launches, regulatory approvals, government contracts, or sectoral tailwinds can act as powerful catalysts. Because the base size of these companies is small, even limited positive developments can significantly impact valuations.
Management quality also plays a crucial role. Transparent communication, ethical governance, and consistent execution build long-term confidence. Traders who track promoter holding patterns, pledging status, and insider activity gain valuable insights into the company’s future direction.
Technical Analysis in Small-Cap Trading
Technical analysis is especially effective in small-cap trading due to strong momentum phases. Breakouts from long consolidation ranges, trendline breakouts, moving average crossovers, and volume expansion are common setups. Many small-cap stocks move in clear impulsive waves, making them suitable for swing and positional trading.
However, false breakouts are also frequent. To avoid traps, traders should wait for confirmation—such as a strong close above resistance or follow-through buying in subsequent sessions. Combining technical patterns with fundamental strength improves the probability of success.
Risk Management: The Core of Sustainable Profits
The biggest mistake traders make in small-cap stocks is overexposure. Because prices are lower, traders often buy larger quantities, underestimating risk. Position sizing should always be based on risk per trade, not on price comfort. A strict stop-loss policy is non-negotiable.
Diversification within small caps is also important. Concentrating capital in one or two stocks increases downside risk. Allocating capital across multiple setups reduces the impact of any single failure. Successful small-cap trading is less about predicting every winner and more about controlling losses when trades go wrong.
Market Cycles and Small-Cap Performance
Small-cap stocks perform best during bullish and risk-on market phases. When liquidity is abundant and investor confidence is high, money flows from large caps to mid and small caps in search of higher returns. This phase often leads to broad-based rallies across the small-cap universe.
During bearish or sideways markets, small caps tend to underperform. In such conditions, only fundamentally strong companies with earnings visibility sustain momentum. Understanding market cycles helps traders decide when to be aggressive and when to be defensive in small-cap trading.
Psychology and Discipline in Small-Cap Trading
Emotional control is essential. Rapid price movements can trigger greed during rallies and fear during corrections. Traders must avoid chasing stocks after extended runs and resist panic selling during temporary pullbacks. A predefined trading plan—covering entry, exit, and risk—keeps emotions in check.
Patience is another key psychological trait. Not every day offers a high-quality small-cap opportunity. Waiting for clear setups and strong confirmations separates professional traders from impulsive participants.
Conclusion: Balancing Opportunity and Risk
Small-cap trading offers immense potential for wealth creation, but it is not suitable for careless or uninformed participants. The combination of high growth potential, volatility, and limited liquidity demands a structured approach. Traders who combine solid fundamental analysis, disciplined technical execution, strict risk management, and emotional control can consistently benefit from small-cap opportunities.
In essence, small-cap trading is about identifying quality early, managing risk intelligently, and allowing growth stories to unfold. When approached with patience and discipline, small-cap stocks can become one of the most rewarding segments of the equity market.

Managing Losses and Drawdowns: The Psychology Behind DrawdownsUnderstanding Losses and Drawdowns
A loss is the negative outcome of an individual trade, while a drawdown refers to the peak-to-trough decline in an account’s equity over a period of time. Drawdowns can be shallow and short-lived or deep and prolonged. Every trading system, no matter how robust, experiences drawdowns due to changing market conditions, randomness, and uncertainty.
The problem is not the drawdown itself but how the trader reacts to it. Poor psychological responses often turn manageable drawdowns into catastrophic losses.
Why Drawdowns Hurt So Much Psychologically
Human psychology is not naturally suited for probabilistic environments like financial markets. Several deep-rooted psychological biases intensify the pain of drawdowns:
Loss Aversion
People feel the pain of losses roughly twice as strongly as the pleasure of gains. A 10% loss emotionally outweighs a 10% gain. During drawdowns, this bias magnifies fear and discomfort, pushing traders to make irrational decisions.
Ego and Identity Attachment
Many traders subconsciously link their self-worth to their trading performance. When losses occur, they don’t just feel financial pain—they feel personal failure. This emotional attachment makes it difficult to accept losses objectively.
Recency Bias
Traders tend to overweight recent outcomes. After a series of losses, the mind starts believing that losses will continue indefinitely, even if the strategy is statistically sound. This leads to abandoning good systems at the worst possible time.
Need for Control
Markets are uncertain, but the human brain craves control. Drawdowns expose the illusion of control, triggering anxiety and impulsive behavior such as overtrading, revenge trading, or excessive position sizing.
Common Psychological Mistakes During Drawdowns
Drawdowns often trigger destructive behaviors that worsen the situation:
Revenge Trading: Trying to recover losses quickly by taking oversized or low-quality trades.
System Hopping: Abandoning a strategy mid-drawdown and jumping to another, often just before the original strategy recovers.
Freezing: Becoming so afraid of further losses that the trader stops executing valid setups.
Risk Escalation: Increasing risk per trade to “get back to breakeven,” which usually deepens the drawdown.
These behaviors stem from emotional reactions rather than rational analysis.
Reframing Drawdowns as a Normal Cost
One of the most powerful psychological shifts is reframing drawdowns as a business expense rather than a failure. Just as a business has operating costs, trading has unavoidable drawdowns. The goal is not to eliminate drawdowns but to keep them within acceptable limits.
Professional traders expect drawdowns. They plan for them, measure them, and structure their risk management around them. When a drawdown occurs, it is seen as confirmation that the system is operating within normal statistical boundaries—not as a sign that something is broken.
Risk Management as Psychological Protection
Effective risk management is not just a mathematical tool; it is psychological armor.
Fixed Risk Per Trade: Limiting risk to a small percentage (e.g., 0.5–2%) ensures that no single trade can cause emotional or financial devastation.
Maximum Drawdown Limits: Predefining a maximum acceptable drawdown (for example, 10–15%) creates a safety net and reduces panic.
Position Sizing Discipline: Smaller position sizes reduce emotional pressure, making it easier to follow the plan consistently.
When risk is controlled, the mind remains clearer during losing streaks.
Building Psychological Resilience
Managing drawdowns requires emotional resilience, which can be developed over time:
Process Over Outcome Focus
Judge success by how well you followed your trading plan, not by short-term profits or losses. A well-executed losing trade is still a successful action.
Statistical Confidence
Deep understanding of your strategy’s historical performance—win rate, expectancy, and worst-case drawdowns—builds confidence during difficult periods. When you know what is “normal,” fear loses its power.
Journaling and Self-Awareness
Maintaining a trading journal that records not just trades but emotions helps identify psychological patterns. Awareness is the first step to control.
Emotional Detachment
Viewing trades as independent events rather than personal judgments reduces emotional volatility. You are not your P&L.
The Role of Patience and Time
Drawdowns often resolve not through action but through patience. Many traders fail because they cannot tolerate discomfort long enough for probabilities to play out. Markets reward discipline over time, not emotional reactions in the short term.
Understanding that recovery from a drawdown mathematically requires time and consistency helps align expectations with reality. A calm, patient trader is statistically advantaged over an emotionally reactive one.
Learning from Drawdowns Without Overreacting
Not all drawdowns are meaningless. Some indicate genuine issues such as changing market regimes or flawed execution. The key is objective analysis, not emotional reaction. Traders should review drawdowns calmly, asking:
Did I follow my rules?
Has market structure changed?
Is this within historical norms?
If the drawdown is normal, continue. If something is structurally wrong, make measured adjustments—never impulsive ones.
Conclusion
Managing losses and drawdowns is primarily a psychological challenge, not a technical one. Drawdowns test discipline, patience, confidence, and emotional control. They expose weaknesses in mindset more than flaws in strategy. Traders who survive and thrive are those who accept drawdowns as inevitable, manage risk intelligently, and maintain emotional stability during periods of stress.
Ultimately, success in trading is not about avoiding losses—it is about learning how to lose well. Those who master the psychology behind drawdowns transform adversity into endurance, and endurance into long-term profitability.

Best Knowledge of Candle Patterns CANDLESTICK PATTERNS
Candlestick patterns show price action for a specific time period using:
open
high
low
close
They reveal emotions on a smaller scale than chart patterns—short-term sentiment, reversals, or continuation signals.
Candles combine psychology with real-time supply-demand shifts.

Protecting Capital and Enhancing Long-Term SuccessSmart Loss Management
Smart loss management is one of the most critical yet often overlooked pillars of successful trading and investing. While most participants focus heavily on profits, strategies, and market timing, it is loss management that ultimately determines survival and consistency in financial markets. Markets are uncertain by nature, and losses are inevitable. The difference between successful and unsuccessful traders lies not in avoiding losses altogether, but in managing them intelligently. This guide explores the principles, techniques, psychology, and practical frameworks of smart loss management in detail.
Understanding the Importance of Loss Management
Loss management is the disciplined approach of limiting downside risk while allowing upside potential to grow. Capital preservation is the first rule of trading; without capital, opportunities become irrelevant. Even highly accurate strategies can fail if losses are allowed to grow unchecked. A single large loss can erase months or years of disciplined gains, whereas small, controlled losses keep a trader emotionally stable and financially solvent.
Smart loss management shifts the mindset from “how much can I make?” to “how much can I afford to lose?” This perspective creates consistency and resilience in volatile market environments.
Risk Per Trade: The Foundation of Smart Loss Control
One of the core principles of smart loss management is defining risk per trade. Professional traders typically risk only 1% to 2% of their total capital on any single trade. This approach ensures that even a series of consecutive losses does not significantly damage the trading account.
For example, if a trader has ₹10,00,000 in capital and risks 1% per trade, the maximum loss per trade is ₹10,000. Even ten losing trades in a row would result in only a 10% drawdown, which is psychologically and financially manageable. This disciplined approach protects traders from emotional decision-making and revenge trading.
Stop-Loss Strategy: Your First Line of Defense
A stop-loss is a predefined exit point where a losing position is automatically closed. It is not a sign of failure but a tool of professionalism. Smart loss management requires stop-loss placement based on logic, not emotions.
Stop-losses should be:
Technically valid (below support, above resistance, or beyond key indicators)
Volatility-adjusted (considering market noise and ATR levels)
Predefined before entry, not adjusted impulsively during a trade
Moving a stop-loss further away to “avoid loss” often leads to larger damage. Smart traders accept small losses quickly and move on to the next opportunity.
Position Sizing: Controlling Loss Before It Happens
Position sizing is a powerful but underused loss management tool. It determines how many units, shares, or lots to trade based on risk tolerance and stop-loss distance.
For instance, if a trader is willing to risk ₹5,000 on a trade and the stop-loss is ₹50 away from entry, the position size should be 100 units. This ensures that the loss remains fixed regardless of market volatility.
Smart position sizing aligns every trade with the trader’s risk rules, making loss management automatic rather than reactive.
Risk-to-Reward Ratio: Let Winners Pay for Losers
A smart loss management system works best when combined with favorable risk-to-reward ratios. A minimum ratio of 1:2 or 1:3 ensures that even if a trader is right only 40% of the time, they can still remain profitable.
For example:
Risk: ₹1
Reward: ₹3
Even with 4 losses and 2 wins, the net result remains positive
This approach reduces the emotional burden of losses and allows traders to stay confident even during drawdown phases.
Drawdown Control and Maximum Loss Limits
Smart loss management includes setting daily, weekly, or monthly loss limits. These limits act as circuit breakers to prevent emotional overtrading.
Examples:
Daily loss limit: Stop trading if losses exceed 2% in a day
Weekly loss limit: Pause trading after 5% drawdown
Maximum drawdown rule: Reduce position size after a defined loss threshold
These limits protect traders from emotional spirals and allow time for strategy review and mental reset.
Psychological Discipline in Loss Management
Losses trigger fear, frustration, and self-doubt. Without psychological control, even the best loss management rules fail. Smart loss management requires emotional acceptance of losses as part of the process.
Key psychological practices include:
Viewing losses as business expenses
Avoiding revenge trading after losses
Maintaining a trading journal to analyze mistakes objectively
Focusing on execution quality, not short-term outcomes
Emotionally mature traders respect losses and recover faster than those who fight the market.
Adapting Loss Management to Market Conditions
Markets go through different phases: trending, ranging, volatile, or uncertain. Smart loss management adapts accordingly.
In high volatility, widen stop-losses and reduce position size
In low volatility, tighten stops and maintain standard sizing
During news-driven markets, reduce exposure or avoid trading
Rigid loss rules without market context can be as harmful as no rules at all. Flexibility within discipline is the hallmark of smart traders.
Review, Learn, and Improve
Smart loss management is an evolving process. Regular review of losing trades helps identify:
Strategy flaws
Emotional mistakes
Poor timing or market selection
By analyzing losses, traders convert setbacks into learning opportunities. Over time, this feedback loop strengthens discipline and improves overall performance.
Conclusion: Loss Management Is the Real Edge
Smart loss management is not about avoiding losses—it is about controlling them intelligently. In trading and investing, profits take care of themselves when losses are managed well. Capital protection, disciplined risk control, emotional stability, and adaptability form the backbone of long-term success.
Traders who master loss management gain a powerful edge: the ability to stay in the game long enough for probabilities to work in their favor. In the end, it is not the biggest winner who survives the market, but the one who loses smartly and consistently.

Transforming the World Through Innovation and IntelligenceThe Tech Digital Revolution
The tech digital revolution is one of the most powerful and far-reaching transformations in human history. It represents the rapid integration of digital technologies into every aspect of life, business, governance, and society. Unlike earlier industrial revolutions that were driven by steam power, electricity, or mechanization, the digital revolution is fueled by data, connectivity, software, and intelligent systems. Its impact is not limited to a single sector; instead, it reshapes how people communicate, work, trade, learn, and even think.
At its core, the digital revolution is about converting physical processes into digital ones, enabling speed, accuracy, scalability, and global reach. Technologies such as the internet, cloud computing, artificial intelligence (AI), big data analytics, blockchain, the Internet of Things (IoT), and automation are the key drivers of this change. Together, they form a digital ecosystem that continuously evolves, creating new opportunities while disrupting traditional models.
The Foundation of the Digital Revolution
The journey of the digital revolution began with the invention of computers and the development of the internet. Early computers automated calculations, but the real breakthrough came when computers became interconnected. The internet transformed isolated systems into a global network, allowing instant communication and information exchange across borders. Over time, this connectivity expanded with mobile devices, smartphones, and high-speed networks, bringing digital access to billions of people worldwide.
Cloud computing further accelerated the revolution by removing the need for physical infrastructure. Businesses and individuals could now store data, run applications, and scale operations without heavy upfront investment. This democratization of technology empowered startups, encouraged innovation, and lowered entry barriers across industries.
Artificial Intelligence and Data as the New Fuel
Data is often called the “new oil” of the digital age, and artificial intelligence is the engine that extracts its value. Every digital interaction—online searches, social media activity, financial transactions, sensor readings—creates data. AI systems analyze this massive volume of information to identify patterns, predict outcomes, and automate decisions.
Machine learning, natural language processing, and computer vision are transforming industries such as healthcare, finance, retail, and manufacturing. AI-driven diagnostics improve medical accuracy, algorithmic trading reshapes financial markets, personalized recommendations enhance customer experience, and smart factories optimize production. As AI becomes more advanced, it shifts technology from being a support tool to a decision-making partner.
Impact on Business and the Global Economy
The digital revolution has fundamentally changed how businesses operate and compete. Traditional brick-and-mortar models are increasingly replaced or complemented by digital platforms. E-commerce, digital payments, online services, and remote work have become mainstream. Companies that adapt quickly gain a competitive edge, while those that resist digital transformation risk becoming obsolete.
Digital platforms create network effects, where value increases as more users participate. Tech giants leverage data, scale, and innovation to dominate global markets, while smaller businesses use digital tools to reach international customers. Automation and robotics improve efficiency but also raise concerns about job displacement, requiring workforce reskilling and policy adaptation.
On a global scale, the digital economy contributes significantly to GDP growth. Emerging markets benefit from leapfrogging traditional infrastructure, using mobile technology and digital finance to drive inclusion. At the same time, digital inequality remains a challenge, as access to technology and digital literacy is uneven across regions and populations.
Transformation of Society and Daily Life
Beyond economics, the digital revolution has reshaped everyday life. Communication has shifted from letters and phone calls to instant messaging, video conferencing, and social media. Information is accessible in seconds, changing how people learn, form opinions, and interact with the world.
Education has been transformed through online learning platforms, virtual classrooms, and digital resources. Healthcare is becoming more patient-centric with telemedicine, wearable devices, and electronic health records. Entertainment has moved to streaming platforms, gaming ecosystems, and immersive virtual experiences.
However, this transformation also brings challenges. Issues such as data privacy, cybersecurity, misinformation, digital addiction, and mental health concerns have become prominent. Balancing innovation with ethical responsibility is one of the defining challenges of the digital age.
Governance, Security, and Digital Trust
Governments are increasingly adopting digital technologies to improve efficiency, transparency, and citizen engagement. E-governance platforms streamline public services, digital identities enhance access, and data-driven policymaking improves decision quality. At the same time, digital systems introduce new vulnerabilities.
Cybersecurity has become a critical national and corporate priority. As more infrastructure goes online, the risk of cyberattacks, data breaches, and digital warfare increases. Building digital trust—through strong regulations, ethical AI frameworks, and secure systems—is essential for sustainable progress.
The Future of the Digital Revolution
The tech digital revolution is not a completed event; it is an ongoing process. Emerging technologies such as quantum computing, extended reality (AR/VR), advanced robotics, and next-generation networks promise to push boundaries even further. The future will likely see deeper integration between humans and technology, with intelligent systems augmenting human capabilities rather than simply replacing them.
Success in this future depends on adaptability, continuous learning, and responsible innovation. Societies that invest in digital skills, inclusive access, and ethical governance will be better positioned to harness the benefits of technological change. Those that fail to adapt may face economic and social disruption.
Conclusion
The tech digital revolution is redefining the modern world. It is transforming industries, economies, and societies at an unprecedented pace. While it brings immense opportunities for growth, efficiency, and innovation, it also raises complex challenges related to equity, security, and ethics. Understanding and embracing this revolution is no longer optional—it is essential for individuals, businesses, and nations alike. Those who learn to navigate the digital landscape with vision and responsibility will shape the future of the global economy and human progress.

Leveraged and Margin Trading: Opportunities and RisksUnderstanding Margin Trading
Margin trading refers to the practice of borrowing funds from a broker to trade financial assets. The trader contributes a portion of the total trade value, known as the initial margin, while the broker finances the remaining amount. The borrowed funds are secured against the trader’s existing capital or securities, which act as collateral.
For example, if a broker requires a 20% margin, a trader can control a ₹10,00,000 position by investing only ₹2,00,000 of their own money. The remaining ₹8,00,000 is borrowed. This structure allows traders to increase market exposure without committing the full capital upfront.
However, margin trading comes with obligations. Brokers impose a maintenance margin, which is the minimum equity that must be maintained in the account. If losses reduce the account balance below this level, the broker issues a margin call, requiring the trader to add funds or close positions. Failure to do so may result in forced liquidation.
What Is Leverage?
Leverage is the ratio that defines how much exposure a trader gets relative to their invested capital. Common leverage ratios include 2:1, 5:1, 10:1, or even 100:1 in certain markets like forex or crypto. A 10:1 leverage means that for every ₹1 invested, the trader controls ₹10 worth of assets.
Leverage itself is not a separate instrument; it is a feature embedded within margin trading, futures, options, CFDs, and other derivatives. It acts as a multiplier—both for profits and losses. A 5% favorable move in a highly leveraged position can double capital, but a 5% adverse move can wipe it out entirely.
Applications Across Different Markets
Equity Markets
In stock markets, margin trading allows investors to buy shares by paying only a portion of their value. Regulators often cap leverage in equities to protect retail participants. In India, for example, margin requirements are strictly regulated by SEBI to control excessive speculation.
Derivatives (Futures and Options)
Futures contracts are inherently leveraged instruments. Traders pay a small margin to control a large notional value. Options trading also involves leverage, particularly for option buyers who pay a limited premium for potentially large gains.
Forex Markets
Forex trading is one of the most leveraged markets globally. Traders often use leverage ratios such as 50:1 or 100:1. While this enables participation with small capital, it also makes forex trading extremely risky without strict risk controls.
Cryptocurrency Markets
Crypto exchanges offer very high leverage, sometimes exceeding 100x. Due to extreme volatility, leveraged crypto trading can result in rapid liquidations, making it suitable only for experienced traders.
Advantages of Leveraged and Margin Trading
Capital Efficiency: Traders can deploy capital across multiple opportunities instead of locking it into a single trade.
Enhanced Returns: Even small price movements can generate significant profits when leverage is used correctly.
Short Selling: Margin accounts allow traders to sell assets they do not own, enabling profit from falling markets.
Hedging Opportunities: Leverage can be used to hedge portfolios efficiently with smaller capital outlay.
Risks and Challenges
Despite its advantages, leveraged trading carries substantial risks:
Magnified Losses: Losses increase at the same rate as gains. A small unfavorable move can cause large drawdowns.
Margin Calls and Forced Liquidation: Sudden market volatility can trigger margin calls, forcing traders to exit positions at unfavorable prices.
Emotional Pressure: Leverage intensifies psychological stress, often leading to impulsive decisions.
Interest and Fees: Borrowed funds incur interest costs, which can erode profits over time.
Risk Management in Leveraged Trading
Successful leveraged trading is not about maximizing leverage but managing it wisely. Professional traders follow strict risk management rules:
Position Sizing: Limiting the percentage of capital risked on each trade.
Stop-Loss Orders: Automatically exiting losing positions before losses escalate.
Moderate Leverage: Using lower leverage even when higher leverage is available.
Diversification: Avoiding concentration in a single asset or trade.
Understanding Volatility: Adjusting leverage according to market conditions.
Regulatory Perspective
Regulators worldwide closely monitor margin and leverage usage to maintain market stability. Restrictions on leverage, mandatory margin requirements, and risk disclosures are designed to protect retail traders from catastrophic losses. Traders must be aware of the rules governing their specific market and broker.
Who Should Use Leveraged and Margin Trading?
Leveraged trading is best suited for experienced traders who:
Have a deep understanding of market mechanics
Can manage risk objectively
Maintain emotional discipline
Use well-defined trading strategies
For beginners, leverage should be approached cautiously, starting with minimal exposure until sufficient experience is gained.
Conclusion
Leveraged and margin trading are double-edged swords in the financial markets. They offer the potential for amplified profits, efficient capital use, and advanced trading strategies, but they also expose traders to significant risks and rapid losses. The difference between success and failure lies not in the availability of leverage, but in how responsibly it is used.
A disciplined approach—combining market knowledge, prudent leverage, and strong risk management—can transform leveraged trading from a speculative gamble into a professional trading tool. Ultimately, leverage should serve the trader’s strategy, not control it.

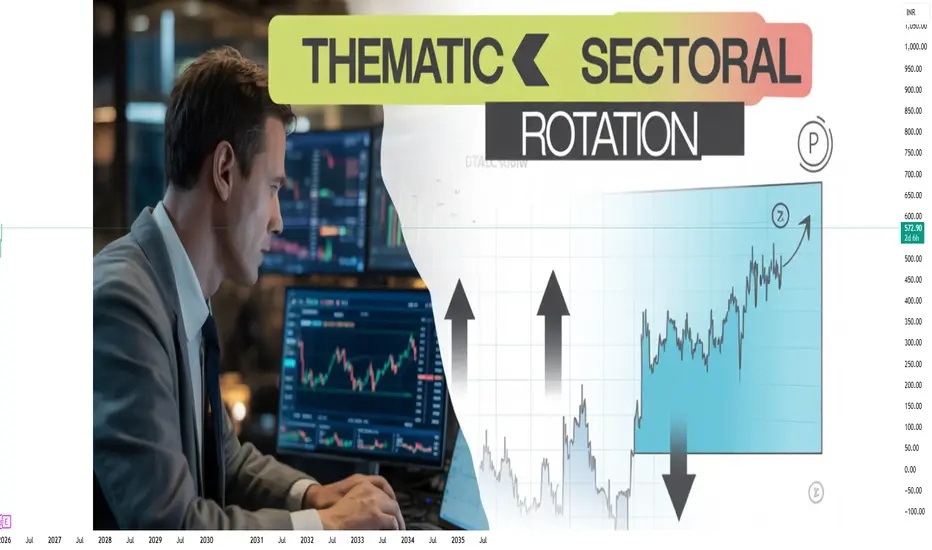
Thematic and Sectoral Rotation TradingRiding Market Cycles with Strategic Precision
The financial markets do not move in a straight line. They evolve through cycles driven by economic growth, interest rates, inflation, government policies, technological innovation, and investor psychology. Within these cycles, leadership constantly shifts from one sector to another and from one powerful theme to the next. Thematic and sectoral rotation trading is a strategy that seeks to identify these shifts early and allocate capital to the areas of the market most likely to outperform at a given phase of the cycle. Instead of focusing on individual stock stories alone, this approach looks at the bigger picture, aligning trades with macroeconomic trends and structural changes in the economy.
Understanding Sectoral Rotation Trading
Sectoral rotation trading is based on the idea that different sectors perform better at different stages of the economic cycle. The economy typically moves through phases such as recovery, expansion, peak, slowdown, and recession. Each phase creates a favorable environment for specific industries.
For example, during an economic recovery, sectors like banking, real estate, automobiles, and capital goods often lead because credit growth picks up and consumer demand improves. In the expansion phase, IT services, consumer discretionary, and industrials may outperform as corporate profits grow. During periods of high inflation or uncertainty, defensive sectors such as FMCG, pharmaceuticals, and utilities tend to attract investor interest because of stable earnings. Sectoral rotation traders study these patterns and shift capital accordingly, aiming to stay invested in market leaders rather than laggards.
This approach reduces the risk of being stuck in underperforming sectors during unfavorable cycles. Instead of predicting which single stock will do well, traders focus on which sector has the wind at its back.
What is Thematic Trading?
Thematic trading goes a step beyond sectoral rotation. While sectors are broad classifications like banking, IT, or energy, themes are cross-sectoral narratives driven by long-term structural changes. A single theme can impact multiple industries simultaneously.
Examples of themes include digital transformation, renewable energy, electric vehicles, infrastructure development, defense manufacturing, China-plus-one supply chain shift, financial inclusion, and consumption growth in emerging markets. These themes often play out over several years rather than months. Thematic traders aim to identify these powerful narratives early and invest in companies that are direct or indirect beneficiaries.
Unlike sectoral rotation, which is more closely linked to economic cycles, thematic trading is driven by structural shifts that may continue even during economic slowdowns. For instance, digitization and automation can continue regardless of short-term GDP fluctuations.
The Role of Macroeconomics and Policy
Both thematic and sectoral rotation trading rely heavily on macroeconomic analysis. Interest rates, inflation, fiscal spending, monetary policy, and global economic trends act as triggers for rotation. In the Indian market, government policies play a particularly important role. Budget allocations, production-linked incentive (PLI) schemes, infrastructure spending, and reforms in banking or energy can create strong sectoral and thematic tailwinds.
For example, a rising interest rate environment may hurt rate-sensitive sectors like real estate but benefit banks through improved net interest margins. Similarly, a government push toward renewable energy can create a multi-year theme benefiting solar, wind, power equipment, and green financing companies. Traders who understand these macro-policy linkages gain a significant edge.
Time Horizon and Trading Style
Sectoral rotation trading is usually medium-term in nature, ranging from a few weeks to several months. Traders actively rebalance portfolios as leadership changes. Thematic trading, on the other hand, often suits positional or long-term investors who are willing to stay invested for years while tolerating short-term volatility.
However, both strategies can be adapted for trading if supported by technical analysis. Many traders combine top-down analysis (macro and sector/theme identification) with bottom-up analysis (stock selection and technical timing). This hybrid approach helps in entering themes and sectors at optimal points rather than chasing momentum blindly.
Tools Used in Rotation Trading
Successful thematic and sectoral rotation traders use a combination of tools:
Relative strength analysis to compare sector performance against benchmark indices
Sector indices and ETFs to track broad sector movements
Economic indicators such as PMI, inflation data, interest rates, and GDP growth
Technical indicators like moving averages, trendlines, and momentum oscillators
Earnings trends and valuations to avoid overpaying for popular themes
Relative strength is especially critical. A sector may be fundamentally strong, but if it is underperforming the broader market, capital is likely flowing elsewhere. Rotation trading is ultimately about capital flow analysis.
Advantages of Thematic and Sectoral Rotation Trading
One of the biggest advantages of this approach is alignment with market leadership. Markets reward sectors and themes where institutional money flows. By positioning in these areas, traders increase the probability of outperforming the benchmark.
Another advantage is diversification with direction. Instead of spreading capital randomly across stocks, traders diversify across high-conviction sectors or themes, reducing unsystematic risk while maintaining focus. This strategy also helps traders avoid emotional attachment to stocks and encourages a dynamic, adaptive mindset.
Risks and Challenges
Despite its advantages, thematic and sectoral rotation trading is not without risks. Themes can become overcrowded, leading to sharp corrections once expectations peak. Sectoral leadership can also change abruptly due to unexpected macro events such as geopolitical tensions, policy reversals, or global financial shocks.
Timing is another major challenge. Entering a theme too early can lead to long periods of underperformance, while entering too late can expose traders to sharp drawdowns. This is why discipline, risk management, and continuous review are essential.
The Indian Market Perspective
In India, thematic and sectoral rotation trading has gained popularity due to strong retail participation and clear policy-driven narratives. Sectors like PSU banks, infrastructure, defense, renewables, and manufacturing have shown how powerful rotations can be when aligned with economic and political trends. Indian markets are particularly sensitive to liquidity conditions and foreign institutional investor flows, making rotation strategies highly relevant.
Conclusion
Thematic and sectoral rotation trading is a sophisticated yet practical approach that bridges macroeconomic understanding with market execution. It encourages traders and investors to think beyond individual stocks and focus on where growth, capital, and narratives are converging. When executed with proper research, timing, and risk management, this strategy can help market participants stay ahead of cycles, capture leadership trends, and build sustainable performance over time. In a world of ever-changing markets, the ability to rotate intelligently is not just a skill—it is a necessity.
Trading with AssetsBuilding Wealth Through Smart Market Participation
Trading with assets is one of the most powerful ways individuals, institutions, and nations participate in the global financial system. At its core, asset trading involves buying and selling financial instruments with the objective of generating profits, preserving capital, or achieving strategic financial goals. Assets can range from traditional instruments such as stocks, bonds, commodities, and currencies to modern alternatives like cryptocurrencies, real estate investment trusts (REITs), and derivatives. Understanding how to trade these assets effectively requires knowledge, discipline, risk management, and a clear strategy.
Understanding What Assets Are
An asset is anything that holds economic value and can generate future benefits. In trading, assets are categorized into various classes, each with unique characteristics, risk profiles, and return potentials. Equity assets represent ownership in companies, debt assets like bonds represent loans to governments or corporations, commodities represent physical goods such as gold or oil, while currencies reflect the relative value of one economy against another. Modern financial markets have expanded asset definitions to include digital assets, carbon credits, and structured products.
Trading with assets allows market participants to allocate capital where they expect the best risk-adjusted returns. Unlike simple saving, asset trading actively puts money to work by taking advantage of price movements, economic cycles, and market inefficiencies.
Why Asset Trading Matters
Asset trading plays a crucial role in the economy. It provides liquidity to markets, helps in price discovery, and enables businesses and governments to raise capital. For traders and investors, it offers opportunities to grow wealth, hedge risks, and diversify income sources. In inflationary environments, certain assets like commodities or equities may outperform cash, making trading an essential tool for protecting purchasing power.
For individuals, asset trading can be a pathway to financial independence when approached responsibly. However, without proper understanding, it can also lead to significant losses. Hence, education and planning are vital.
Types of Asset Trading
Asset trading can broadly be divided into several approaches:
Equity Trading: Buying and selling shares of companies to profit from price appreciation or dividends. Traders may focus on blue-chip stocks, growth stocks, or sector-specific opportunities.
Fixed Income Trading: Trading bonds based on interest rate movements, credit quality, and macroeconomic factors.
Commodity Trading: Involves physical or derivative-based trading of resources like metals, energy, and agricultural products, often influenced by global supply-demand dynamics.
Forex Trading: Trading currency pairs based on economic data, central bank policies, and geopolitical developments.
Derivative Trading: Using futures, options, and swaps to speculate or hedge against price movements in underlying assets.
Alternative Asset Trading: Includes real estate, private equity, hedge funds, and digital assets such as cryptocurrencies and NFTs.
Each asset class responds differently to economic conditions, which is why diversification across assets is a cornerstone of successful trading.
Strategies for Trading with Assets
Successful asset trading is strategy-driven, not emotion-driven. Traders typically choose strategies based on time horizon, risk appetite, and market knowledge.
Short-term Trading: Includes intraday and swing trading, focusing on technical analysis, chart patterns, and momentum.
Long-term Trading or Investing: Focuses on fundamentals such as earnings growth, economic trends, and valuation metrics.
Trend Following: Traders identify and ride established market trends across asset classes.
Value-Based Trading: Buying undervalued assets and waiting for the market to recognize their true worth.
Hedging Strategies: Using derivatives or negatively correlated assets to protect portfolios from adverse market movements.
A clear strategy helps traders remain consistent and avoid impulsive decisions.
Risk Management in Asset Trading
Risk management is the backbone of asset trading. No strategy can succeed without controlling downside risk. Key risk management principles include position sizing, stop-loss placement, diversification, and maintaining proper risk-reward ratios. Traders must accept that losses are part of the process and focus on long-term consistency rather than short-term gains.
Overleveraging, lack of discipline, and emotional trading are common reasons traders fail. Successful traders prioritize capital preservation first and profits second.
Role of Technology and Data
Modern asset trading is heavily influenced by technology. Trading platforms, real-time data, algorithmic trading, and artificial intelligence have transformed how assets are traded. Retail traders now have access to tools that were once exclusive to institutions, such as advanced charting, economic calendars, and automated strategies.
However, technology is a tool, not a substitute for judgment. Understanding market behavior and economic context remains essential.
Psychology of Asset Trading
The psychological aspect of trading is often underestimated. Fear, greed, overconfidence, and regret can severely impact decision-making. Successful asset traders develop emotional control, patience, and the ability to follow their plan even during volatile market conditions. Journaling trades, reviewing performance, and continuous learning help in improving psychological discipline.
Asset Trading in a Global Context
Globalization has interconnected asset markets like never before. Events in one part of the world can instantly impact assets elsewhere. Interest rate decisions by central banks, geopolitical tensions, trade policies, and technological breakthroughs influence asset prices across borders. Traders who understand these interconnections gain a strategic advantage.
Conclusion
Trading with assets is both an opportunity and a responsibility. It offers immense potential for wealth creation, risk management, and financial growth, but it demands knowledge, discipline, and patience. By understanding different asset classes, applying well-defined strategies, managing risk effectively, and maintaining emotional control, traders can navigate complex markets successfully. Asset trading is not about chasing quick profits—it is about building a sustainable approach to participate intelligently in the ever-evolving financial markets.
Divergence Secrets Long Put Strategy (Bearish)
Concept: Buy a put option expecting the price to fall.
Maximum Loss: Premium paid
Maximum Profit: Large (limited by zero price)
Best Market Condition: Strong downtrend
Use Case:
Used during market crashes, breakdowns, or negative news events.

Part 12 Trading Master Class Call Option Explained
A Call Option gives the buyer the right to buy the underlying asset at a fixed price (strike price) before or on expiry.
Example:
If NIFTY is trading at 22,000 and you buy a 22,200 Call Option, you expect the market to move up.
If NIFTY goes to 22,400 → You profit
If NIFTY stays below 22,200 → Option may expire worthless
Maximum loss = Premium paid
Profit potential = Unlimited
Call options are generally used when traders are bullish on the market.

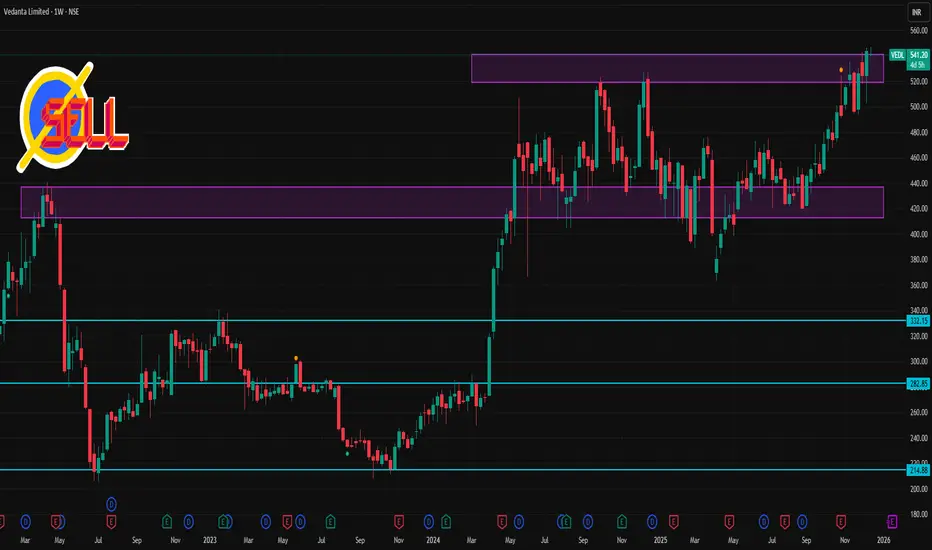
VEDL 1 Week Time Frame📍 Live price context
Vedanta is trading around ₹540 + on NSE.
📊 Weekly (1‑Week Timeframe) Key Levels
🧱 Resistance Levels (Upside)
These are levels where price may face selling pressure / struggle to break above:
R1: ~₹548 – ₹553 — short‑term technical resistance zone.
R2: ~₹555 – ₹560 — broader upside/wider resistance (weekly chart often reflects overhead supply near recent highs).
R3: ~₹565 + — psychological/upper projection zone if momentum continues.
📉 Support Levels (Downside)
Key floors where price may find buying interest / bounce:
S1: ~₹536 – ₹538 — immediate weekly support near pivot area.
S2: ~₹530 – ₹532 — next support cluster on weekly pivot levels.
S3: ~₹525 – ₹526 — deeper weekly support if price corrects further.
Big Accounts, Big Gains: How Capital Size Shapes Trading SuccessThe Power of Capital in Trading
A large trading account provides flexibility. With higher capital, traders can diversify across multiple assets, sectors, and strategies simultaneously. Instead of relying on a single stock or trade idea, a big account holder can spread risk over equities, derivatives, commodities, currencies, and even alternative assets like crypto. This diversification reduces the impact of any one losing trade and helps smooth overall returns.
Capital also allows traders to take advantage of opportunities that require scale. For example, certain options strategies—such as iron condors, calendar spreads, or volatility-based trades—are more effective when executed with size. Similarly, institutional-style trades like arbitrage, block trades, or statistical strategies often require substantial capital to be meaningful after transaction costs.
Compounding Works Faster with Big Accounts
One of the greatest advantages of a large account is the power of compounding. While percentage returns may look similar across account sizes, the absolute gains differ dramatically. A 10% return on a ₹1 crore account is far more impactful than the same return on a ₹1 lakh account. This allows big account traders to grow wealth faster without necessarily taking on higher risk.
Importantly, large accounts do not need to chase aggressive returns. Even modest, consistent performance can lead to significant wealth creation. This reduces emotional stress and discourages overtrading, which is one of the most common reasons smaller accounts fail.
Better Risk Management and Position Sizing
Risk management becomes more effective with scale. Big accounts can risk smaller percentages per trade while still achieving meaningful profits. For instance, risking 0.5% or 1% per trade in a large account can generate solid absolute returns while keeping drawdowns under control.
Large accounts also allow for more precise position sizing. Traders can scale in and out of positions gradually, reducing slippage and emotional pressure. Instead of going “all in” on a single idea, capital can be allocated strategically across time and price levels.
Access to Premium Opportunities
Big accounts often gain access to tools and opportunities unavailable to smaller traders. These include lower brokerage fees, tighter spreads, priority execution, advanced trading platforms, professional data feeds, and research services. Some investment opportunities—such as private placements, pre-IPO deals, structured products, or hedge fund strategies—require high minimum capital thresholds.
In derivatives markets, margin efficiency also improves with size. Portfolio margining, cross-margin benefits, and better leverage terms can significantly enhance capital efficiency for large accounts when used responsibly.
Psychological Edge of a Large Account
Psychology plays a crucial role in trading success. Traders with small accounts often feel pressured to “grow fast,” leading to overleveraging and emotional decisions. Big account traders, on the other hand, can afford patience. They do not need to trade every day or chase every market move.
This psychological comfort allows better decision-making. Trades are taken based on logic and probability rather than desperation. Losses, when they occur, are viewed as part of the process rather than personal failures, making them easier to manage emotionally.
The Hidden Challenges of Big Accounts
Despite their advantages, big accounts come with unique challenges. Liquidity becomes a concern when position sizes grow large. Entering or exiting trades can move prices, especially in mid-cap or low-liquidity stocks. Slippage and market impact can reduce profitability if not managed carefully.
Large accounts also demand discipline. A single careless decision can result in substantial losses in absolute terms. Ego can become a problem—traders may feel invincible due to past success or capital size, leading to complacency and rule-breaking.
Additionally, scaling a strategy that works for small capital does not always work for large capital. What works with ₹5 lakh may not work with ₹5 crore. Strategies must evolve, often becoming more systematic, diversified, and risk-focused as capital grows.
Big Accounts vs Smart Accounts
It is important to note that big gains do not come from big accounts alone—they come from smart management of big accounts. Capital amplifies both skill and mistakes. A disciplined trader with a solid strategy can use a large account to build sustainable wealth. An undisciplined trader, however, can lose large sums just as quickly.
This is why many successful traders focus on process rather than profits. They emphasize risk control, consistency, and long-term thinking. Big accounts reward patience, planning, and professionalism more than aggression.
The Path from Small to Big
Most big accounts start small. They grow through years of learning, disciplined execution, and reinvestment of profits. Traders who survive early losses, respect risk, and focus on skill development eventually reach a stage where capital works for them rather than against them.
The key lesson is not to rush. Chasing “big gains” with a small account often leads to failure. Building a foundation of discipline and consistency prepares a trader to handle larger capital responsibly when the time comes.
Conclusion
“Big accounts, big gains” is a powerful idea, but it is only half the story. Large capital provides advantages—diversification, compounding, risk efficiency, and access—but it also demands maturity, discipline, and respect for risk. In trading, money is a tool, not a shortcut. When combined with skill, patience, and a professional mindset, big accounts can indeed lead to big gains—not through reckless bets, but through smart, consistent, and well-managed trading decisions.

Options Buying vs Options Selling – Pros & Cons1. Options Buying – Overview
Options buyers purchase Call or Put options by paying a premium. They have limited risk (up to the premium paid) and unlimited or large potential reward.
A call buyer expects price to go up, and a put buyer expects price to go down.
Key Idea:
You are paying premium for the right to buy or sell an asset, not the obligation.
Pros of Options Buying
1. Limited Risk – Maximum Loss = Paid Premium
The biggest advantage is that risk is predefined.
Even if the market goes completely against you, the most you lose is the premium.
This makes option buying beginner-friendly from a risk-management perspective.
2. Unlimited or Large Profit Potential
Call buyers earn huge when the market rallies.
Put buyers make large profits when the market crashes.
Since options expand rapidly during trending moves, buyers can earn multiples (2x, 5x, even 10x) during strong breakouts or breakdowns.
3. Small Capital Requirement
A few hundred or a few thousand rupees can control a position of lakhs due to leverage.
This makes options buying attractive for small retail traders.
4. Ideal for News, Events & High Momentum
Buyers benefit the most during:
Budget sessions
Election results
RBI policy
Company results
Sudden large breakouts/breakdowns
Volatility increases premiums, which favors buyers in fast-moving markets.
Cons of Options Buying
1. Low Probability of Profit (Because of Time Decay)
Option premiums naturally decrease due to Theta decay.
You need the market to move:
Fast
Far
In your direction
Otherwise, premium collapses. Many buyers lose because the market only moves slightly, not enough to overcome time decay.
2. You Fight Against the Odds
Options are priced based on implied volatility, demand, and probability.
Sellers have statistical advantage because:
70% of options expire worthless
Time decay always works against buyers
Thus buyers have low chances of success unless they are skilled.
3. Volatility Crush
After major events, volatility drops sharply, reducing premium even if price moves in your direction.
Example:
After results or big news, IV crash eats away the premium.
4. Emotional Stress
Fast-moving premiums lead to:
Panic entries
Emotional exits
Overtrading
Fear of missing out
Options buying requires strong discipline and strict stop-losses.
2. Options Selling – Overview
Options sellers (also known as writers) sell calls or puts and receive a premium income.
They have:
High probability of profit
Steady income potential
But high or unlimited risk if unmanaged
Sellers rely on probability and time decay.
Key Idea:
Selling is similar to becoming an insurance company—high chance of small profits with low chance of large loss.
Pros of Options Selling
1. High Probability Trades
Most sellers target:
60–75% win probability per trade
Small but consistent profits
Time decay working in their favor
Even if the market moves slightly, sellers still win because premium loses value.
2. Time Decay Works in Your Favor
Theta (time decay) accelerates closer to expiry.
Sellers earn money simply because time is passing.
Especially effective:
Weekly expiry
Monthly expiry
Sideways markets
3. Stable, Consistent Income Strategy
Many professional traders, funds, and institutions follow options selling because it provides:
Regular income
Lower volatility in returns
Statistical edges
Covered calls, cash-secured puts, iron condors, credit spreads are all based on selling.
4. Volatility Crush is Beneficial
Events such as results, election outcomes, or data releases cause IV to drop afterward.
This makes premiums collapse, giving sellers quick profits.
5. Works Well in Sideways Markets
70% of the time, markets trade sideways.
Buyers struggle here, but sellers thrive because price stays within their profitable range.
Cons of Options Selling
1. High or Unlimited Loss Risk
Call sellers face unlimited risk if price moves upward violently.
Put sellers face huge risk if the market crashes.
This is why sellers must:
Trade with high capital
Use strict risk management
Often hedge positions
2. High Margin Requirement
Unlike buyers, sellers need large capital.
For index options like NIFTY or BANKNIFTY, margin can be:
₹1–2 lakh for naked selling
₹20k–50k for hedged spreads
Many retail traders cannot maintain these requirements.
3. Large Losses Come Suddenly
Sellers often make small profits for days but can lose months of gains in a single sudden market move.
For example:
War news
RBI policy surprise
Budget shock
Global crash
Overnight gap-ups or gap-downs
These events can cause heavy losses.
4. Requires Strong Discipline
Sellers must:
Hedge
Adjust positions
Cut loss quickly
Avoid greed
Avoid selling naked options
This makes selling more suitable for experienced traders.
3. Which is Better – Buying or Selling?
There is no fixed answer.
It depends on market conditions, trader skill, and psychology.
When to Prefer Options Buying
When expecting strong directional movement
During breakouts/breakdowns
During high momentum days
Before events with expected big moves
For small capital traders
Buyers should enter only in trending markets.
When to Prefer Options Selling
When markets are sideways
When volatility is high and expected to fall
For consistent income strategies
For experienced traders with good risk management
When trading weekly options
Sellers profit without needing large price movements.
4. Summary Table – Options Buying vs Selling
Feature Options Buying Options Selling
Risk Limited High/Unlimited
Reward Unlimited Limited
Capital Required Low High
Probability of Profit Low High
Fights Time Decay? Yes No
Benefits from IV? Increasing IV Decreasing IV
Best Market Trending Sideways
Skill Level Needed Medium High
Ideal For Small traders Professional traders
5. Final Thoughts
Both options buying and selling have their own place in a trader’s toolkit.
Buyers enjoy big rewards but face low probability trades due to time decay.
Sellers enjoy high probability setups but face the risk of large losses if the market moves violently.
Most successful traders eventually learn to combine both buying and selling through:
Spreads
Straddles
Strangles
Covered calls
Iron condors
Hedged strategies
Understanding the strengths and weaknesses of each approach helps traders manage risk and build consistent long-term profitability.

Breakout & Breakdown Trading (Success vs Failure Patterns)1. What is a Breakout?
A breakout happens when price moves above a key resistance after staying inside a consolidation zone. It indicates that buyers have overcome sellers, showing strength and potential for trend continuation.
Common breakout zones:
Horizontal resistance
Trendlines
Channel tops
Supply zones
Chart patterns like triangle, flag, wedge, cup & handle
A successful breakout must show:
Strong volume
Clear candle close above resistance
Follow-through in next candles
Retest with buying support
2. What is a Breakdown?
A breakdown occurs when price moves below a major support level after consolidation. It signals that sellers have overpowered buyers, indicating bearish continuation.
Breakdown zones include:
Horizontal support
Trendline breakdown
Channel bottom break
Demand zone break
Pattern failures (Head & shoulders, double top)
A valid breakdown must show:
High selling volume
Clear candle close below support
Lower lows on follow-through
Retest with rejection
3. Why Breakouts & Breakdowns Matter? – Market Psychology
A breakout/breakdown reflects imbalanced order flow:
Breakout psychology
Sellers at resistance get absorbed
New buyers enter
Short sellers hit stop-loss and add fuel to upside
Momentum traders join
Trend accelerates
Breakdown psychology
Buyers at support get exhausted
Short sellers enter
Long holders exit in panic
Fresh supply increases
Trend intensifies
These mechanics make breakout/breakdown candles sharp and powerful.
4. Success Patterns – What Makes a Breakout/Breakdown Work?
To increase accuracy, focus on confluence signals. When multiple signals align, probability increases.
A. Successful Breakout Signs
Volume Expansion
Volume must rise 30%+ compared to recent average.
High volume = real institutional participation.
Strong Marubozu / Bullish Candle
A candle that closes near its highs.
Shows aggressive buying.
Retest + Support Hold
Price revisits breakout level.
Buyers defend the zone → confirmation.
Low Wick Candles
Less rejection = clean breakout.
Trend Alignment
Breakout in direction of higher-timeframe trend works better.
Breakout After Tight Consolidation
The tighter the range, the bigger the explosion.
B. Successful Breakdown Signs
High Selling Volume
Indicates institutional unloading.
Bearish Marubozu Candle
Indicates dominance of sellers.
Retest + Rejection at Support-turned-Resistance
Very strong confirmation.
Lower Lows & Lower Highs Formation
Market structure shifts bearish.
Volatility Contraction → Expansion
After compression, breakdowns travel fast.
5. Failure Patterns – Why Breakouts & Breakdowns Fail?
Most retail losses occur in false breakouts and false breakdowns—commonly called Traps.
Smart Money often pushes price beyond a level briefly, triggering retail entries and stop-losses, then reverses the move.
A. False Breakout (Bull Trap)
Price goes above resistance only to fall back quickly.
Reasons:
Big players remove liquidity by trapping buyers
Low volume breakout
No candle close above resistance
Overbought conditions
Breakout during news whipsaws
Higher timeframe resistance not broken
Key signs:
Long upper wicks
Quick rejection
Bearish engulfing after breakout
Volume divergence (price up, volume down)
B. False Breakdown (Bear Trap)
Price dips below support but reverses fast.
Reasons:
Institutions collect liquidity
Weak selling participation
Not enough follow-through
Price at oversold zone
Higher timeframe support not broken
Key signals:
Long lower wicks
Bullish engulfing after fake breakdown
High volume on recovery candle
6. Entry Techniques (High Probability)
A. Breakout Entry Types
Aggressive Entry (On breakout candle)
High reward if breakout is strong
High risk of fakeout
Conservative Entry (On retest)
Wait for price to retest the breakout zone
Ideal for safer trading
Higher accuracy
Continuation Entry (After first pullback)
Enter when new higher low is formed
Best for trending markets
B. Breakdown Entry Types
Aggressive (On breakdown candle)
Retest Entry (Support becomes resistance)
Continuation (Lower high formation)
Retests offer the safest and most reliable entries in both breakout and breakdown setups.
7. Stop-Loss Placement
Proper SL protects capital in case of failed pattern.
Breakout SL
Below breakout level
Below retest low
Below previous swing low
Breakdown SL
Above breakdown zone
Above retest high
Above previous swing high
Avoid placing SL too close; markets often "hunt" tight stops.
8. Profit Target Strategies
To maximize gains:
Measure move technique
Target = Height of consolidation range
Fibonacci extensions
Common targets: 1.272, 1.618
Next supply/demand zones
Trailing stop using ATR
Lock profits in strong trends
Price-action based exits
Exit on reversal signal or opposite engulfing
9. High-Timeframe Confluence
Breakouts aligned with HTF structures have the highest win rate.
Example:
Weekly uptrend
Daily resistance breakout
1H retest entry
Multiple timeframe agreement = strong institutional bias.
10. Common Mistakes Traders Make
❌ Entering too early inside the range
❌ Trading without volume confirmation
❌ Trading breakouts against higher-timeframe trend
❌ Chasing after extended candles
❌ Placing SL too tight
❌ Trading breakouts during news events
❌ Over-leveraging for "guaranteed" moves
Correcting these issues can drastically improve win rate.
11. How Smart Money Creates Traps
Smart Money uses liquidity manipulation:
Pushes price slightly above resistance
Retail enters breakout longs
Smart Money sells into retail buying
Price reverses → SL hunting
After trapping traders, real move begins
Understanding this reduces fakeout trades dramatically.
12. Breakout vs Breakdown – Which is More Reliable?
Neither is inherently better, but:
Breakouts work better in bullish markets
Breakdowns work better in bearish conditions
Always trade in line with market sentiment and broader trend.
Conclusion
Breakout and breakdown trading is powerful—but only when you combine volume, price action, market structure, and retests. Successful setups show strength, follow-through, and clean technical confirmation. Failed setups often show wick rejections, low volume, and lack of structure.
Mastering the difference between success and failure patterns can significantly improve your accuracy and confidence as a trader.
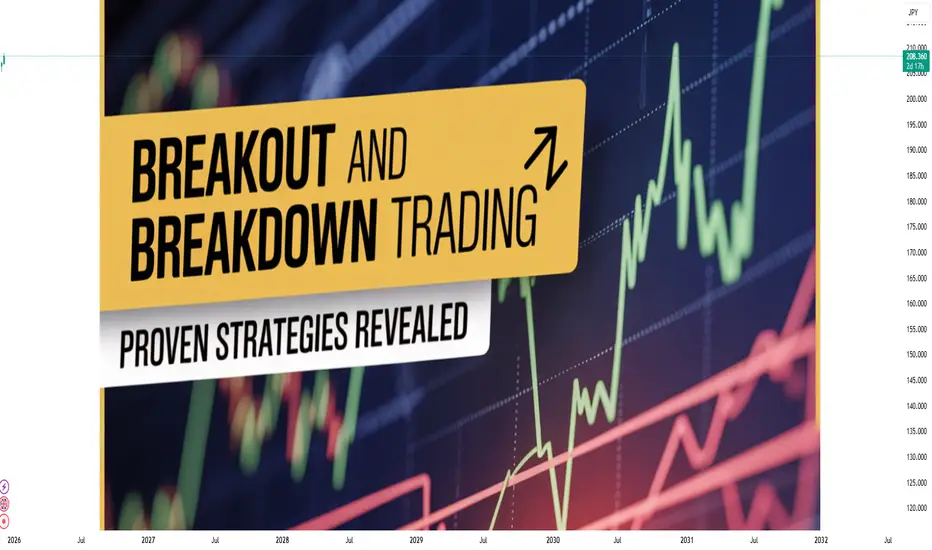
OLAELEC 1 Day Time Frame 📊 Key Daily Levels (Support & Resistance)
From pivot analysis & live technical indicators (today’s data):
Pivot: ~₹34.72
Resistance Levels:
• R1 ~ ₹35.83
• R2 ~ ₹37.56
• R3 ~ ₹38.67
Support Levels:
• S1 ~ ₹32.99
• S2 ~ ₹31.88
• S3 ~ ₹30.15
These are the real-time intraday/daily pivot support & resistance levels traders watch for short term moves.
Alternative pivot data from recent technical sites (slightly different levels):
Pivot: ~₹41.34
Resistance: ~₹41.8 / ₹42.4 / ₹42.9
Support: ~₹40.7 / ₹40.3 / ₹39.7
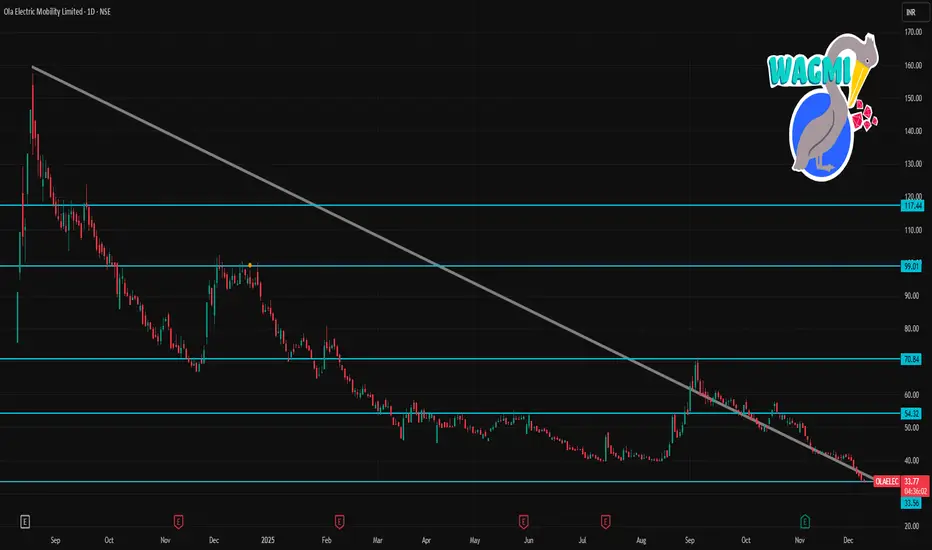
FEDERALBNK 1 Day Time Frame 📈 Key Data / Context
The stock currently trades in the ballpark of ₹258–260 / share.
Over the past 52 weeks, the share has ranged roughly between ₹172.66 (low) and ₹262.00 (high).
Fundamental metrics: P/E ratio around ~15–16×, book value ~ ₹147, and a modest dividend yield.
⚠️ What to Keep in Mind
As a bank stock, broader macroeconomic factors (interest‑rate outlook, banking sector sentiment, credit growth) matter — technical levels can get invalidated if fundamentals shift.
A “breakout” above resistance (e.g. ₹262–265) should ideally be backed by volume for conviction.
Similarly, a drop below support (₹255 / ₹252) could trigger more support tests — a stop‑loss strategy may be useful if trading short‑term.
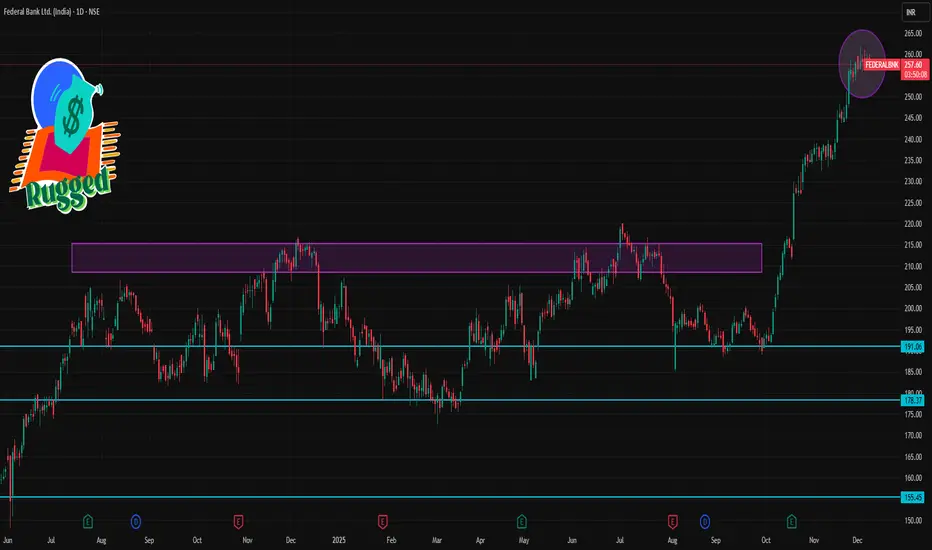
Part 2 Intraday Master Class How Beginners Should Approach Options
For beginners:
Start with index options (Nifty/BankNifty) – deep liquidity.
Avoid naked selling – too risky.
Focus on simple strategies like:
Buying Calls/Puts
Bull Call Spread
Bear Put Spread
Always trade with a clear stop-loss.
Understand Greeks before complex trades.
Keep position size small in the beginning.

Part 1 Master Candle Stick Pattern Put Options Explained
A put option increases in value when the price of the underlying asset falls.
Example:
Nifty is at 20,000. A trader buys a Nifty 19,900 Put Option.
If Nifty falls below 19,900, the put option value rises.
Put option buyers expect the price to go down.
Put option sellers expect the price to stay above the strike.

Part 1 Intraday Master ClassUnderstanding Options: Basic Terms
Before going into the rules, you must understand the core terms:
a) Call Option
A call option gives the buyer the right, but not the obligation, to buy an asset (like Nifty, Bank Nifty, stocks) at a fixed price.
b) Put Option
A put option gives the buyer the right, but not the obligation, to sell an asset at a fixed price.
c) Strike Price
The price at which the option buyer can buy (call) or sell (put) the underlying asset.
d) Premium
The price paid by the option buyer to the option seller (writer). Premium is non-refundable.
e) Expiry Date
The last date on which the option contract is valid. After expiry, the contract becomes worthless.
f) Lot Size
Each option contract is traded in fixed quantities called “lots.” You cannot buy 1 share in options, only lots.
