Introduction and Types of Trading RiskIntroduction to Trading Risk
Trading in financial markets—whether equities, commodities, forex, or derivatives—offers the potential for significant profits, but it also exposes participants to various risks. Understanding trading risk is fundamental for any trader or investor, as it determines the potential for loss, the strategies to manage it, and the overall approach to financial decision-making.
At its core, trading risk is the possibility of losing some or all of the invested capital due to unpredictable market movements, operational failures, or external events. Unlike long-term investing, trading typically involves shorter time horizons, which often magnifies the exposure to volatility and uncertainty.
Why Understanding Trading Risk Is Important
Capital Preservation: Without understanding risk, traders may face catastrophic losses that can wipe out their trading accounts.
Strategic Planning: Identifying the type of risk helps traders plan positions, leverage usage, and stop-loss levels.
Psychological Preparedness: Awareness of risk helps manage emotional reactions, such as fear and greed, which often drive irrational trading decisions.
Compliance and Governance: For professional traders, understanding and documenting risk is crucial for regulatory compliance and reporting.
Trading risk is multidimensional. While some risks are inherent to the market itself, others are related to human behavior, operational inefficiencies, and broader economic factors. To navigate trading successfully, one must not only acknowledge these risks but also actively mitigate them through strategies, tools, and disciplined risk management practices.
Types of Trading Risk
Trading risk can be broadly classified into several categories. Each type has unique characteristics, causes, and mitigation strategies. Understanding these categories allows traders to make informed decisions and develop robust risk management plans.
1. Market Risk (Systematic Risk)
Definition: Market risk, also known as systematic risk, is the risk of losses due to overall market movements. It affects all securities in the market to some degree and cannot be entirely eliminated through diversification.
Key Characteristics:
Affects entire markets or market segments.
Driven by macroeconomic factors, geopolitical events, or global crises.
Unpredictable and largely unavoidable.
Examples:
Stock market crash due to an economic recession.
Interest rate changes impacting bond prices.
Currency devaluation affecting forex positions.
Subtypes of Market Risk:
Equity Risk: Risk of decline in stock prices.
Interest Rate Risk: Risk of losses from fluctuating interest rates.
Currency Risk: Risk arising from foreign exchange rate movements.
Commodity Risk: Risk of price changes in commodities like gold, oil, or wheat.
Mitigation Strategies:
Use of hedging instruments such as options and futures.
Diversification across asset classes.
Limiting exposure to highly volatile sectors.
2. Credit Risk (Counterparty Risk)
Definition: Credit risk is the possibility that a counterparty in a trade may default on their obligations. This is common in over-the-counter (OTC) markets, derivatives trading, and margin trading.
Key Characteristics:
Directly linked to the financial health of the counterparty.
Often overlooked by retail traders but critical for institutional trading.
Examples:
A forex broker failing to honor withdrawal requests.
A company defaulting on bond payments.
Counterparties in a derivatives contract not meeting their obligations.
Mitigation Strategies:
Conduct thorough due diligence before trading.
Use regulated and reputable brokers or exchanges.
Limit counterparty exposure and utilize collateral agreements.
3. Liquidity Risk
Definition: Liquidity risk is the risk of not being able to buy or sell a security quickly at the desired price due to insufficient market activity.
Key Characteristics:
More pronounced in thinly traded markets or exotic assets.
Can lead to significant losses if positions cannot be exited efficiently.
Examples:
Selling a large block of stocks in a small-cap company may drastically lower the price.
Difficulty liquidating positions during market closures or crises.
Forex pairs with low trading volume causing slippage.
Mitigation Strategies:
Trade only in liquid markets and assets.
Limit the size of positions relative to average market volume.
Use limit orders to control entry and exit prices.
4. Operational Risk
Definition: Operational risk arises from failures in internal processes, systems, or human error rather than market movements.
Key Characteristics:
Often underestimated by individual traders.
Includes errors in order execution, technical glitches, or fraudulent activity.
Examples:
System downtime preventing timely execution of trades.
Misplacing stop-loss orders due to human error.
Broker technical failure during high-volatility sessions.
Mitigation Strategies:
Implement reliable trading platforms and backup systems.
Automate risk management tools like stop-loss and take-profit.
Train staff or oneself in proper operational procedures.
5. Legal and Regulatory Risk
Definition: Legal risk is the possibility of losses due to changes in laws, regulations, or non-compliance issues.
Key Characteristics:
Particularly relevant for institutional traders or those trading internationally.
Can impact market access, trading costs, or tax liabilities.
Examples:
Regulatory changes restricting derivatives trading.
Introduction of new taxes on financial transactions.
Penalties for non-compliance with market regulations.
Mitigation Strategies:
Stay informed about regulatory developments.
Consult legal and compliance experts for guidance.
Ensure all trading activities comply with local and international laws.
6. Psychological Risk (Behavioral Risk)
Definition: Psychological risk refers to losses resulting from human emotions, biases, or irrational decision-making.
Key Characteristics:
Rooted in behavioral finance.
Affects both novice and experienced traders.
Examples:
Overtrading due to fear of missing out (FOMO).
Panic selling during a market correction.
Holding losing positions too long due to emotional attachment.
Mitigation Strategies:
Develop and adhere to a trading plan.
Use journaling to track decisions and emotions.
Employ discipline and self-awareness techniques.
7. Event Risk (Unsystematic Risk)
Definition: Event risk, also known as unsystematic risk, is linked to specific events or occurrences that affect a particular company, sector, or asset.
Key Characteristics:
Can be mitigated through diversification.
Often sudden and unpredictable.
Examples:
Corporate fraud or bankruptcy affecting stock prices.
Natural disasters impacting commodity production.
Product recalls causing sudden revenue loss for a company.
Mitigation Strategies:
Diversify across companies, sectors, and geographies.
Use derivative instruments to hedge exposure.
Monitor news and corporate announcements regularly.
8. Systemic Risk
Definition: Systemic risk refers to the potential collapse of an entire financial system or market, rather than just individual investments.
Key Characteristics:
Triggered by interconnectedness of institutions and markets.
Can have widespread economic implications.
Examples:
The 2008 global financial crisis.
Contagion effect during a banking collapse.
Extreme volatility in global markets due to geopolitical conflicts.
Mitigation Strategies:
Reduce leverage in positions.
Monitor macroeconomic indicators and systemic trends.
Employ stress testing to evaluate portfolio resilience.
9. Geopolitical and Macro-Economic Risk
Definition: This is the risk of losses caused by political instability, wars, international trade disruptions, or macroeconomic shifts.
Key Characteristics:
Highly unpredictable and difficult to hedge completely.
Often impacts multiple asset classes simultaneously.
Examples:
Trade sanctions affecting stock and commodity markets.
Political unrest leading to currency depreciation.
Central bank policy changes affecting interest rates and liquidity.
Mitigation Strategies:
Diversify internationally.
Use hedging instruments to protect against currency or commodity risks.
Stay updated with global political and economic developments.
10. Leverage Risk
Definition: Leverage risk arises when traders borrow capital to amplify potential gains, which also increases potential losses.
Key Characteristics:
Common in forex, derivatives, and margin trading.
Can quickly wipe out capital if not managed properly.
Examples:
Using high margin to take large positions in volatile stocks.
Futures contracts causing losses exceeding the initial investment.
Leveraged ETFs amplifying market swings.
Mitigation Strategies:
Limit leverage exposure.
Employ strict stop-loss and position-sizing rules.
Understand the underlying asset and market volatility before using leverage.
Conclusion
Trading risk is multifaceted, encompassing market, operational, psychological, and systemic elements. A successful trader does not aim to eliminate risk entirely—this is impossible—but rather to understand, measure, and manage it effectively. Proper risk management involves identifying the type of risk, analyzing potential impacts, and implementing strategies to mitigate losses while preserving opportunities for gains.
By comprehensively understanding trading risk, traders can make more informed decisions, protect their capital, and improve long-term profitability. The key takeaway is that risk is an inherent part of trading, but with discipline, education, and proactive strategies, it can be navigated successfully.
Tradingidea
Introduction to Trading and Business Growth1. Understanding Trading: The Core Concept
Trading is the process of buying and selling financial instruments or goods to generate profit. While often associated with financial markets such as stocks, commodities, forex, and cryptocurrencies, trading can also refer to commercial activities involving goods and services. Trading operates on the principle of supply and demand: traders aim to buy low and sell high, capitalizing on price fluctuations.
1.1 Types of Trading
Financial Market Trading
Equities (Stocks): Buying shares in companies and profiting from price appreciation or dividends.
Commodities: Trading raw materials like gold, oil, or agricultural products.
Forex: Currency trading based on global exchange rate movements.
Cryptocurrency: Digital currencies traded on specialized exchanges.
Commercial Trading
Retail Trade: Buying goods in bulk and selling to consumers at a profit.
Wholesale Trade: Selling large quantities of products to retailers or businesses.
International Trade: Importing and exporting goods across borders.
Algorithmic & High-Frequency Trading (HFT)
Trading strategies executed through computers using complex algorithms, often capitalizing on millisecond-level market movements.
1.2 Principles of Successful Trading
Market Analysis: Understanding price movements using technical, fundamental, and sentiment analysis.
Risk Management: Limiting potential losses through stop-loss orders, diversification, and position sizing.
Discipline & Patience: Sticking to strategies without letting emotions dictate decisions.
Liquidity Awareness: Ensuring assets can be bought or sold without significant price disruption.
Trading is not just luck; it is a combination of strategy, research, timing, and execution.
2. Introduction to Business Growth
Business growth refers to the expansion of a company’s capacity, market presence, revenue, or profitability over time. Growth is essential for survival in competitive markets and can take various forms: increasing sales, entering new markets, launching new products, or improving operational efficiency.
2.1 Types of Business Growth
Organic Growth
Achieved through internal processes such as expanding product lines, enhancing marketing, improving customer experience, and scaling operations.
Examples: Increasing production, hiring talent, expanding into new cities.
Inorganic Growth
Occurs through mergers, acquisitions, or strategic partnerships.
Provides instant market share and access to resources but may involve higher risks and integration challenges.
Revenue Growth
Focused on increasing sales and turnover through better pricing, marketing, or diversification.
Market Growth
Expanding into new geographies or target audiences.
Product or Service Growth
Developing innovative products or enhancing existing offerings to attract new customers.
Operational Growth
Improving efficiency, reducing costs, and scaling infrastructure to support higher output.
2.2 Key Drivers of Business Growth
Customer-Centric Strategies: Understanding customer needs and delivering superior value.
Innovation & Technology Adoption: Leveraging modern tools and digital transformation to gain competitive advantage.
Financial Management: Optimizing cash flow, investments, and risk exposure.
Market Penetration & Diversification: Entering new markets or offering complementary products.
Talent Acquisition & Retention: Recruiting skilled personnel and fostering an innovative culture.
3. Trading as a Driver of Business Growth
Trading and business growth are closely intertwined. Effective trading strategies can enhance revenue, generate cash flow, and support overall business expansion.
3.1 Trading for Capital Generation
Trading financial instruments can serve as a source of capital for businesses. For example:
Profits from stock trading or forex can fund expansion projects.
Commodities trading can stabilize costs and ensure supply for manufacturing firms.
3.2 Risk Mitigation and Business Stability
Businesses engaged in trading often implement hedging strategies to reduce exposure to market volatility.
Example: Airlines hedge fuel prices to prevent unexpected costs from affecting profitability.
By reducing uncertainty, trading supports predictable cash flows essential for growth planning.
3.3 Strategic Partnerships Through Trade
Trading fosters relationships with suppliers, distributors, and financial institutions.
Strong trade networks can accelerate market expansion and operational scaling.
3.4 Learning Market Dynamics
Traders gain insights into market trends, consumer behavior, and economic cycles.
Businesses that apply these insights can better forecast demand, price products effectively, and expand strategically.
4. Strategies for Sustainable Business Growth
Sustainable growth is achieved through careful planning, resource management, and strategic execution.
4.1 Market Research and Competitive Analysis
Conducting research on competitors, customer preferences, and emerging trends helps businesses identify opportunities.
Tools: SWOT Analysis, PESTEL Analysis, Porter's Five Forces.
4.2 Diversification and Innovation
Diversifying products or services reduces dependency on a single revenue source.
Innovation creates differentiation and strengthens market positioning.
4.3 Marketing and Brand Development
Building a strong brand fosters customer loyalty and supports long-term growth.
Strategies include digital marketing, influencer collaborations, and content-driven campaigns.
4.4 Technology and Digital Transformation
Adopting modern technologies improves operational efficiency and customer experience.
Examples: ERP systems, AI-based analytics, e-commerce platforms, and CRM software.
4.5 Financial Planning and Investment
Growth requires capital investment. Businesses must balance reinvestment with profitability.
Tools: Budget forecasting, cash flow management, ROI analysis.
4.6 Talent Development and Organizational Culture
Skilled employees drive innovation, productivity, and competitive advantage.
Fostering a culture of continuous learning and adaptability is crucial for scaling.
5. Challenges in Trading and Business Growth
Both trading and business expansion come with inherent risks and challenges.
5.1 Market Volatility
Prices in financial markets fluctuate rapidly due to economic news, geopolitical tensions, and market sentiment.
Businesses trading commodities or currencies are particularly exposed.
5.2 Operational Risks
Inefficient processes, supply chain disruptions, or poor management can impede growth.
5.3 Competition
Intense competition pressures pricing, margins, and market share.
5.4 Regulatory Compliance
Adhering to regulations in trading (Securities laws, trade regulations) and business operations is critical to avoid penalties.
5.5 Financial Constraints
Insufficient funding can limit expansion opportunities.
Mismanaged trading positions may lead to liquidity problems.
5.6 Technology and Cybersecurity Threats
Digital trading platforms and business operations are vulnerable to cyberattacks.
Investment in secure infrastructure is essential.
6. Integrating Trading and Business Growth Strategies
A successful enterprise combines trading expertise with a robust growth framework.
6.1 Leveraging Market Opportunities
Businesses can use market analysis from trading to anticipate demand and make strategic decisions.
Example: A commodities trader expanding into food processing can use price trends to optimize procurement.
6.2 Capital Allocation for Growth
Profits from trading can be reinvested into business expansion projects such as new product launches, marketing campaigns, or international expansion.
6.3 Risk Hedging and Contingency Planning
Hedging in trading (e.g., options, futures contracts) protects businesses against price fluctuations.
Contingency plans ensure operations remain stable during economic turbulence.
6.4 Building Strategic Alliances
Trading networks often evolve into partnerships with suppliers, distributors, or even competitors.
Alliances facilitate shared resources, reduced costs, and faster market penetration.
7. Case Studies of Trading Driving Business Growth
7.1 Walmart and Supply Chain Optimization
Walmart’s retail success is deeply tied to its strategic trading and supply chain practices.
Real-time inventory management and bulk procurement allow it to scale rapidly and maintain competitive pricing.
7.2 Apple Inc. and Global Supply Management
Apple’s business growth relies on strategic sourcing and trading agreements with suppliers worldwide.
By controlling procurement costs and ensuring component availability, Apple can launch products at scale.
7.3 Hedge Funds and Capital Growth
Hedge funds leverage trading strategies to generate high returns, which are then reinvested into diversified portfolios.
Successful trading supports long-term growth of fund size and investor trust.
8. Future Trends in Trading and Business Growth
8.1 Digital Transformation
Blockchain, AI, and machine learning are reshaping trading and business operations.
Automated trading platforms and predictive analytics will optimize decision-making and operational efficiency.
8.2 Globalization and International Markets
Global trading expands business opportunities and enables diversification.
Emerging markets offer high growth potential but require careful risk assessment.
8.3 Sustainable and Ethical Practices
Businesses are increasingly integrating ESG (Environmental, Social, and Governance) principles.
Ethical trading and sustainable growth practices attract conscious consumers and long-term investors.
8.4 Data-Driven Decision Making
Big data and analytics empower businesses to understand market trends and consumer behavior.
Real-time trading data informs strategic expansion and risk management.
8.5 Decentralized Finance (DeFi) and Cryptocurrency Trading
DeFi and digital assets open new avenues for trading and capital growth.
Early adoption can create competitive advantages in innovative sectors.
9. Conclusion
Trading and business growth are intertwined pathways to financial success. Trading provides capital, insights, and market intelligence that fuel business expansion, while strategic business growth ensures that profits from trading are reinvested sustainably.
To achieve long-term success:
Businesses must integrate trading strategies with robust growth planning.
Risk management, financial prudence, and innovation are essential.
A forward-looking approach, leveraging technology and global trends, strengthens resilience and scalability.
Ultimately, trading is more than a mechanism for profit—it is a tool for strategic growth, enabling businesses to expand their reach, enhance operational efficiency, and secure a sustainable competitive edge in a dynamic global economy.
History and Evolution of Crypto Markets1. Precursors to Cryptocurrency
1.1 Early Concepts of Digital Money
The idea of digital money predates blockchain technology. Early attempts to create decentralized digital currencies emerged in the 1980s and 1990s. Notable examples include:
DigiCash (1989): Developed by David Chaum, DigiCash was an electronic cash system emphasizing privacy through cryptographic techniques. Despite its innovation, DigiCash failed commercially due to regulatory challenges and lack of adoption.
e-gold (1996): E-gold allowed users to transact in a gold-backed digital currency. It gained significant traction but ultimately faced legal issues related to money laundering, illustrating the challenges of regulating digital currencies.
1.2 Cryptography and the Idea of Decentralization
The foundational technology behind cryptocurrencies—cryptography—had been developing since the 1970s. Public key cryptography, hash functions, and digital signatures made secure, verifiable digital transactions possible. Visionaries like Wei Dai and Nick Szabo proposed concepts such as b-money and bit gold, which laid the groundwork for a decentralized digital currency system.
2. The Birth of Bitcoin
2.1 Satoshi Nakamoto and the White Paper (2008)
The official history of cryptocurrencies begins with Bitcoin. In 2008, an individual or group using the pseudonym Satoshi Nakamoto published the Bitcoin white paper, titled “Bitcoin: A Peer-to-Peer Electronic Cash System.”
Key innovations included:
Decentralization: Bitcoin operates without a central authority.
Blockchain: A distributed ledger ensures transparency and immutability.
Proof-of-Work: A consensus algorithm secures the network against double-spending.
Limited Supply: Bitcoin’s capped supply of 21 million coins created scarcity.
2.2 Launch and Early Adoption (2009–2011)
Bitcoin’s genesis block was mined in January 2009, marking the birth of the cryptocurrency ecosystem. Early adopters were primarily technologists, libertarians, and cryptography enthusiasts. Bitcoin’s first real-world transaction occurred in May 2010 when Laszlo Hanyecz bought two pizzas for 10,000 BTC, now famously remembered as the first commercial Bitcoin transaction.
By 2011, Bitcoin’s market gained visibility, reaching parity with the US dollar and spawning the first alternative cryptocurrencies, or altcoins, such as Litecoin, which introduced faster transaction times.
3. Expansion of the Crypto Ecosystem
3.1 Altcoins and Innovation (2011–2013)
Following Bitcoin’s success, thousands of alternative cryptocurrencies emerged, each seeking to improve upon Bitcoin’s limitations:
Litecoin (2011): Faster block generation, lower transaction fees.
Ripple (2012): Focused on cross-border payments and institutional adoption.
Namecoin (2011): Introduced decentralized DNS systems.
These early experiments diversified the ecosystem and demonstrated that blockchain could be used for purposes beyond simple peer-to-peer currency.
3.2 Early Exchanges and Market Development
Cryptocurrency exchanges began to appear, enabling users to trade digital assets:
Mt. Gox (2010): Initially a platform for trading Magic: The Gathering cards, it became the largest Bitcoin exchange by 2013, handling over 70% of global BTC transactions.
BTC-e and Bitstamp: Provided additional liquidity and infrastructure for crypto markets.
Exchanges played a critical role in establishing market prices, liquidity, and accessibility for retail investors.
4. The ICO Boom and Ethereum (2013–2017)
4.1 Ethereum and Smart Contracts
In 2013, Vitalik Buterin proposed Ethereum, a blockchain platform with the ability to execute smart contracts—self-executing code that runs on a decentralized network. Launched in 2015, Ethereum allowed developers to create decentralized applications (dApps), paving the way for:
Decentralized finance (DeFi)
Tokenized assets
Complex governance models
4.2 Initial Coin Offerings (ICOs)
Ethereum also enabled the rise of ICOs, where projects issued tokens to raise capital. Between 2016 and 2017, ICOs raised billions of dollars globally, creating a speculative boom. While many ICOs were successful, the market also experienced scams and failures, highlighting the risks of unregulated fundraising.
4.3 Market Maturation and Price Surges
By late 2017, Bitcoin’s price soared to nearly $20,000, and Ethereum exceeded $1,400. The market attracted mainstream media attention, institutional interest, and a wave of retail investors, marking the first major crypto market boom.
5. Market Correction and Regulatory Scrutiny (2018–2019)
5.1 The 2018 Crypto Winter
After the 2017 boom, the crypto market experienced a severe correction:
Bitcoin fell from ~$20,000 to below $4,000.
Many altcoins lost 80–90% of their value.
Market capitalization dropped from over $800 billion to under $200 billion.
5.2 Regulatory Developments
Governments began to recognize the need for regulation:
SEC (USA): Issued warnings about ICOs and classified some tokens as securities.
China: Banned ICOs and domestic cryptocurrency exchanges.
Japan and Switzerland: Introduced licensing frameworks for exchanges.
These measures aimed to protect investors while shaping the market’s infrastructure.
6. The Rise of DeFi, NFTs, and Layer 2 Solutions (2020–2022)
6.1 Decentralized Finance (DeFi)
DeFi platforms emerged, allowing financial services without intermediaries:
Lending and borrowing (Compound, Aave)
Decentralized exchanges (Uniswap, SushiSwap)
Yield farming and liquidity mining
DeFi introduced a new paradigm, where users could earn returns on their assets without traditional banks, but with increased smart contract and systemic risk.
6.2 Non-Fungible Tokens (NFTs)
NFTs became a cultural and financial phenomenon in 2021:
Enabled digital art ownership, collectibles, and gaming assets.
Opened new revenue streams for creators and introduced blockchain to mainstream audiences.
6.3 Layer 2 Solutions and Scaling
Blockchain networks faced congestion as DeFi and NFTs increased activity. Layer 2 scaling solutions (e.g., Polygon, Optimism) and alternative blockchains (e.g., Solana, Avalanche) emerged to reduce fees and increase transaction throughput.
7. Institutional Adoption and Mainstream Integration (2021–2023)
7.1 Institutional Interest
Large institutions began participating in crypto markets:
Companies like MicroStrategy, Tesla, and Square purchased Bitcoin as a reserve asset.
Investment banks and hedge funds launched crypto trading desks.
CME and Bakkt introduced futures and options on crypto.
7.2 Stablecoins and Payment Systems
Stablecoins, such as USDT, USDC, and BUSD, became essential for trading and payments:
Pegged to fiat currencies to reduce volatility.
Facilitated cross-border transactions and DeFi participation.
7.3 Regulatory Progress and Challenges
Governments increasingly engaged in policy formation:
US, EU, and Asia developed frameworks for taxation, anti-money laundering (AML), and investor protection.
Central Bank Digital Currencies (CBDCs) explored the integration of blockchain in sovereign monetary systems.
8. Crypto Market Volatility and Emerging Trends (2023–2025)
8.1 Market Cycles
The crypto market continued to exhibit volatility, driven by macroeconomic factors, technological upgrades, and speculative behavior. Bitcoin’s role as “digital gold” and Ethereum’s shift to proof-of-stake (Ethereum 2.0) shaped investor strategies.
8.2 Emerging Technologies
Web3 Applications: Decentralized social media, gaming, and marketplaces.
Layer 1 Innovations: Ethereum alternatives and sharding for scalability.
Interoperability Protocols: Cosmos, Polkadot, and cross-chain solutions enabling multi-chain ecosystems.
8.3 Societal and Cultural Impact
Cryptocurrencies influenced:
Financial inclusion, especially in developing countries.
New forms of digital identity and governance.
Debates on privacy, censorship, and the future of decentralized networks.
9. Key Lessons from the Evolution of Crypto Markets
Technological Innovation Drives Growth: Blockchain, smart contracts, and cryptography are central to adoption.
Speculation vs. Utility: Early markets were speculative; long-term adoption requires real-world use cases.
Regulation Shapes Markets: Legal clarity encourages institutional participation, while uncertainty can depress growth.
Market Volatility Is Normative: Cycles of boom and bust are inherent, reflecting immature markets and behavioral factors.
Decentralization Challenges Traditional Finance: Peer-to-peer finance, decentralized governance, and tokenized assets redefine financial norms.
10. Future Outlook
10.1 Institutional and Retail Integration
The trend of institutional adoption is expected to continue, alongside growing retail participation through user-friendly platforms and fintech integration.
10.2 Technological Evolution
Layer 2 and interoperability solutions will enhance scalability.
Blockchain-based AI, IoT, and supply chain solutions may drive new use cases.
10.3 Regulation and Mainstream Acceptance
Clearer regulatory frameworks may reduce risk and encourage long-term investment.
CBDCs may coexist with decentralized cryptocurrencies, creating a hybrid financial ecosystem.
10.4 Global Economic Implications
Cryptocurrencies could reshape monetary policy, capital flows, and global finance.
Digital assets may provide new tools for financial inclusion and cross-border trade.
Conclusion
The history and evolution of crypto markets illustrate a journey from obscure digital experiments to a sophisticated, multifaceted global financial ecosystem. Innovations in blockchain, cryptography, and decentralized finance, coupled with cultural adoption and regulatory adaptation, have transformed cryptocurrency from a niche concept into a mainstream asset class. While volatility and uncertainty remain, the trajectory suggests continued integration with traditional finance, technological innovation, and societal influence.
The crypto market’s evolution is ongoing, reflecting broader trends in technology, finance, and global governance. Understanding its history provides critical insights into its future potential and the challenges it may face in shaping the next generation of financial systems.
Part 2 Candle Stick Pattern 1. Introduction to Option Trading
In the world of financial markets, traders and investors are constantly looking for ways to maximize returns while managing risks. Beyond the conventional buying and selling of stocks, bonds, or commodities lies the fascinating arena of derivatives. Among derivatives, options stand out as one of the most versatile and widely used financial instruments.
An option is essentially a contract that gives the holder the right, but not the obligation, to buy or sell an underlying asset at a predetermined price before or at a specified expiration date. This flexibility allows traders to hedge risks, speculate on market movements, or design complex strategies to suit different risk appetites.
Option trading is a double-edged sword: it can generate extraordinary profits in a short span but also result in significant losses if misunderstood. Hence, before stepping into this market, it is essential to understand the fundamentals, mechanics, and strategies behind option trading.
2. Basics of Options
To understand option trading, let us first dissect the essential components.
2.1 Call Options
A call option gives the buyer the right, but not the obligation, to buy the underlying asset at a predetermined price (strike price) within a specific period.
If the asset’s price rises above the strike price, the call option holder can buy at a lower price and profit.
If the price falls below the strike, the buyer may let the option expire worthless, losing only the premium paid.
Example: If you buy a call option on Stock A at ₹100 strike and the stock rises to ₹120, you profit by exercising the option or selling it in the market.
2.2 Put Options
A put option gives the buyer the right, but not the obligation, to sell the underlying asset at the strike price before or at expiration.
If the asset price falls below the strike, the put holder benefits.
If it rises above the strike, the option may expire worthless.
Example: If you buy a put option on Stock A at ₹100 and the stock falls to ₹80, you can sell it at ₹100, making a profit.
2.3 Strike Price
The pre-agreed price at which the underlying asset can be bought or sold.
2.4 Premium
The price paid by the option buyer to the seller (writer) for acquiring the option contract. It represents the upfront cost and is influenced by time, volatility, and underlying asset price.
2.5 Expiration Date
Options have a finite life and must be exercised or left to expire on a specific date.
3. Types of Options
Options vary based on style, market, and underlying assets.
American Options – Can be exercised anytime before expiration.
European Options – Can only be exercised on the expiration date.
Equity Options – Based on shares of companies.
Index Options – Based on stock indices like Nifty, S&P 500, etc.
Commodity Options – Based on gold, silver, crude oil, etc.
Currency Options – Based on forex pairs like USD/INR.
4. Participants in Option Trading
Every option trade involves two primary parties:
Option Buyer – Pays the premium, enjoys the right but no obligation.
Option Seller (Writer) – Receives the premium but carries the obligation if the buyer exercises the contract.
The buyer has limited risk (premium paid), but the seller has theoretically unlimited risk and limited profit (premium received).
5. Why Trade Options?
Traders and investors use options for multiple reasons:
Hedging – Protecting existing investments from adverse price moves.
Speculation – Betting on market directions with limited risk.
Income Generation – Writing options to collect premiums.
Leverage – Controlling a large position with a relatively small investment.

Axis Bank Bullish Long Term ActivationKey Points
Trend Type- Long Term
Rally is already started, but still a long way to go up.So buy on retracements.
If you have the stock than hold it for few months and more.
Like and share is appreciated.
Thank You
To understand how our coding works read the below post-
NSE:AXISBANK

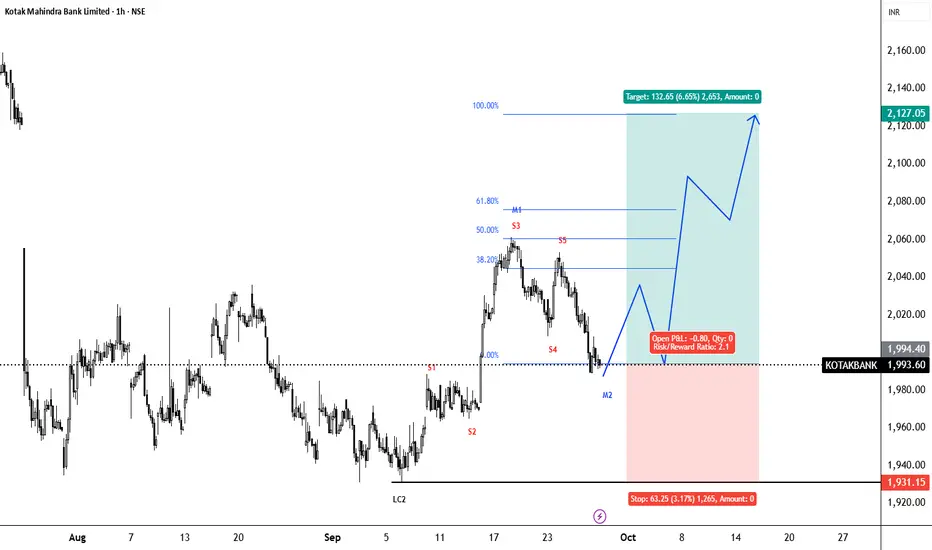
Kotak Mahindra Bank Neowave Trading IdeaNamaskaram Everyone
I trade using Neowave and on that I have created an trading setup, which is kind of automatic entry and exit with Neowave.
Neowave is kind of a method in which you synchronize all the price action across all the time frames. It hides all the noise and tells you market is bullish or bearish.
About Stock Structure
Entry Type- Medium Term Forecast mean Entry will take 4 to 8 weeks and some times more.
Wave Structure- We are at starting point of wave, which kind of gives you an edge in riding the wave when you above your buying level
60 percent Retracement- Mean you will have easily 1:2 or 3 easy risk reward.
Doubts-If you are fearing in taking trades that mean you are taking stop loss amount more than you & your capital can handle.
Follow 1 percent rule and trail, that's it. Don't complicate life and trading.
Simply live and die. HaHA
Like and share is appreciated.
Thank You
To understand how our coding works read the below post-
NSE:KOTAKBANK NSE:KOTAKBANK1!
TITAN📊 Key Support & Resistance Levels
Resistance Levels:
R1: ₹3,432.14
R2: ₹3,563.29
R3: ₹3,616.93
Support Levels:
S1: ₹3,344.13
S2: ₹3,286.27
S3: ₹3,245.23
The stock is currently near its support zone, suggesting a potential for a short-term rebound if buying interest increases.
Technical Indicators
Relative Strength Index (RSI): 22.37, indicating the stock is oversold and may be due for a short-term rebound.
Moving Average Convergence Divergence (MACD): -25.28, signaling a bearish trend.
Moving Averages: A strong sell signal is observed across all major moving averages (MA5 to MA200), with 0 buy signals and 12 sell signals.
📌 Summary
Titan's stock is currently testing its support levels, with technical indicators suggesting potential for a short-term rebound. However, the overall trend remains bearish, and investors should exercise caution. Monitoring the stock's movement around the support levels will be crucial to assess the potential for a reversal.

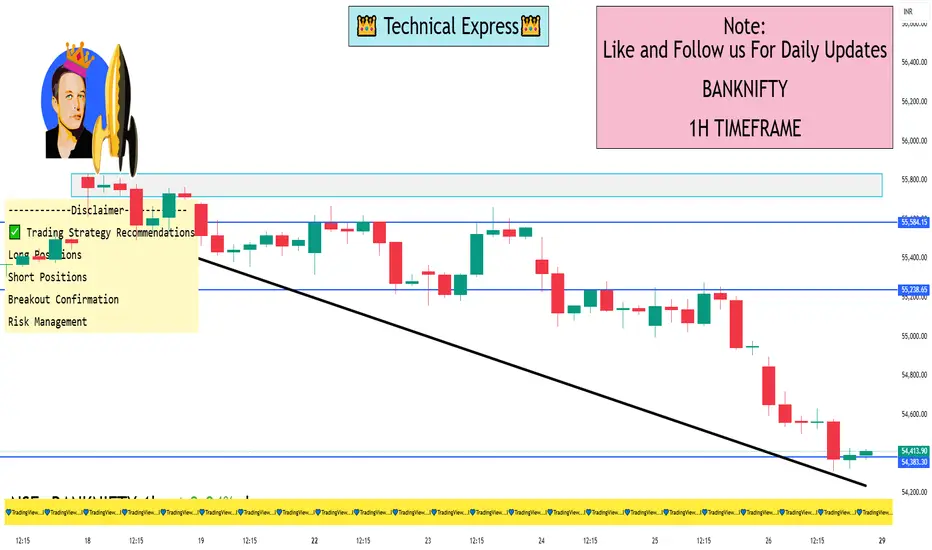
Bank Nifty 1 Hour View📊 Bank Nifty 1-Hour Time Frame Analysis
🔹 Current Market Snapshot
Closing Price (Sep 26, 2025): ₹54,389.35
Day's Range: ₹54,310.95 – ₹54,897.00
52-Week Range: ₹47,702.90 – ₹57,628.40
Trend: Neutral
🔹 Key Support and Resistance Levels
Opening Support/Resistance Zone: ₹54,935 – ₹54,971
Immediate Resistance: ₹55,167
Last Intraday Resistance: ₹55,368
Last Intraday Support: ₹54,698
Deeper Support: ₹54,545
🔹 Market Scenarios
Gap-Up Opening (200+ points):
A gap-up above ₹55,150–₹55,200 will immediately test the Opening Resistance at ₹55,167. Sustaining above this zone may extend the rally towards the last intraday resistance at ₹55,368.
A breakout above ₹55,368 could invite further bullish momentum.
However, if Bank Nifty fails to hold above ₹55,167, it may retrace back to the support zone around ₹54,971.
Educational Note: Gap-ups often invite early profit booking. Always confirm sustainability above resistance levels before initiating aggressive long trades.
Flat Opening (within ±200 points):
A flat start near ₹54,900–₹55,000 means Bank Nifty will trade directly around the Opening Support/Resistance Zone (₹54,935 – ₹54,971).
Holding above ₹54,971 will give buyers confidence to push towards ₹55,167 → ₹55,368.
A failure to sustain above this zone may drag the index down towards ₹54,698 and possibly ₹54,545.
Educational Note: Flat openings provide clearer setups as price tests both support and resistance zones naturally, giving traders better confirmation of direction.
Gap-Down Opening (200+ points):
A gap-down below ₹54,750 will put immediate pressure on Bank Nifty, exposing the Last Intraday Support at ₹54,698.
Use hourly candle close for stop-loss confirmation to prevent whipsaws.
Avoid naked options in high volatility; instead, use spreads (like Bull Call or Bear Put spreads) to limit premium decay.
Maintain a strict 1:2 risk-to-reward ratio.
Never chase trades out of emotion. Scale into trades gradually rather than going all-in at once.
📈 Technical Indicators Overview
Trend: Neutral
Moving Averages: Not specified
RSI (Relative Strength Index): Not specified
MACD (Moving Average Convergence Divergence): Not specified
Stochastic Oscillator: Not specified
Volume: Not specified
✅ Trading Strategy Recommendations
Long Positions: Consider initiating long positions if Bank Nifty sustains above ₹55,167, with a target towards ₹55,368.
Short Positions: Be cautious of short positions unless a clear breakdown below ₹54,698 is observed, with a subsequent target towards ₹54,545.
Breakout Confirmation: Always wait for confirmation (e.g., a 15-minute close) above or below key levels before entering trades.
Risk Management: Employ stop-loss orders to protect against adverse market movements.
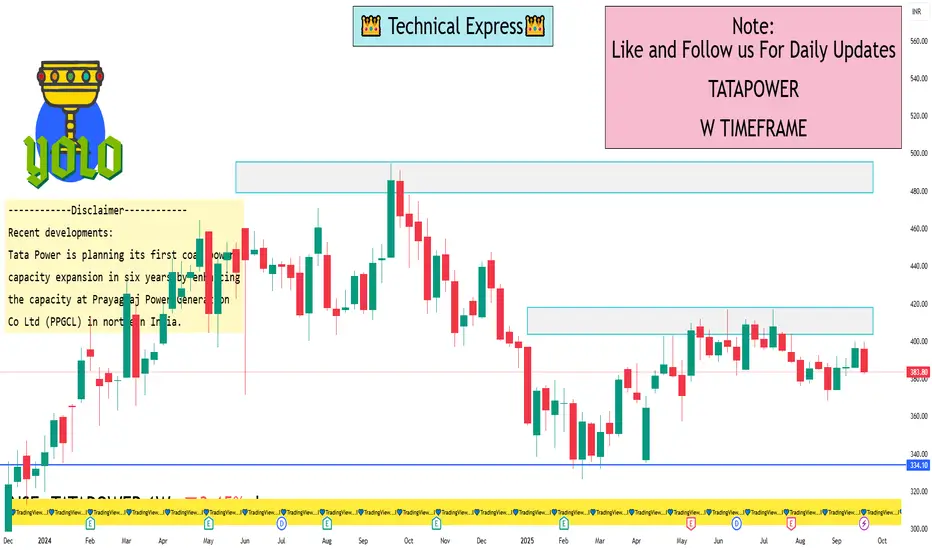
TATAPOWER 1 Week ViewKey Technical Levels for the 1-Week Timeframe:
Immediate Support: ₹383.25 to ₹383.80
Next Support Level: ₹370.00
Immediate Resistance: ₹386.39
Next Resistance Level: ₹391.47
If the stock breaks below ₹383.25, it may test ₹370.00. Conversely, a rise above ₹391.47 could indicate a potential reversal.
Technical Indicators:
Relative Strength Index (RSI): Approximately 30.5, nearing oversold territory.
Moving Average Convergence Divergence (MACD): Currently at -2.66, indicating bearish momentum.
Moving Averages: The 5-day moving average is ₹384.54, suggesting short-term bearishness.
Fundamental insights:
Intrinsic Value: Estimated at ₹211.62, suggesting the stock is currently overvalued.
Profitability: The company reported a 6% year-on-year increase in Q1 net profit to ₹1,262 crore, driven by stronger revenues from renewable energy and transmission & distribution segments.
Recent developments:
Tata Power is planning its first coal power capacity expansion in six years by enhancing the capacity at Prayagraj Power Generation Co Ltd (PPGCL) in northern India.
Outlook:
The stock is currently in a downtrend, with technical indicators favoring a bearish scenario. Investors should monitor support levels closely and consider waiting for a confirmed reversal before making any investment decisions.
Trading Master Class With Experts1. What Are Options?
Options are financial contracts that give traders the right, but not the obligation, to buy or sell an asset (like stocks, indices, or commodities) at a pre-decided price within a specific time frame. Unlike shares, which represent ownership, options are derivatives whose value comes from the price of the underlying asset.
Call Option → Right to buy at a fixed price.
Put Option → Right to sell at a fixed price.
This flexibility makes options useful for speculation, hedging, and income strategies.
2. Key Terminologies in Options
To trade options, one must understand the language of the market:
Strike Price → The price at which the option buyer can buy/sell the underlying.
Premium → The cost paid to buy an option.
Expiry Date → The last date the option can be exercised.
In-the-Money (ITM) → Option has intrinsic value (profitable if exercised now).
Out-of-the-Money (OTM) → No intrinsic value (worthless if exercised now).
Mastering these terms is crucial to avoid confusion while trading.
3. How Option Trading Works
Let’s simplify with an example:
Suppose Reliance stock is trading at ₹2,500. You buy a Call Option with a strike price of ₹2,600 by paying a premium of ₹50.
If Reliance rises to ₹2,700, your option value increases (you gained ₹100 – ₹50 = ₹50 profit).
If Reliance stays below ₹2,600, your option expires worthless, and you lose only the premium (₹50).
This shows how options can provide high reward with limited risk.
4. The Players in Option Trading
There are two main participants:
Option Buyers → Pay a premium, have limited risk but unlimited profit potential.
Option Sellers (Writers) → Receive premium, have limited profit but unlimited risk exposure.
Example: If you sell a call option and the stock skyrockets, your losses can be massive. That’s why option writing requires deep knowledge and strong risk management.
5. Benefits of Option Trading
Why do traders choose options over stocks?
Leverage → Control a large value of assets with small capital (premium).
Hedging → Protects portfolios from sudden market crashes.
Flexibility → Can profit in bullish, bearish, or even sideways markets.
Defined Risk for Buyers → Maximum loss is only the premium paid.
This versatility makes options a favorite tool among professional traders.
6. Risks Involved in Option Trading
Though attractive, options are not risk-free:
Time Decay (Theta) → Option value reduces as expiry approaches, even if stock price doesn’t move.
High Volatility → Sudden market swings can cause rapid premium erosion.
Unlimited Loss for Sellers → Writers can lose far more than the premium received.
Complex Pricing → Influenced by multiple factors (volatility, time, demand-supply).
Hence, proper strategy and discipline are vital.

Part 7 Trading Master Class1. Risk Management in Options Trading
Risk is both the biggest appeal and the biggest danger in options trading. Without proper risk management, traders can face massive losses.
Key practices include:
Position Sizing: Never risking more than a small percentage of capital on a single trade.
Stop-Loss Orders: Exiting positions when losses exceed tolerance levels.
Diversification: Spreading trades across different sectors or instruments.
Hedging: Using options not for speculation but for protection of a stock portfolio.
Awareness of Leverage: Remembering that leverage can magnify both gains and losses.
Professional traders always prioritize risk management over profit chasing.
2. Role of Options in Hedging and Speculation
Options serve dual purposes:
Hedging
Companies hedge currency risks using currency options.
Investors hedge stock portfolios by buying index puts.
Commodity traders hedge raw material costs with commodity options.
Speculation
Traders can take leveraged bets on short-term price movements.
Bullish traders buy calls; bearish traders buy puts.
Volatility traders deploy straddles/strangles to benefit from sharp moves.
This dual nature — protection and profit — makes options invaluable across markets.
3. Options in Global and Indian Markets
Globally, option trading is massive. Exchanges like CBOE (Chicago Board Options Exchange) pioneered listed options. The U.S. markets dominate in volume and liquidity.
In India, options gained traction after NSE introduced index options in 2001. Today:
Nifty and Bank Nifty options are among the most traded derivatives worldwide.
Stock options are actively traded with physical settlement.
Weekly expiry contracts have boosted retail participation.
India is now among the top markets for derivatives trading globally.
4. Challenges, Risks, and Common Mistakes
Despite their potential, option trading is not easy. Challenges include:
Complexity: Requires understanding of pricing models and Greeks.
High Risk for Sellers: Unlimited potential losses.
Time Decay: Buyers must be right not only about direction but also timing.
Liquidity Issues: Illiquid contracts can result in slippage.
Common mistakes traders make:
Overleveraging with large positions.
Ignoring Greeks and volatility.
Trading without a defined plan or exit strategy.
Chasing profits without managing risk.
Awareness of these pitfalls is crucial for long-term success.
5. The Future of Option Trading and Final Thoughts
The world of options is evolving rapidly. With technology, AI-driven strategies, and algorithmic trading, options are becoming more accessible and efficient. Platforms now offer retail traders tools once exclusive to institutions.
In India, the increasing popularity of weekly options and innovations like zero brokerage discount brokers have democratized option trading. Globally, options tied to cryptocurrencies and ETFs are gaining popularity.
However, while opportunities expand, the fundamentals remain unchanged: options are powerful, but they demand respect, knowledge, and discipline.
In conclusion, option trading is not just about making fast money. It’s about using financial intelligence to structure trades, manage risks, and optimize outcomes in an uncertain market.

Part 6 Learn Institutional Trading 1. The Mechanics of Option Trading
Option trading involves two primary participants: buyers and sellers (writers).
Option Buyer: Pays the premium upfront. Has limited risk (only the premium can be lost) but unlimited potential gain (in case of call options) or substantial downside protection (in case of puts).
Option Seller (Writer): Receives the premium. Has limited potential gain (only the premium) but carries significant risk if the market moves against the position.
Trading mechanics also include:
Margin Requirements: Sellers need to deposit margins since their risk is higher.
Lot Size: Options are traded in lots rather than single shares. For example, Nifty options have a standard lot size of 25 contracts.
Liquidity: High liquidity in options ensures tighter spreads and better price execution.
Settlement: Options can be cash-settled (index options in India) or physically settled (individual stock options in India post-2019 reforms).
The actual trading process involves analyzing the market, selecting strike prices, and deciding whether to buy or sell calls/puts depending on the outlook.
2. Option Pricing and the Greeks
One of the most fascinating aspects of option trading is pricing. Unlike stocks, which are priced directly by supply and demand, option prices are influenced by multiple factors.
The Black-Scholes model and other pricing models take into account:
Intrinsic Value: The real value of an option if exercised today.
Time Value: Extra premium based on time left until expiry.
Volatility: Higher expected volatility raises option premiums.
The Greeks
Option traders rely heavily on the Greeks, which measure sensitivity to different market factors:
Delta: Measures how much an option price changes with a ₹1 change in the underlying asset.
Gamma: Measures how delta itself changes with the price movement.
Theta: Time decay; options lose value as expiry nears.
Vega: Sensitivity to volatility.
Rho: Sensitivity to interest rates.
Understanding these allows traders to manage risk more effectively and structure trades in line with their market views.
3. Types of Option Strategies: From Basics to Advanced
Options allow for simple trades as well as complex multi-leg strategies.
Basic Strategies:
Buying Calls (bullish).
Buying Puts (bearish).
Covered Call (own stock + sell call).
Protective Put (own stock + buy put).
Intermediate Strategies:
Bull Call Spread (buy lower strike call, sell higher strike call).
Bear Put Spread (buy put, sell lower strike put).
Straddle (buy call + buy put at same strike).
Strangle (buy out-of-money call + put).
Advanced Strategies:
Iron Condor (combination of spreads to profit from low volatility).
Butterfly Spread (low-risk, low-reward strategy).
Calendar Spread (buy long-term option, sell short-term).
Each strategy has a defined risk-reward profile, making options unique compared to outright stock trading.

Part 4 Learn Institutional Trading 1. Introduction to Options and Their Importance
Financial markets have evolved to provide investors with a wide variety of tools to grow wealth, manage risk, and enhance returns. Among these tools, options stand out as one of the most versatile and powerful instruments.
Options belong to the family of derivatives, meaning their value is derived from an underlying asset such as a stock, index, commodity, or currency. Unlike direct ownership (buying a stock outright), options give the investor rights but not obligations, providing flexibility in trading.
Their importance lies in:
Allowing traders to profit in both rising and falling markets.
Offering leverage (control larger positions with smaller capital).
Serving as a hedging instrument to reduce portfolio risks.
Providing a platform for sophisticated strategies that balance risk and reward.
In today’s markets — whether on Wall Street, the NSE, or other global exchanges — option trading has grown from being a niche practice for institutional investors to a mainstream financial strategy accessible to retail traders as well.
2. Basic Concepts: Calls, Puts, and Premiums
At the core of option trading are call options and put options.
Call Option: A financial contract that gives the buyer the right (not obligation) to buy the underlying asset at a predetermined price (strike price) within a specific time frame.
Example: Buying a Reliance call at ₹2,400 strike allows you to buy Reliance shares at ₹2,400 even if the market price rises to ₹2,600.
Put Option: A contract that gives the buyer the right to sell the underlying asset at a fixed strike price within a specific time frame.
Example: Buying a Nifty put at 20,000 strike allows you to sell at 20,000 even if Nifty drops to 19,500.
Premium: The price paid by the option buyer to the seller (writer) for obtaining this right. Premiums are determined by factors like volatility, time to expiry, and demand-supply.
Strike Price: The fixed level at which the buyer can exercise the right.
Expiration Date: Options are time-bound contracts. At expiry, they either get exercised (if in the money) or expire worthless.
These basic concepts form the foundation of all option strategies and trading approaches.

Part 3 Learn Institutional Trading 1. Definition
Options are financial derivatives that give the buyer the right, but not the obligation, to buy or sell an underlying asset at a specified price within a specified time.
2. Types of Options
Call Option – Right to buy the underlying asset.
Put Option – Right to sell the underlying asset.
3. Option Premium
The price paid by the buyer to the seller (writer) for acquiring the option.
4. Strike Price
The predetermined price at which the underlying asset can be bought or sold.
5. Expiry Date
The date on which the option ceases to exist and becomes worthless if not exercised.
6. In-the-Money (ITM)
Call: Market price > Strike price
Put: Market price < Strike price
7. Out-of-the-Money (OTM)
Call: Market price < Strike price
Put: Market price > Strike price
8. At-the-Money (ATM)
Market price ≈ Strike price; option has no intrinsic value, only time value.
9. Intrinsic Value
Difference between the underlying asset’s current price and the strike price (if favorable).
10. Time Value
The portion of the option premium that reflects the time remaining until expiry.
11. Option Writers
Sellers of options who receive the premium and are obligated to fulfill the contract if exercised.
12. American vs European Options
American: Can be exercised anytime before expiry.
European: Can only be exercised on expiry date.
13. Hedging
Options are used to protect against price movements in the underlying asset.
14. Speculation
Traders use options to bet on price movements with limited capital and defined risk.
15. Leverage
Options allow traders to control a large position with small capital, amplifying both gains and losses.
16. Volatility Impact
Higher volatility generally increases option premiums, as the likelihood of profitable moves rises.
17. Greeks
Metrics that measure option risk:
Delta – Sensitivity to underlying price changes
Gamma – Rate of change of Delta
Theta – Time decay
Vega – Sensitivity to volatility
Rho – Sensitivity to interest rates
18. Strategies
Common strategies include:
Covered Call
Protective Put
Straddle & Strangle
Butterfly & Iron Condor
19. Risk
Buyers: Limited risk (premium paid)
Sellers: Potentially unlimited risk if naked (unhedged)
20. Market Participants
Retail traders
Institutional investors
Hedgers, speculators, and arbitrageurs

Part 1 Ride The Big Moves 1. Introduction to Option Trading
Option trading is one of the most versatile and dynamic segments of financial markets. Unlike traditional equity trading, where investors directly buy or sell shares, options give the right, but not the obligation, to buy or sell an underlying asset at a predetermined price on or before a specific date. This flexibility allows traders to hedge risks, speculate on market movements, and design strategies for income generation or protection against adverse price movements.
Options are derivative instruments, meaning their value derives from an underlying asset, which can be stocks, indices, commodities, currencies, or ETFs. The global options market has grown exponentially over the last few decades due to its ability to provide leverage, risk management tools, and strategic investment opportunities for both retail and institutional traders.
2. Basic Concepts of Options
To understand options trading, it’s essential to grasp some foundational concepts:
2.1 What is an Option?
An option is a contract that grants the holder the right, but not the obligation, to buy or sell a specific asset at a predetermined price (called the strike price) within a defined period (expiry date).
Call Option: Gives the holder the right to buy the underlying asset at the strike price.
Put Option: Gives the holder the right to sell the underlying asset at the strike price.
2.2 Key Terminology
Underlying Asset: The security on which the option is based.
Strike Price / Exercise Price: The price at which the underlying asset can be bought or sold.
Expiry Date: The date on which the option contract expires.
Premium: The price paid by the buyer to the seller for the option.
In-the-Money (ITM): Option has intrinsic value (e.g., a call option where strike price < current market price).
Out-of-the-Money (OTM): Option has no intrinsic value (e.g., a call option where strike price > current market price).
At-the-Money (ATM): Option strike price is approximately equal to the market price.
3. Types of Options
Options can be broadly categorized based on style, market, and underlying asset.
3.1 Based on Style
American Options: Can be exercised anytime before expiry.
European Options: Can only be exercised on the expiry date.
Bermuda Options: Can be exercised on specific dates prior to expiry.
3.2 Based on Market
Exchange-Traded Options (ETOs): Standardized contracts traded on regulated exchanges.
Over-The-Counter Options (OTC): Customized contracts traded directly between parties.
3.3 Based on Underlying Asset
Equity Options: Based on individual stocks.
Index Options: Based on market indices like Nifty, Sensex, S&P 500.
Commodity Options: Based on commodities such as gold, oil, or agricultural products.
Currency Options: Based on foreign exchange rates.
ETF Options: Based on exchange-traded funds.
4. How Options Work
Option trading involves two parties: the buyer and the seller (writer).
Buyer (Holder): Pays the premium and holds the right to exercise the option.
Seller (Writer): Receives the premium and has the obligation to fulfill the contract if the option is exercised.
For example:
Buying a call option gives the potential to profit if the underlying asset's price rises.
Buying a put option profits if the underlying asset's price falls.
Selling options can generate premium income but carries higher risk.

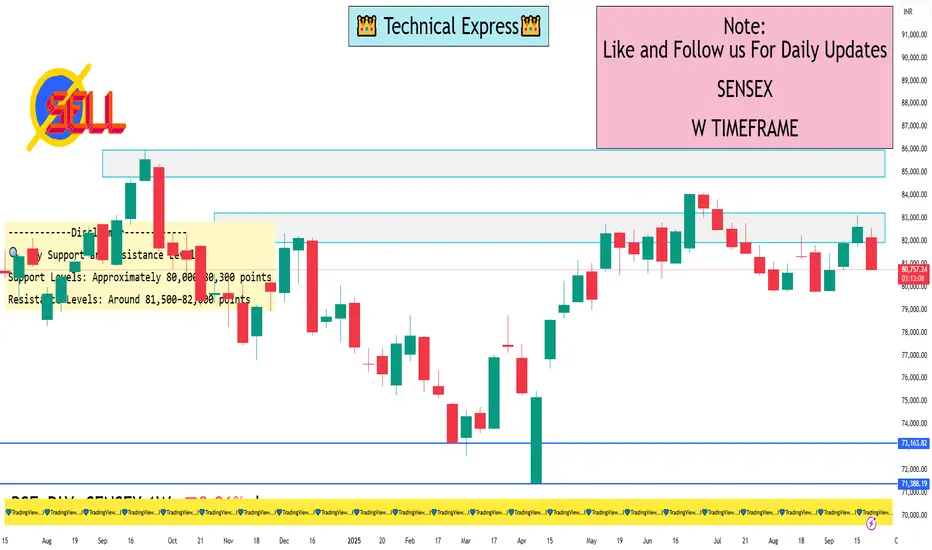
SENSEX 1 Week View📉 Weekly Technical Overview (as of Sep 26, 2025)
Current Level: Approximately 80,782.73 points
Weekly Decline: ~2,000 points, reflecting a drop of about 2.35%
Technical Indicators:
Relative Strength Index (RSI): The RSI is currently in the oversold zone, indicating potential for a short-term rebound if buying interest returns
Moving Averages: Technical analysis suggests a bearish trend, with moving averages signaling a "strong sell" outlook
Pivot Points: Key support and resistance levels are being closely monitored to gauge potential reversal points
🔍 Key Support and Resistance Levels
Support Levels: Approximately 80,000–80,300 points
Resistance Levels: Around 81,500–82,000 points
These levels are crucial for determining the market's short-term direction. A break below support may indicate further downside, while a move above resistance could signal a potential recovery.
📈 Outlook
While the short-term technical indicators suggest a bearish trend, the oversold conditions and key support levels imply that the market may be due for a corrective bounce. However, the ongoing geopolitical tensions and trade-related uncertainties could continue to exert downward pressure on the index.
Investors are advised to monitor the upcoming trading sessions closely, as a decisive move above or below the established support and resistance levels could provide clearer signals for the next phase of market movement.
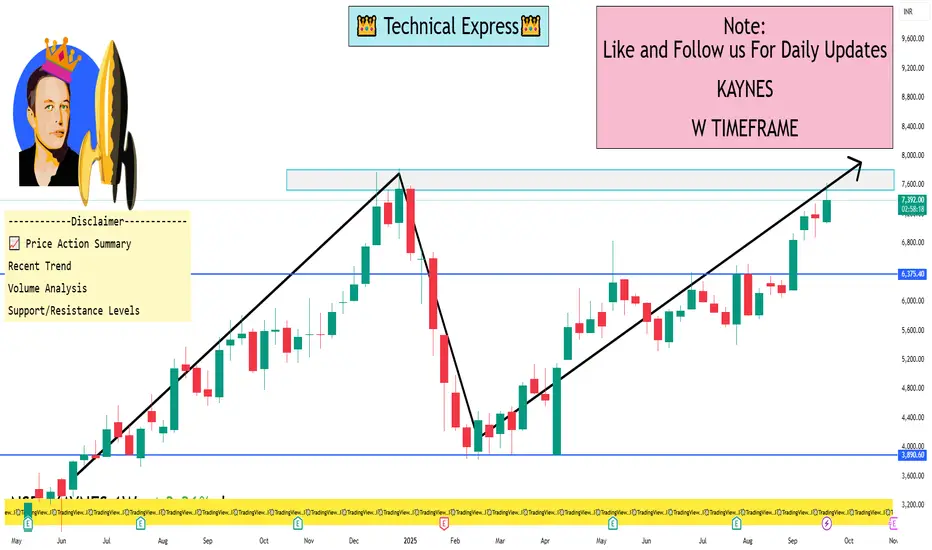
KAYNES 1 Week View 📊 Current Market Snapshot
Current Price: ₹7,379.00
Day's Range: ₹7,375.00 – ₹7,509.00
Previous Close: ₹7,503.00
VWAP (Volume Weighted Average Price): ₹7,445.71
Market Cap: ₹49,725.69 Cr
52-Week High/Low: ₹7,822.00 / ₹3,825.15
P/E Ratio: 156.62
Dividend Yield: 0.00%
Beta: 1.39
Face Value: ₹10.00
Volume: 194,246 shares
🔍 Technical Indicators (1-Day Timeframe)
Moving Averages: Mixed signals; no clear trend direction.
Oscillators: Neutral; no strong buy or sell signals.
Pivot Points: Support around ₹7,375.00; resistance near ₹7,509.00.
MACD: Recently crossed over on September 24, 2025, indicating potential upward momentum.
📈 Price Action Summary
Recent Trend: The stock has shown a slight decline of 1.66% from the previous close, indicating a minor pullback.
Volume Analysis: Trading volume remains moderate, suggesting steady investor interest without significant volatility.
Support/Resistance Levels: Immediate support at ₹7,375.00; resistance at ₹7,509.00. A breakout above resistance could signal a continuation of the upward trend; a drop below support may indicate further downside.
🧠 Market Sentiment
Investor sentiment appears cautiously optimistic, with recent developments such as the company's expansion into OSAT and PCB manufacturing, backed by government subsidies, potentially contributing to positive outlooks.
Types of Trading in India: An In-Depth Analysis1. Equity Trading (Stock Trading)
Overview: Buying and selling shares of companies listed on stock exchanges like NSE and BSE.
Key Features:
Can be short-term (intraday) or long-term (investment).
Investors earn through capital appreciation and dividends.
Benefits: High liquidity, transparency, regulated market.
Risks: Market volatility can lead to significant losses.
Example: Buying shares of Reliance Industries and selling after a price rise.
2. Intraday Trading
Overview: Buying and selling stocks within the same trading day.
Key Features:
Traders do not hold positions overnight.
Relies heavily on technical analysis.
Benefits: Quick profits, no overnight risk.
Risks: High leverage increases risk; requires constant monitoring.
Example: Buying Infosys in the morning and selling by afternoon for short-term gains.
3. Futures and Options (Derivatives Trading)
Overview: Contracts whose value is derived from underlying assets like stocks, indices, or commodities.
Key Features:
Futures obligate buying/selling at a fixed date.
Options provide the right, not obligation, to buy/sell.
Benefits: Hedging, leverage, speculation.
Risks: High risk due to leverage; can lead to large losses.
Example: Buying Nifty Call Option to profit from a market rise.
4. Commodity Trading
Overview: Buying and selling commodities such as gold, silver, oil, and agricultural products on MCX or NCDEX.
Key Features:
Includes spot, futures, and options contracts.
Influenced by global demand, supply, and geopolitical factors.
Benefits: Portfolio diversification, inflation hedge.
Risks: Price volatility, geopolitical risks, storage costs (for physical commodities).
Example: Trading crude oil futures anticipating a price surge.
5. Currency Trading (Forex Trading)
Overview: Trading in foreign currency pairs like USD/INR, EUR/INR.
Key Features:
Can be spot or derivative contracts.
Driven by global economic events and RBI policies.
Benefits: High liquidity, global opportunities.
Risks: Exchange rate volatility, leverage risks.
Example: Buying USD against INR expecting INR to weaken.
6. Mutual Fund Trading
Overview: Investing in professionally managed funds that pool money from multiple investors.
Key Features:
Equity, debt, hybrid funds available.
Can be SIP (Systematic Investment Plan) or lump sum.
Benefits: Professional management, diversification, lower risk.
Risks: Returns are market-linked; management fees apply.
Example: Investing in HDFC Equity Fund via monthly SIP.
7. Bond and Debt Securities Trading
Overview: Trading government and corporate bonds, debentures, and fixed-income instruments.
Key Features:
Predictable income through interest payments.
Less volatile than equity markets.
Benefits: Capital preservation, steady returns.
Risks: Interest rate fluctuations, credit risk of issuers.
Example: Buying 10-year government bonds for stable returns.
8. Cryptocurrency Trading
Overview: Buying and selling digital currencies like Bitcoin, Ethereum, and Indian crypto tokens.
Key Features:
Highly volatile and largely unregulated in India.
Includes spot trading and futures trading.
Benefits: Potential for high returns, global market access.
Risks: Extreme volatility, regulatory uncertainty, cyber risks.
Example: Trading Bitcoin on WazirX anticipating a price spike.
9. IPO and Primary Market Trading
Overview: Investing in companies during their Initial Public Offering before they are listed.
Key Features:
Subscription-based allotment via brokers or banks.
Potential for listing gains.
Benefits: Opportunity to buy at a lower price before listing.
Risks: Listing may underperform; market sentiment affects gains.
Example: Applying for LIC IPO shares expecting listing gains.
10. Algorithmic and High-Frequency Trading (HFT)
Overview: Automated trading using computer algorithms to execute orders at high speed.
Key Features:
Relies on pre-set rules, AI, and quantitative models.
Popular among institutional traders and hedge funds.
Benefits: Speed, accuracy, can exploit small price differences.
Risks: Requires technical expertise, market flash crashes possible.
Example: Using algorithmic trading to scalp Nifty futures in milliseconds.
Conclusion
India offers a wide spectrum of trading opportunities for investors and traders—from traditional stock markets to cutting-edge algorithmic and crypto trading. Choosing the right type depends on risk tolerance, capital, time horizon, and knowledge of the market. While equities, derivatives, and commodities dominate in terms of popularity, newer avenues like cryptocurrencies and algorithmic trading are gaining traction rapidly.

Bank Nifty Neowave UpdateNamaskaram Everyone
Welcome to intelligent investor, we provide market insights by synchronising and combining all the price action waves from different time frames and gives you single trend.

USDJPY (Neowave Trading Idea)FX:USDJPY Namaskaram Everyone
Welcome to intelligent investor, we provide market insights by synchronising and combining all the price action waves from different time frames and gives you single trend.
Now Risk Reward is highly favourable
Trading with risk management, that is 1 percent rule with my charts.
How to Read My Charts-

Part 1 Support and Resistance1. Introduction to Options Trading
Options are financial derivatives that give traders the right, but not the obligation, to buy (Call Option) or sell (Put Option) an underlying asset at a pre-decided price (strike price) within a specific time frame. Unlike shares where you own the asset, options provide flexibility to speculate, hedge, or generate income. Options derive their value from underlying assets like stocks, indices, commodities, or currencies, making them versatile but also complex.
2. The Nature of an Option Contract
Each option contract has four key elements:
Underlying Asset (e.g., Reliance stock, Nifty index).
Strike Price (predetermined buy/sell level).
Premium (price paid to buy the option).
Expiration Date (last valid trading day).
This structure allows traders to choose different risk/reward setups, unlike shares where profit and loss move linearly with price.
3. Call Options Explained
A Call Option gives the buyer the right to purchase the underlying asset at the strike price. For example, buying a Nifty 20,000 Call at ₹100 means you expect Nifty to rise above 20,100 (strike + premium). If it rises, profit potential is unlimited, but loss is capped at ₹100 (the premium paid). This asymmetry makes calls powerful for bullish strategies.
4. Put Options Explained
A Put Option gives the buyer the right to sell the underlying asset at the strike price. Example: buying a TCS ₹3500 Put at ₹80 means you profit if TCS falls below ₹3420 (strike – premium). Put buyers use it for bearish bets or hedging existing long positions. Loss is capped to premium, profit grows as price declines.
5. The Role of Option Writers (Sellers)
Every option has two sides: the buyer and the seller (writer). Writers receive the premium but take on significant obligations. A call writer must sell at strike price if exercised; a put writer must buy. Sellers have limited profit (premium received) but potentially unlimited losses (especially in calls). Option writers dominate because most options expire worthless, but the risk is substantial.
6. Intrinsic Value and Time Value
An option’s premium has two parts:
Intrinsic Value (IV): Actual profit if exercised now. Example: Reliance at ₹2600, Call strike at ₹2500 → IV = ₹100.
Time Value (TV): Extra premium due to potential future price movement. Near expiry, TV decays (time decay).
Understanding IV and TV is crucial for identifying overvalued/undervalued options.
7. Option Expiry and Settlements
Options in India (like Nifty, Bank Nifty) have weekly and monthly expiries. Stock options have monthly expiries. On expiry, in-the-money (ITM) options settle in cash (difference between spot and strike). Out-of-the-money (OTM) expire worthless. Expiry days often see volatile moves as traders adjust positions.
8. The Concept of Moneyness
Options are classified by their relation to the spot price:
In the Money (ITM): Strike favorable (e.g., Call strike below spot).
At the Money (ATM): Strike = spot.
Out of the Money (OTM): Strike unfavorable (e.g., Call above spot).
Moneyness influences premium, risk, and probability of profit.
9. Option Premium Pricing Factors
Option premium is influenced by:
Spot Price of the underlying.
Strike Price.
Time to Expiry.
Volatility (Implied & Historical).
Interest Rates and Dividends.
The Black-Scholes model and other pricing models quantify these variables, but in practice, demand-supply and implied volatility dominate.
10. The Greeks – Risk Management Tools
Option traders use Greeks to measure risk:
Delta: Sensitivity to underlying price.
Gamma: Rate of change of Delta.
Theta: Time decay impact.
Vega: Sensitivity to volatility changes.
Rho: Sensitivity to interest rates.
Greeks help traders build and manage complex strategies.

Option trading 1. What Are Options?
Options are financial contracts that give you the right, but not the obligation, to buy or sell an underlying asset (like a stock, index, or commodity) at a fixed price (strike price) within a certain time period.
Call Option → Right to buy the asset.
Put Option → Right to sell the asset.
👉 You pay a premium to purchase the option.
2. Key Terms in Options
Strike Price: The fixed price at which you can buy/sell the asset.
Premium: The cost of buying the option (like an entry fee).
Expiry Date: Last date the option can be exercised.
In the Money (ITM): Option has profit value.
Out of the Money (OTM): Option has no intrinsic profit value.
Lot Size: Options are traded in fixed quantities, not single shares.
3. How Options Work (Example)
Imagine Reliance stock = ₹2,500.
You buy a Call Option with strike = ₹2,600, expiry in 1 month, premium = ₹50.
If Reliance rises to ₹2,700 before expiry:
You can buy at ₹2,600, sell at ₹2,700 → Profit = ₹100 – ₹50 premium = ₹50.
If Reliance stays below ₹2,600, you don’t exercise → Loss = Premium ₹50.
This way, risk is limited to the premium, but potential profit can be much larger.
4. Types of Option Trading
Buying Calls/Puts → Simple strategy, limited risk.
Writing (Selling) Options → You receive premium but face higher risk.
Spreads & Strategies → Combining multiple options to control risk/reward. Examples:
Bull Call Spread
Bear Put Spread
Straddle
Iron Condor
5. Why Traders Use Options?
Hedging → To protect against losses in existing positions.
Speculation → To bet on price movements with limited capital.
Leverage → Small premium controls large value of stock.
Income → Option sellers earn premium regularly.
6. Pros & Cons of Options
✅ Advantages:
Limited risk (for buyers).
Lower capital needed than buying stocks directly.
Flexible strategies in rising, falling, or sideways markets.
❌ Risks/Challenges:
Complex compared to stock trading.
Sellers have unlimited risk.
Time decay → Options lose value as expiry nears.
👉 In short: Option trading is a flexible and powerful tool, but it requires solid knowledge of risk, pricing, and strategies. Beginners usually start by buying simple calls or puts before moving to advanced spreads and hedging techniques.

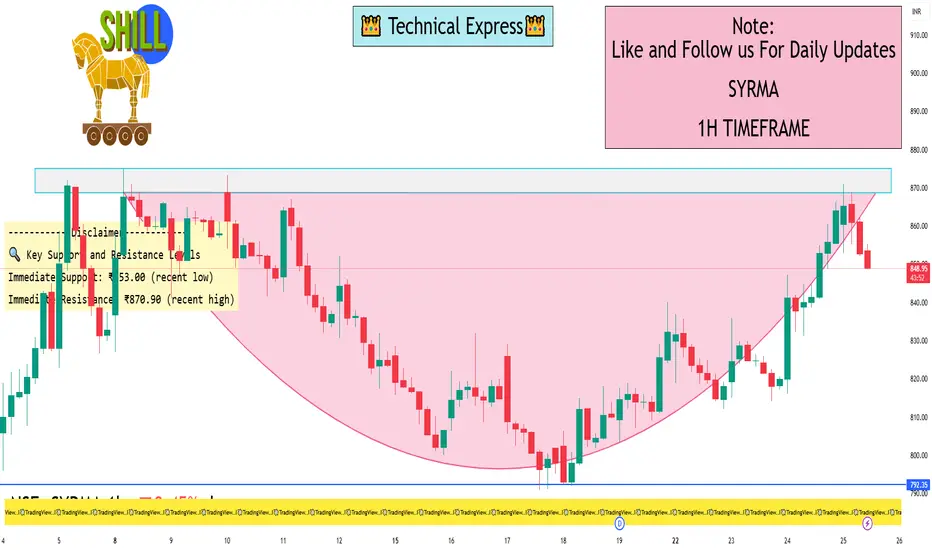
SYRMA 1 Hour View📈 1-Hour Time Frame Technical Overview
Based on recent intraday data, here’s a snapshot of SYRMA’s 1-hour technical indicators:
Relative Strength Index (RSI): 67.55, indicating bullish momentum.
Moving Average Convergence Divergence (MACD): 26.80, suggesting upward momentum.
Average Directional Index (ADX): 25.47, reflecting a moderately strong trend.
Stochastic Oscillator: 56.86, showing no overbought or oversold conditions.
Supertrend: ₹765.70, indicating a bullish trend.
Parabolic SAR (PSAR): ₹792.41, supporting the bullish trend.
Chaikin Money Flow (CMF): 0.110, suggesting accumulation of shares.
These indicators collectively point towards a bullish short-term trend for SYRMA.
🔍 Key Support and Resistance Levels
Immediate Support: ₹853.00 (recent low)
Immediate Resistance: ₹870.90 (recent high)
A breakout above ₹870.90 could signal further upside potential, while a dip below ₹853.00 might suggest a pullback.
For real-time intraday analysis on a 1-hour time frame, you can utilize the following platforms:
TradingView: Offers a comprehensive technical analysis overview, including indicators like RSI, MACD, and moving averages
Chartink: Provides customizable candlestick charts with various time frames and technical indicators
Investing.com: Features candlestick charts with pattern recognition and technical indicators
TopStockResearch: Delivers interactive charts with real-time updates and technical analysis tools