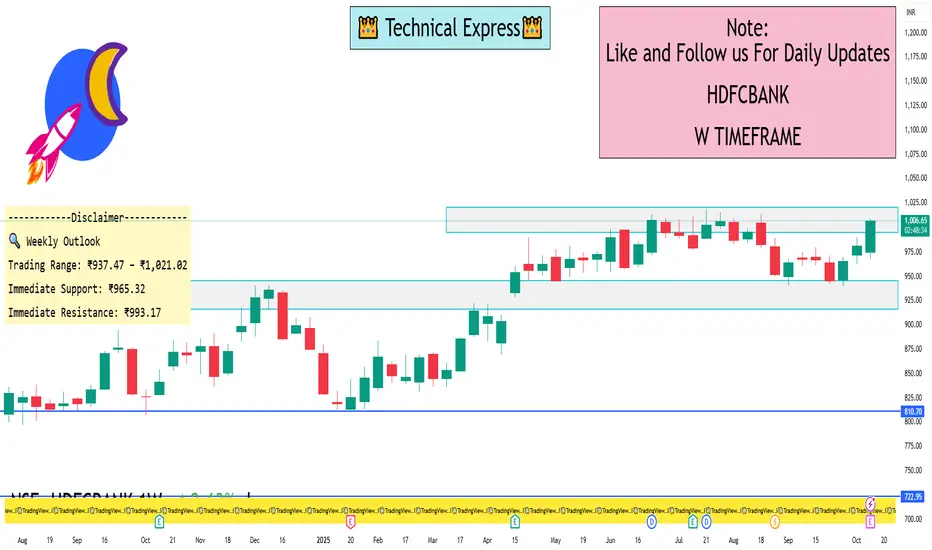
HDFC Bank 1 Week View 📈 Key Technical Levels for the Week
Resistance Levels:
R1: ₹1,005.43
R2: ₹1,021.02
R3: ₹1,034.00
Support Levels:
S1: ₹965.32
S2: ₹949.73
S3: ₹937.47
A close above ₹1,005.43 could indicate a breakout, while a drop below ₹965.32 may signal a potential reversal.
📊 Technical Indicators
RSI (14): 77.88 — Overbought, suggesting potential for a pullback.
MACD: Positive, indicating bullish momentum.
CCI: 202.29 — Overbought, aligning with the RSI reading.
ADX: 32.18 — Bullish trend strength.
The stock is trading above its 20-day and 50-day moving averages, indicating a bullish trend.
🔍 Weekly Outlook
Trading Range: ₹937.47 – ₹1,021.02
Immediate Support: ₹965.32
Immediate Resistance: ₹993.17
A close above ₹1,005.43 could lead to further gains, while a close below ₹965.32 may suggest a bearish reversal.
Tradingidea
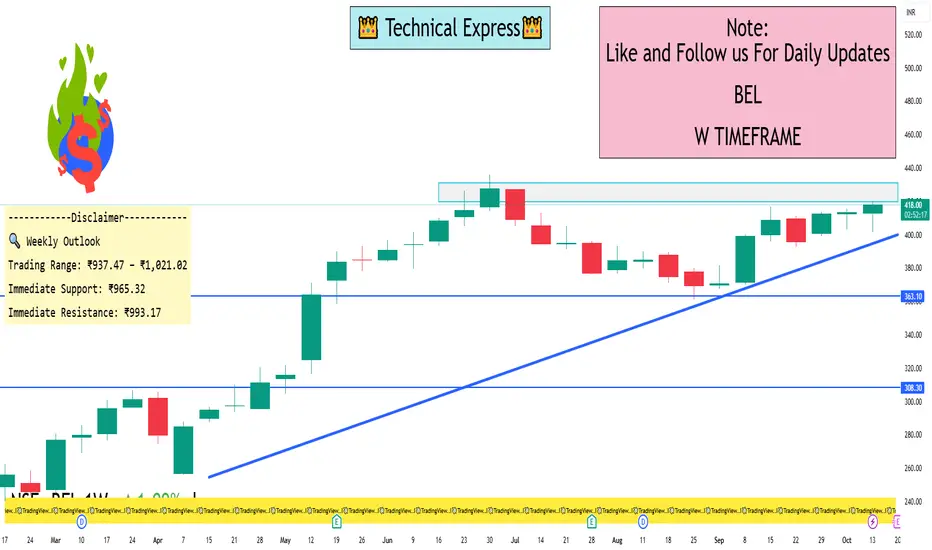
BEL 1 Day View 📊 Daily Support & Resistance Levels
Support Levels: ₹409.67 (S2), ₹407.53 (S1)
Resistance Levels: ₹413.32 (Pivot), ₹416.97 (R2), ₹419.57 (R3)
The current price is trading above the central pivot point, indicating a potential continuation of the upward trend.
🔧 Technical Indicators
RSI (14): 73.1 — Approaching overbought territory, suggesting strong bullish momentum.
MACD: +2.23 — Positive and above the signal line, reinforcing the buy signal.
ADX (14): 43.07 — Indicates a strong trend with increasing momentum.
Stochastic RSI: 100 — Overbought, but can remain in this zone during strong trends.
Williams %R: -7.69 — In overbought territory, aligning with the bullish trend.
📈 Moving Averages
MA5: 416.19
MA10: 413.97
MA20: 410.59
MA50: 409.43
MA100: 408.19
MA200: 402.58
All moving averages are in a bullish alignment, supporting the upward momentum.
📌 Summary
BEL is currently exhibiting a strong bullish trend on the daily timeframe, with prices above key support and resistance levels. Technical indicators such as RSI, MACD, and ADX confirm the strength of the trend. Traders should monitor the price action around the resistance levels for potential breakout opportunities.
Types of Trading Strategies1. Technical Trading Strategies
Technical trading strategies rely on historical price and volume data to forecast future price movements. Traders using technical analysis focus on charts, indicators, and patterns. These strategies assume that all relevant information is already reflected in the price.
1.1 Trend Following Strategies
Trend following is based on the premise that prices tend to move in persistent trends. Traders identify upward or downward trends and align their trades with the direction of the trend.
Tools Used: Moving averages, trendlines, MACD, and Average Directional Index (ADX).
Example: A trader buys a stock when its 50-day moving average crosses above the 200-day moving average (golden cross) and sells when the reverse occurs (death cross).
1.2 Momentum Trading
Momentum trading involves identifying stocks or assets that are moving strongly in one direction and trading them in the same direction, anticipating the trend will continue.
Tools Used: Relative Strength Index (RSI), Moving Average Convergence Divergence (MACD), and volume analysis.
Example: Buying a stock with strong upward momentum after it breaks past a resistance level and selling when momentum slows.
1.3 Mean Reversion Strategies
Mean reversion strategies are based on the assumption that asset prices fluctuate around a stable mean or average. Traders look for overbought or oversold conditions and take positions expecting the price to revert to its mean.
Tools Used: Bollinger Bands, RSI, and standard deviation channels.
Example: If a stock’s price falls significantly below its 20-day moving average, a mean reversion trader may buy, expecting it to revert to the average.
1.4 Breakout Trading
Breakout strategies focus on assets that are breaking through established support or resistance levels. A breakout indicates the potential start of a new trend, often accompanied by high volume.
Tools Used: Support/resistance lines, price patterns like triangles or rectangles, and volume indicators.
Example: A trader buys a stock when it breaks above a previous high resistance level with significant trading volume.
1.5 Scalping
Scalping is a short-term strategy aimed at making small profits from minor price movements, often executed within seconds or minutes.
Tools Used: Real-time charts, level 2 quotes, order flow analysis, and very short-term indicators.
Example: A trader takes advantage of tiny spreads in highly liquid stocks to make dozens of trades per day.
2. Fundamental Trading Strategies
Fundamental trading strategies are based on analyzing an asset’s intrinsic value. Traders assess financial statements, economic indicators, and market conditions to identify mispriced securities.
2.1 Value Investing
Value investing seeks to buy undervalued stocks that are trading below their intrinsic value and hold them until the market corrects the price.
Tools Used: Price-to-Earnings (P/E) ratio, Price-to-Book (P/B) ratio, and Discounted Cash Flow (DCF) analysis.
Example: Buying a company with strong fundamentals but a temporarily low stock price due to market overreaction.
2.2 Growth Investing
Growth investing focuses on companies expected to grow faster than the overall market. Investors prioritize potential future earnings over current valuation.
Tools Used: Revenue growth, earnings growth, and market potential analysis.
Example: Investing in technology startups that have innovative products and high projected earnings growth.
2.3 Dividend Investing
Dividend investors focus on companies that regularly pay dividends. The strategy provides a stable income stream and long-term capital appreciation.
Tools Used: Dividend yield, payout ratio, and dividend growth history.
Example: Investing in well-established consumer goods companies with a strong dividend track record.
2.4 Economic Indicator-Based Trading
Some traders base decisions on macroeconomic factors such as GDP growth, inflation, unemployment, or interest rates.
Example: Buying government bonds during periods of falling interest rates to benefit from price appreciation.
3. Quantitative and Algorithmic Strategies
Quantitative strategies use mathematical models and algorithms to identify trading opportunities. These strategies rely heavily on data analysis, computing power, and statistical models.
3.1 Statistical Arbitrage
Statistical arbitrage involves exploiting pricing inefficiencies between correlated securities. Traders use statistical models to identify temporary mispricing.
Example: If two historically correlated stocks diverge, the trader may short the overperforming stock and buy the underperforming one, expecting convergence.
3.2 Algorithmic Trading
Algorithmic trading executes trades automatically based on pre-set rules, reducing emotional bias and increasing speed.
Tools Used: High-frequency trading platforms, quantitative models, and real-time market data feeds.
Example: An algorithm that executes trades when a stock crosses a specific moving average or price threshold.
3.3 High-Frequency Trading (HFT)
HFT uses extremely fast computers to exploit tiny price discrepancies, executing thousands of trades in milliseconds.
Example: Profiting from price differences between multiple exchanges for the same security.
4. Sentiment and Event-Driven Strategies
These strategies focus on market psychology and external events rather than technical or fundamental analysis.
4.1 News-Based Trading
Traders react to market-moving news, such as earnings announcements, geopolitical events, or economic data releases.
Example: Buying a stock immediately after a positive earnings surprise or selling after a negative announcement.
4.2 Social Sentiment Trading
This approach analyzes social media, forums, or news sentiment to gauge market sentiment.
Tools Used: Sentiment analysis algorithms, natural language processing (NLP), and trend monitoring tools.
Example: A surge in positive tweets about a company can trigger a buy signal for a sentiment trader.
4.3 Event-Driven Strategies
Event-driven strategies focus on corporate events like mergers, acquisitions, spin-offs, or bankruptcies.
Example: Buying stock in a company being acquired at a discount to the announced buyout price.
5. Hybrid Strategies
Many traders combine multiple approaches to diversify risk and improve returns. Hybrid strategies blend technical, fundamental, and sentiment-driven approaches.
5.1 Swing Trading with Fundamentals
Swing traders may combine chart patterns with fundamental catalysts to increase the probability of a successful trade.
Example: Buying a stock that is technically breaking out and has strong upcoming earnings.
5.2 Quantitative Trend Following
Some traders use quantitative models to identify trends and automate trades, merging trend-following principles with algorithmic execution.
6. Risk Management Across Strategies
Regardless of the strategy, risk management is a critical component. Traders typically use:
Stop-loss orders: Automatically exit a trade when it reaches a predetermined loss level.
Position sizing: Adjusting trade size based on risk tolerance.
Diversification: Spreading capital across multiple assets or strategies to reduce overall risk.
Leverage control: Avoiding excessive leverage that can amplify losses.
Effective risk management ensures that even a series of losing trades does not decimate capital, which is essential for long-term survival in trading.
7. Choosing the Right Strategy
The best trading strategy depends on a trader’s goals, market knowledge, and available resources:
Time Commitment: Scalping requires constant monitoring, whereas long-term value investing is more passive.
Risk Appetite: Aggressive strategies like high-frequency trading involve higher risk, while dividend investing is relatively conservative.
Market Type: Certain strategies work better in trending markets (trend following), while others excel in range-bound markets (mean reversion).
Skill Level: Quantitative and algorithmic strategies require coding and statistical skills, while fundamental analysis needs strong research capabilities.
8. Conclusion
Trading strategies are diverse and adaptable, ranging from purely technical to fundamental, quantitative, and event-driven approaches. Each has unique advantages and risks, and success often requires combining multiple strategies with disciplined risk management. Traders must continuously evaluate market conditions, adapt their strategies, and maintain emotional control to thrive in the dynamic world of trading. Understanding the wide spectrum of strategies empowers traders to align their approach with personal objectives, market conditions, and available resources, thereby enhancing both consistency and profitability.
Bonds and Fixed Income Trading in the Indian MarketIntroduction
Bonds and fixed-income instruments form the backbone of the debt market, serving as crucial avenues for capital formation and risk management. Unlike equities, which represent ownership in a company, bonds are debt instruments issued by governments, corporations, or financial institutions, providing fixed returns over a predetermined period. In India, the fixed-income market has evolved substantially over the past decades, driven by regulatory reforms, growing investor awareness, and the need for diversified investment options. Understanding bonds and fixed-income trading is essential for investors, fund managers, and institutions aiming to manage interest rate risk, generate income, and balance investment portfolios.
Understanding Bonds
A bond is essentially a loan made by an investor to an issuer, who promises to pay interest (coupon) at fixed intervals and return the principal amount on maturity. Bonds vary based on several parameters:
Issuer Type:
Government Bonds: Issued by the Central or State Governments. Examples include Treasury Bills (T-Bills), Government Securities (G-Secs), and State Development Loans (SDLs).
Corporate Bonds: Issued by companies to raise capital. These can be investment-grade or high-yield bonds depending on the issuer’s creditworthiness.
Municipal Bonds: Issued by urban local bodies for infrastructure projects.
Tenure: Bonds can be short-term (less than 1 year), medium-term (1–5 years), or long-term (5 years and above).
Coupon Type:
Fixed Coupon Bonds: Pay a predetermined interest rate.
Floating Rate Bonds: Coupon varies with benchmark rates like MIBOR or RBI repo rates.
Zero-Coupon Bonds: Sold at a discount and redeemed at face value; no periodic interest is paid.
Credit Rating: Rating agencies like CRISIL, ICRA, CARE, and Fitch assess creditworthiness. Higher-rated bonds carry lower default risk but offer lower yields.
Indian Bond Market Structure
The Indian bond market can be broadly divided into government securities market and corporate debt market.
Government Securities Market
The government securities market is the largest segment of the Indian debt market. The Reserve Bank of India (RBI) is the primary regulator and issuer of government securities. Instruments include:
Treasury Bills (T-Bills): Short-term securities issued at a discount with maturities of 91, 182, or 364 days. They are zero-coupon instruments and highly liquid.
Government Bonds (G-Secs): Medium- and long-term debt instruments with fixed or floating coupons. They fund fiscal deficits and infrastructure projects.
State Development Loans (SDLs): Issued by state governments, these bonds are similar to G-Secs but carry slightly higher yields due to state-specific credit risk.
Corporate Debt Market
The corporate bond market in India has witnessed significant growth, though it remains smaller than the government securities market. Key features include:
Issued by public and private sector companies.
Can be listed on exchanges like NSE and BSE or traded over-the-counter (OTC).
Includes instruments like non-convertible debentures (NCDs), commercial papers (CPs), and perpetual bonds.
The corporate bond market allows companies to raise long-term funds efficiently while offering investors higher yields compared to government securities, albeit with higher risk.
Participants in the Indian Bond Market
The Indian bond market comprises a variety of participants:
Retail Investors: Individuals seeking stable returns, typically investing through government bonds, NCDs, or mutual funds.
Institutional Investors: Insurance companies, pension funds, mutual funds, and banks. They dominate the market due to large capital requirements.
Foreign Institutional Investors (FIIs): Invest in Indian government and corporate bonds, subject to regulatory approvals. Their participation adds liquidity and depth to the market.
Brokers and Dealers: Facilitate buying and selling of bonds on exchanges and OTC platforms.
Regulatory Authorities: RBI and SEBI regulate issuance, trading, and settlement of bonds to maintain market integrity.
Bond Pricing and Yield
Understanding bond pricing and yields is fundamental for trading. The price of a bond depends on the present value of its future cash flows discounted at prevailing market interest rates. Key concepts include:
Yield to Maturity (YTM): Total return expected if the bond is held until maturity.
Current Yield: Annual coupon divided by current market price.
Price-Yield Relationship: Bond prices move inversely to interest rates; when rates rise, bond prices fall, and vice versa.
In India, yield curves are published regularly by the RBI, showing the relationship between bond yields and maturities. These curves help investors make informed trading decisions.
Trading Mechanisms in India
Bond trading in India occurs through primary and secondary markets.
Primary Market
In the primary market, bonds are issued for the first time.
Government securities are auctioned by the RBI using competitive and non-competitive bidding.
Corporate bonds are issued through private placements or public offerings, often under SEBI regulations.
Secondary Market
Secondary trading involves buying and selling existing bonds.
For government securities, trading occurs on platforms like the NSE NDS-OM (Negotiated Dealing System – Order Matching) and OTC markets.
Corporate bonds are traded over-the-counter or on exchanges such as NSE and BSE.
The secondary market ensures liquidity, enabling investors to adjust portfolios according to interest rate movements or credit risk perceptions.
Risk Factors in Bond Investing
Even though bonds are considered safer than equities, they carry certain risks:
Interest Rate Risk: Price of bonds fluctuates with changes in market interest rates. Long-term bonds are more sensitive.
Credit Risk: Risk of issuer default. High-yield corporate bonds carry higher credit risk.
Liquidity Risk: Some bonds, especially corporate and municipal bonds, may be hard to sell quickly without impacting the price.
Reinvestment Risk: Risk of reinvesting coupons at lower rates when interest rates fall.
Inflation Risk: Inflation erodes real returns, particularly on fixed-coupon instruments.
Role of Technology and Exchanges
Technology has transformed bond trading in India, improving transparency, efficiency, and accessibility. Key developments include:
Electronic Trading Platforms: NSE NDS-OM for government securities and BSE’s bond platform for corporate bonds.
Real-Time Price Discovery: Investors can view live bid-ask spreads, yields, and volumes.
Settlement Systems: Clearing corporations like CCIL ensure efficient settlement and reduce counterparty risk.
These innovations have made trading safer and more efficient, encouraging greater participation from retail and institutional investors.
Regulatory Framework
The bond market in India is highly regulated to ensure investor protection and market stability.
Reserve Bank of India (RBI):
Manages issuance and trading of government securities.
Implements monetary policy, influencing interest rates and liquidity.
Securities and Exchange Board of India (SEBI):
Regulates issuance and trading of corporate bonds.
Ensures transparency, disclosure, and fair practices in the market.
Credit Rating Agencies: Assess the creditworthiness of issuers to help investors make informed decisions.
Regulations have promoted the growth of a more transparent and efficient market over the last two decades.
Investment Strategies in Bonds
Investors adopt different strategies based on their risk appetite, time horizon, and market outlook:
Buy and Hold: Investors purchase bonds and hold them until maturity to earn stable coupon payments.
Trading on Yield Movements: Active traders buy bonds when interest rates are high and sell when rates fall.
Laddering Strategy: Investing in bonds with staggered maturities to reduce reinvestment and interest rate risks.
Credit Diversification: Combining government, corporate, and high-yield bonds to balance risk and return.
Bond mutual funds and ETFs are also popular instruments for retail investors seeking diversification and professional management.
Challenges and Future Outlook
Despite steady growth, the Indian bond market faces certain challenges:
Limited Retail Participation: High minimum investment amounts and complexity deter retail investors.
Corporate Bond Liquidity: Secondary market liquidity for corporate bonds remains lower than for government securities.
Interest Rate Volatility: Rapid policy changes can impact yields and bond prices.
However, the outlook is positive due to:
Increased FII participation in government and corporate bonds.
Growing awareness of fixed-income products among retail investors.
Technological innovations improving market access and efficiency.
Government initiatives like the Bharat Bond ETF, which allow retail investors to access high-quality corporate bonds.
Conclusion
Bonds and fixed-income instruments play a vital role in India’s financial ecosystem, providing stable income, risk diversification, and capital market depth. The Indian market has matured over the years, offering a variety of instruments for investors with different risk appetites. While challenges like liquidity constraints and interest rate sensitivity remain, regulatory reforms, technological advancements, and increasing investor awareness are strengthening the market. For both individual and institutional investors, understanding the dynamics of bond pricing, yield, risk factors, and trading mechanisms is essential to effectively navigate the Indian fixed-income market. As India’s economy continues to grow, the fixed-income market is expected to expand further, offering new opportunities for investors seeking stability and returns in a diversified portfolio.

Importance of Understanding Market Fundamentals1. Definition of Market Fundamentals
Market fundamentals refer to the core economic, financial, and quantitative factors that influence the price and value of financial instruments. In equities, fundamentals typically include revenue, earnings, debt levels, and management quality. In commodities, supply and demand dynamics, production costs, geopolitical events, and seasonal trends play a pivotal role. For currencies, factors like interest rates, inflation, trade balances, and central bank policies dominate price behavior. Understanding these elements provides insight into why prices move in a certain direction and helps participants make informed decisions rather than relying solely on market sentiment or speculation.
2. Informed Investment Decisions
Investing without understanding market fundamentals is akin to navigating a stormy sea without a compass. Fundamentals provide the analytical foundation for evaluating the intrinsic value of an asset. For example, in equity markets, price-to-earnings (P/E) ratios, return on equity (ROE), and earnings growth rates help investors assess whether a stock is overvalued or undervalued. Similarly, commodity traders examine production data, inventory levels, and global consumption patterns to gauge potential price trends. By relying on fundamentals, investors can make decisions grounded in logic and data, rather than reacting impulsively to short-term price fluctuations.
3. Risk Management and Protection Against Volatility
Financial markets are inherently volatile, and prices can swing dramatically due to economic, political, or social developments. Understanding market fundamentals helps participants anticipate potential risks and adopt strategies to mitigate them. For instance, if an investor recognizes that rising interest rates may depress stock valuations, they can adjust their portfolio allocation to minimize losses. In commodities, awareness of seasonal production cycles and geopolitical risks can prevent exposure to adverse price movements. A strong grasp of fundamentals enables participants to develop contingency plans, hedge their positions, and navigate uncertainty with confidence.
4. Long-Term Investment Strategy
While technical analysis can be effective for short-term trading, long-term investing heavily relies on fundamentals. Investors focused on building wealth over years or decades benefit from understanding the underlying economic health of a company, sector, or country. For example, an investor considering an emerging market must evaluate GDP growth, political stability, inflation trends, and currency strength to make a prudent decision. Fundamental analysis allows investors to identify undervalued assets with growth potential, which can outperform the market over the long run. In essence, understanding fundamentals aligns investment choices with sustainable economic realities rather than temporary market hype.
5. Understanding Market Cycles
Markets operate in cycles influenced by macroeconomic factors such as inflation, interest rates, employment levels, and consumer sentiment. Recognizing these cycles is crucial for effective timing and strategy. For instance, during an economic expansion, stocks and commodities typically rise due to increased demand and corporate profitability. Conversely, during recessions, defensive assets like bonds, gold, or utilities may outperform. By analyzing market fundamentals, participants can anticipate cyclical patterns, position their portfolios accordingly, and capitalize on opportunities while minimizing losses during downturns.
6. Identification of Investment Opportunities
Market fundamentals serve as a powerful tool for spotting profitable opportunities. By studying supply-demand dynamics, global economic trends, and sector-specific developments, investors can identify assets poised for growth. For example, a surge in electric vehicle adoption can signal increased demand for lithium and cobalt, guiding commodity investors toward related markets. Similarly, technological innovation in healthcare or AI may indicate potential winners in the stock market. Without an understanding of these fundamentals, such opportunities may go unnoticed or be exploited poorly, leading to suboptimal returns.
7. Behavioral Discipline and Emotional Control
Emotions such as fear and greed often drive irrational decision-making in financial markets. Market participants frequently react impulsively to price volatility, rumors, or news headlines. A strong grasp of fundamentals instills discipline by providing a rational framework for evaluating opportunities and risks. When an investor understands the intrinsic value of an asset, they are less likely to panic during market dips or chase overpriced securities during rallies. This emotional control is critical for consistent performance and long-term success in the markets.
8. Adapting to Global Economic Trends
In today’s interconnected world, local markets are influenced by global events. Trade policies, geopolitical tensions, currency fluctuations, and international interest rates can affect asset prices worldwide. Understanding market fundamentals enables participants to interpret these global trends and adjust strategies accordingly. For instance, a rise in crude oil prices due to Middle Eastern tensions may impact not only energy companies but also sectors dependent on transportation or manufacturing. Traders and investors who comprehend these linkages can position themselves advantageously in response to global developments.
9. Enhanced Analytical Skills
Studying market fundamentals cultivates analytical thinking and critical reasoning. Investors learn to interpret financial statements, macroeconomic reports, and industry data to form actionable insights. These skills are transferable across different asset classes and markets, allowing participants to adapt to evolving financial landscapes. Furthermore, the ability to analyze fundamentals objectively reduces reliance on hearsay or speculative tips, empowering investors to take responsibility for their decisions.
10. Foundation for Technical Analysis
While technical analysis focuses on price patterns and market psychology, it becomes far more effective when combined with fundamental understanding. Knowledge of the underlying factors driving price movements provides context to technical signals. For example, a breakout in a stock chart may be more meaningful if supported by strong earnings growth or favorable industry trends. Conversely, ignoring fundamentals may lead to misinterpretation of technical patterns and result in costly mistakes. Integrating fundamental and technical analysis creates a holistic approach that maximizes the likelihood of successful trades.
11. Navigating Uncertainty and Market Crises
Markets are often affected by unexpected events such as financial crises, political upheavals, natural disasters, or pandemics. During such periods, prices may deviate significantly from historical norms. Investors who understand market fundamentals can differentiate between short-term shocks and long-term value, preventing panic-induced decisions. For instance, during the 2008 financial crisis, those who focused on the fundamental health of companies were able to identify undervalued stocks and make profitable investments while others succumbed to fear-driven selling.
12. Practical Applications Across Asset Classes
Understanding market fundamentals is not limited to stocks; it applies across all asset classes. In commodities, evaluating production, storage, consumption, and weather patterns is essential. In forex markets, analyzing interest rate differentials, inflation trends, and trade balances informs currency valuation. In bonds, credit ratings, yield curves, and monetary policies determine risk and return. Real estate investors consider macroeconomic growth, demographic trends, and regulatory policies. Across all these sectors, fundamental analysis forms the backbone of strategic decision-making, highlighting its universal importance.
13. Contributing to Financial Literacy
Finally, mastering market fundamentals contributes to broader financial literacy. Individuals become better equipped to understand economic news, corporate reports, and investment opportunities. This knowledge promotes responsible financial behavior, enabling informed decision-making in personal finance, retirement planning, and wealth management. Beyond individual benefits, widespread financial literacy fosters a more efficient and stable market, as participants base decisions on informed analysis rather than speculation and rumor.
Conclusion
In conclusion, understanding market fundamentals is indispensable for anyone participating in financial markets. It equips investors and traders with the knowledge to make informed decisions, manage risk, and develop long-term strategies. Fundamentals provide a lens to interpret market cycles, identify investment opportunities, and maintain discipline amid volatility. Moreover, they enhance analytical skills, facilitate integration with technical analysis, and enable navigation through global economic trends and crises. Across all asset classes, a deep comprehension of market fundamentals is the foundation upon which sustainable financial success is built. Ignoring these principles leaves participants vulnerable to speculation, emotional decision-making, and missed opportunities, whereas mastery of fundamentals fosters confidence, prudence, and consistent performance in the ever-evolving world of financial markets.
Introduction to MCX Commodity Trading1. What is Commodity Trading?
Commodity trading refers to the buying and selling of raw materials or primary products, typically classified into two broad categories:
Hard Commodities: Natural resources that are mined or extracted, such as gold, silver, crude oil, and copper.
Soft Commodities: Agricultural products or livestock, including sugar, cotton, wheat, and coffee.
Unlike equities, commodities are traded for their intrinsic value and are influenced by supply-demand dynamics, geopolitical factors, and global economic trends. Trading commodities allows investors not only to profit from price movements but also to hedge against inflation and currency fluctuations.
2. Overview of MCX (Multi Commodity Exchange)
The Multi Commodity Exchange of India Limited (MCX) is the largest commodity derivatives exchange in India. Established in 2003, MCX provides a platform for trading commodity futures, ensuring transparency, liquidity, and regulatory oversight. Key features of MCX include:
Diverse Commodity Offerings: MCX trades in bullion, metals, energy, and agricultural commodities.
Futures Contracts: Investors primarily trade in futures contracts, which are standardized agreements to buy or sell a specific quantity of a commodity at a predetermined price on a future date.
Regulated Environment: MCX is regulated by the Securities and Exchange Board of India (SEBI), ensuring market integrity and investor protection.
Efficient Settlement System: MCX employs secure clearing and settlement mechanisms, reducing counterparty risk.
By providing a robust marketplace, MCX has played a critical role in bringing Indian commodity trading in line with global standards.
3. Understanding Commodity Futures
Unlike spot trading, where commodities are bought or sold for immediate delivery, futures contracts allow traders to speculate on price movements without necessarily owning the physical commodity. Key components of a futures contract include:
Contract Size: Defines the quantity of the commodity covered.
Expiry Date: The date on which the contract is settled.
Lot Size: Standardized unit of trading to maintain market uniformity.
Margin Requirement: Traders must deposit a percentage of the contract value as margin, which ensures commitment and reduces default risk.
Example:
If a trader buys a gold futures contract at ₹50,000 per 10 grams for delivery in June, the trader is obligated to purchase 10 grams of gold at that price in June. However, most traders close their positions before expiry to avoid physical delivery.
4. Categories of Commodities on MCX
MCX offers trading in several categories:
4.1 Bullion
Gold and Silver are the most traded commodities.
Prices are influenced by global demand, currency fluctuations, inflation, and geopolitical tensions.
4.2 Base Metals
Commodities such as copper, aluminum, zinc, and nickel.
Prices are affected by industrial demand, mining output, and global economic conditions.
4.3 Energy
Includes crude oil, natural gas, and other petroleum products.
Heavily influenced by global supply-demand, OPEC policies, and geopolitical factors.
4.4 Agricultural Commodities
Examples: Cotton, cardamom, chana, and sugar.
Influenced by monsoon patterns, crop yields, government policies, and international trade.
5. Participants in MCX Commodity Trading
Understanding the key players helps in interpreting market movements:
Hedgers: Typically producers or consumers of commodities who aim to reduce the risk of price fluctuations.
Example: A gold jeweler hedging against rising gold prices.
Speculators: Traders who seek to profit from price changes without intending to take physical delivery.
Arbitrageurs: Exploit price differences between commodities on different exchanges or in spot versus futures markets.
Institutional Investors: Banks, mutual funds, and hedge funds often participate to diversify portfolios.
6. Advantages of Trading on MCX
Trading on MCX provides multiple benefits:
Transparency: Prices and volumes are publicly available, reducing market manipulation.
Liquidity: High trading volumes make entering and exiting positions easier.
Hedging Opportunities: Producers and consumers can lock in prices, mitigating risk.
Leverage: Traders can control large contract values with relatively small margin deposits.
Diversification: Exposure to commodities reduces portfolio dependency on equities and bonds.
Price Discovery: MCX plays a key role in determining fair market prices through supply-demand mechanisms.
7. Risks in Commodity Trading
Despite its opportunities, commodity trading involves significant risks:
Market Risk: Prices can fluctuate sharply due to global events, weather, or policy changes.
Leverage Risk: While margin trading amplifies profits, it also magnifies losses.
Liquidity Risk: Some commodities may have lower trading volumes, making it difficult to exit positions.
Regulatory Risk: Changes in government policies, taxes, or import/export duties can impact prices.
Operational Risk: Technical glitches, delays, or errors in trading platforms may affect execution.
A prudent trader combines technical, fundamental, and geopolitical analysis to navigate these risks.
8. How to Start Trading on MCX
Step 1: Open a Trading Account
Investors need to open a commodity trading account with a registered broker. Required documents include PAN card, Aadhaar, bank proof, and KYC verification.
Step 2: Choose Commodities
Select commodities based on market research, risk appetite, and trading strategies.
Step 3: Deposit Margin
A minimum margin, defined as a percentage of the contract value, must be deposited to initiate trades.
Step 4: Place Orders
Orders can be placed using online trading platforms, specifying the quantity, contract month, and price.
Step 5: Monitor Positions
Regularly track market movements, news, and global events that influence commodity prices.
Step 6: Close Positions
Traders can either settle at contract expiry or close positions early to book profits or limit losses.
9. Trading Strategies for MCX Commodities
Successful trading involves strategy and discipline. Common approaches include:
9.1 Technical Analysis
Uses historical price patterns, charts, and indicators like moving averages, RSI, and MACD.
Helps identify entry and exit points.
9.2 Fundamental Analysis
Examines supply-demand factors, geopolitical events, government policies, and global trends.
Particularly important for agricultural commodities and energy markets.
9.3 Hedging
Aims to minimize potential losses for businesses exposed to commodity price fluctuations.
Example: A farmer selling wheat futures to secure prices before harvest.
9.4 Arbitrage
Exploits price differences between spot and futures markets or across exchanges.
Requires quick execution and access to multiple trading venues.
10. Factors Influencing Commodity Prices
Commodity prices are driven by multiple interrelated factors:
Global Economic Conditions: Growth or slowdown impacts industrial metals, energy, and demand for commodities.
Currency Movements: Commodities priced in USD are sensitive to exchange rate fluctuations.
Geopolitical Events: Wars, sanctions, and political instability can create volatility.
Weather and Climate: Agricultural commodities are heavily dependent on rainfall, monsoons, and climate change.
Government Policies: Subsidies, import/export restrictions, and price controls affect domestic prices.
Market Speculation: Traders’ sentiment and speculative positions can influence short-term price movements.
11. Regulatory Framework
MCX operates under SEBI regulations and follows strict compliance norms:
Position Limits: Prevent market manipulation by limiting maximum allowable contracts.
Margin Requirements: Ensure traders have sufficient funds to cover potential losses.
Contract Specifications: Standardize trading to maintain uniformity.
Dispute Resolution: Provides mechanisms for grievances and market disputes.
This robust framework enhances investor confidence and promotes fair trading.
12. Technology in MCX Trading
Modern commodity trading relies heavily on technology:
Online Trading Platforms: Allow seamless access to live market data and order execution.
Algorithmic Trading: High-frequency and automated trading based on pre-set rules.
Risk Management Systems: Track margin requirements, position limits, and real-time exposure.
Mobile Applications: Provide flexibility to trade and monitor positions on the go.
Technology has made MCX accessible to both retail and institutional traders.
13. Conclusion
MCX commodity trading offers an exciting avenue for diversification, profit-making, and hedging against market uncertainties. By understanding the nuances of futures contracts, market dynamics, and trading strategies, investors can navigate the complex world of commodities effectively. While risks exist, informed decision-making, disciplined strategies, and continuous learning can make commodity trading a rewarding endeavor.
For beginners, it is recommended to start with smaller positions, focus on learning market patterns, and gradually expand exposure. For professionals, leveraging advanced analytical tools and global insights can enhance profitability. Ultimately, MCX trading embodies a blend of knowledge, strategy, and market acumen, opening doors to opportunities that extend beyond traditional investment avenues.
Part 1 Ride The Big Moves Definition of Option Trading
Option trading is a financial strategy where traders buy or sell contracts that give them the right, but not the obligation, to buy or sell an underlying asset—such as stocks, indices, or commodities—at a specific price before a set date. These contracts are called “options.” The two main types are call options (right to buy) and put options (right to sell). Unlike owning the asset directly, options provide flexibility, allowing traders to profit from both rising and falling markets while limiting risk to the premium paid for the option.

Part 2 Support and ResistanceOptions in Portfolio Diversification:
Options help investors diversify and stabilize their portfolios by balancing risk and return. For instance, adding protective puts can shield against downside risk, while covered calls can generate steady income from owned stocks. These strategies reduce dependence on market direction and create non-linear payoffs, which can improve portfolio resilience during volatile periods. Options can also be used to replicate other financial positions or adjust exposure without buying or selling the underlying asset directly. This makes them powerful tools for strategic asset allocation, allowing investors to achieve customized financial goals with controlled levels of risk.

Part 1 Support and Resistance Role of Option Writers (Sellers):
Option writers, or sellers, play a crucial role in the options market. They create options contracts and earn a premium from buyers. In return, they take on the obligation to buy (for put options) or sell (for call options) the underlying asset if the buyer exercises the contract. While writers benefit from time decay—since options lose value as expiration nears—they also face significant risk, especially in uncovered (naked) positions. For example, a call writer could face unlimited losses if the asset’s price rises sharply. Hence, writing options demands careful risk assessment and margin management.

Part 12 Trading Master Class With Experts Importance of Knowledge and Timing:
Successful option trading depends heavily on market knowledge, timing, and strategy selection. Understanding concepts like intrinsic value, time decay (theta), volatility (vega), and interest rate effects (rho) is essential. Mistimed trades or poorly chosen strategies can lead to total loss of the premium. Additionally, options are time-sensitive assets, meaning the value erodes as expiration approaches. Traders must monitor market conditions and adjust positions accordingly. While options can offer high returns, they also carry significant risk, and disciplined analysis, research, and risk management are crucial to navigate the complexity of option markets effectively.

Part 11 Trading Master Class With Experts Market Participation and Flexibility:
Option trading allows investors to participate in markets with diverse strategies without directly owning the underlying assets. Traders can speculate on upward, downward, or even sideways movements of the asset, using strategies like covered calls, straddles, or iron condors. This flexibility makes options suitable for different market conditions and investor goals. Unlike stocks, options can generate income through premium collection, or be used to adjust existing positions dynamically. By choosing strike prices, expiration dates, and contract sizes, traders can customize risk-reward profiles to align with their market outlook, making options highly versatile instruments.

PCR Trading StrategiesPricing and Premiums:
The price of an option, called the premium, is influenced by several factors: the underlying asset’s price, the strike price, time until expiration, volatility, and interest rates. Options with a longer duration or higher volatility generally have higher premiums. The premium is essentially the cost of controlling the asset without owning it outright. For buyers, the premium is the maximum potential loss, while sellers (writers) collect it as income but take on potentially unlimited risk. Understanding how premiums change with market conditions is crucial for traders to time entries and exits effectively.

Part 2 Intraday TradingStrategies and Benefits:
Option trading allows a wide range of strategies, from basic buying and selling to complex combinations like spreads, straddles, and collars. Investors can protect their portfolio from adverse market moves (hedging) or profit from volatility without owning the underlying asset. Options also provide flexibility—traders can tailor risk and reward according to market expectations. While the potential for higher returns exists, understanding time decay, volatility, and strike prices is crucial. Proper knowledge and strategy help manage risk, making options a powerful tool for both conservative and speculative investors.

Part 1 Intraday Trading Definition and Mechanism:
Option trading is a financial contract that gives the buyer the right, but not the obligation, to buy or sell an underlying asset (like stocks, indices, or commodities) at a predetermined price within a specified period. There are two types: Call options (right to buy) and Put options (right to sell). Traders use options to hedge risks or speculate on price movements. Unlike direct stock trading, options allow leverage, meaning a small investment can control a larger position. However, the risk of losing the entire premium exists if the option expires worthless.

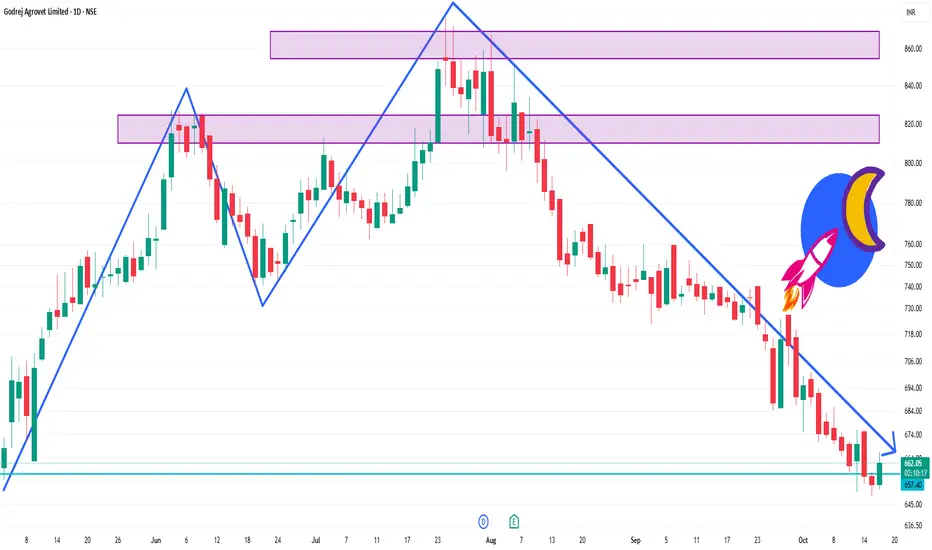
GODREJAGRO 1 Day Time Frame 📈 Intraday Support & Resistance Levels
Support Levels:
₹642.98 (S1)
₹647.97 (S2)
₹653.18 (S3)
₹637.77 (S4)
Resistance Levels:
₹658.17 (R1)
₹663.38 (R2)
₹668.37 (R3)
₹672.60 (R4)
These levels are based on standard pivot point calculations and are valid for intraday trading.
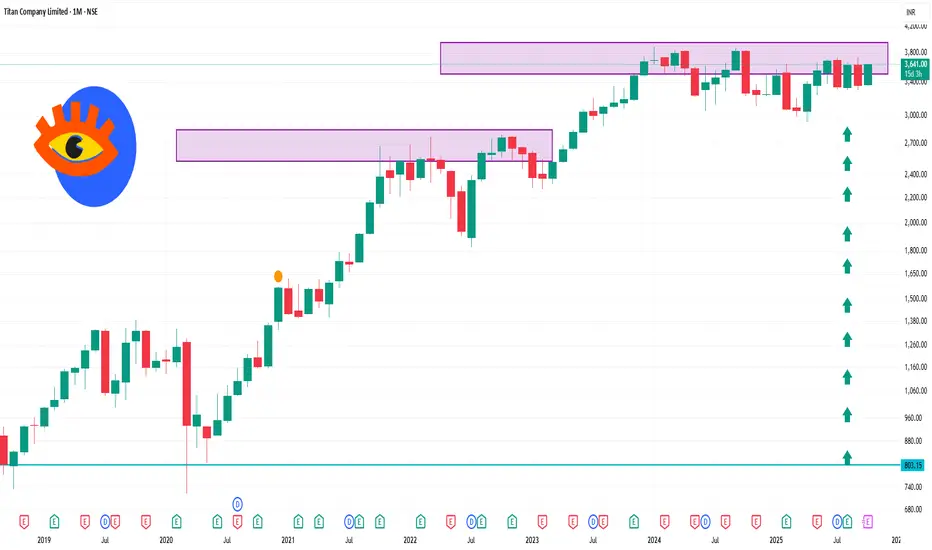
TITAN 1 Month Time Frame Titan Company Ltd is trading near ₹3,636.50, approaching its 52-week high of ₹3,740.
📊 1-Month Technical Overview
Price Performance: The stock has seen a modest decline of approximately 0.20% over the past month.
Technical Indicators:
Relative Strength Index (RSI): The RSI is currently in the neutral zone, indicating balanced buying and selling pressures.
Moving Averages: The stock is trading above its short-term moving averages, suggesting a positive short-term trend.
Stochastic Oscillator: The stochastic indicator is in the bullish zone, indicating potential upward momentum.
Commodity Channel Index (CCI): The CCI is above zero, signaling a bullish trend.
Rate of Change (ROC): The ROC is positive, further confirming bullish momentum.
Money Flow Index (MFI): The MFI is above 50, indicating healthy buying activity.
Support and Resistance Levels:
Support: ₹3,189.25
Resistance: ₹3,559.25
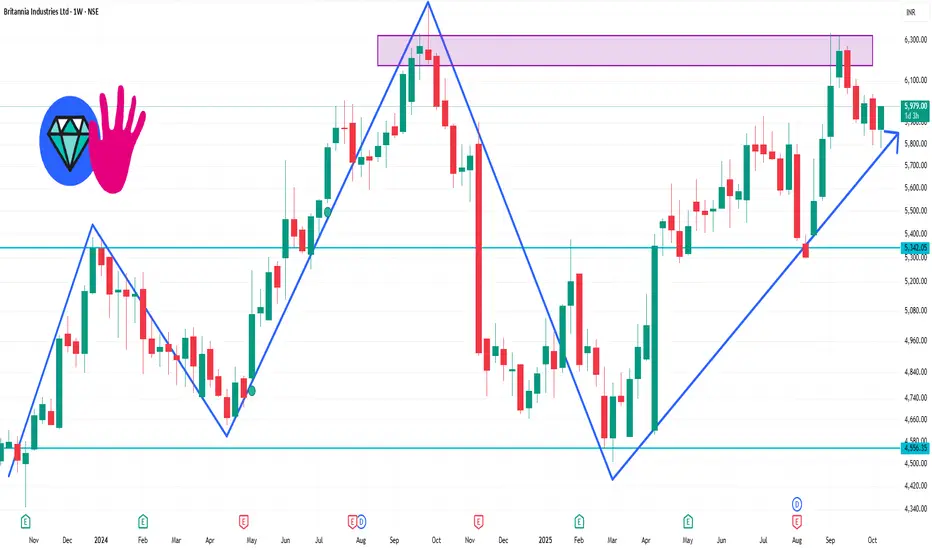
BRIT 1 Week TIme Frame 📊 Technical Indicators (Weekly)
Relative Strength Index (RSI): 41.73 — Indicates a neutral stance, neither overbought nor oversold.
Moving Average Convergence Divergence (MACD): -25.66 — Suggests a bearish trend, with the MACD line below the signal line.
Average Directional Index (ADX): 20.38 — Points to a weak trend, implying indecision in the stock's movement.
Commodity Channel Index (CCI): -132.30 — Reflects a mildly bullish condition, though caution is advised.
Williams %R: -84.06 — Indicates a mildly bullish position, suggesting potential upward movement.
📈 Price Action & Trend
Weekly High: ₹5,953.00
Weekly Low: ₹5,782.00
Current Price: ₹5,800.50
Weekly Return: +1.47%
The stock has shown resilience, trading above its 200-day simple moving average (SMA), which is considered a positive long-term indicator.
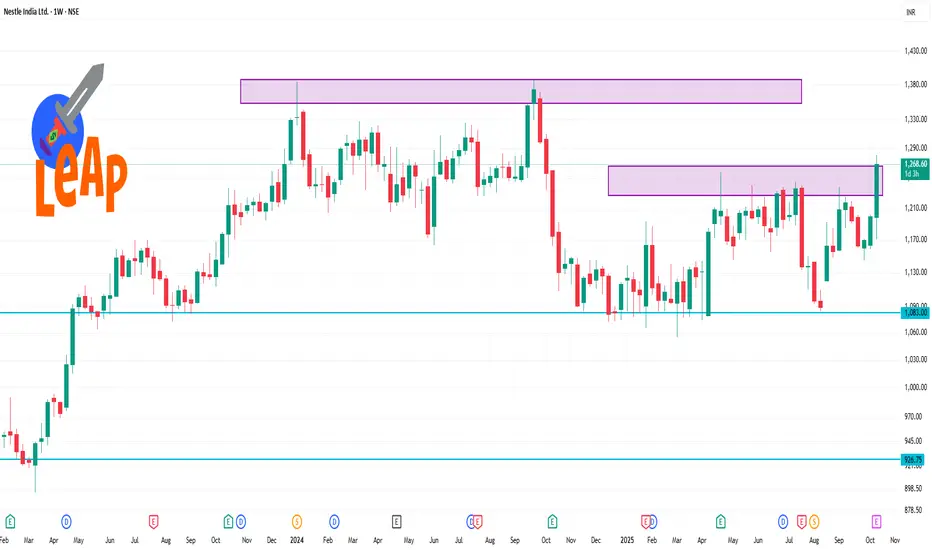
NESTLEIND 1 Week Time Frame📊 1-Week Performance Snapshot
Current Price: ₹1,264.90
1-Week Change: +6.5%
52-Week Range: ₹1,055.00 – ₹1,281.20
Day’s Range: ₹1,216.50 – ₹1,275.60
Volume: 1.61 million shares
📈 Technical Indicators
Relative Strength Index (RSI): Approximately 70.37, nearing overbought territory
Moving Average Convergence Divergence (MACD): Around +9.76, indicating bullish momentum
Support Level: ₹1,216.50 (recent low)
Resistance Level: ₹1,275.60 (recent high)
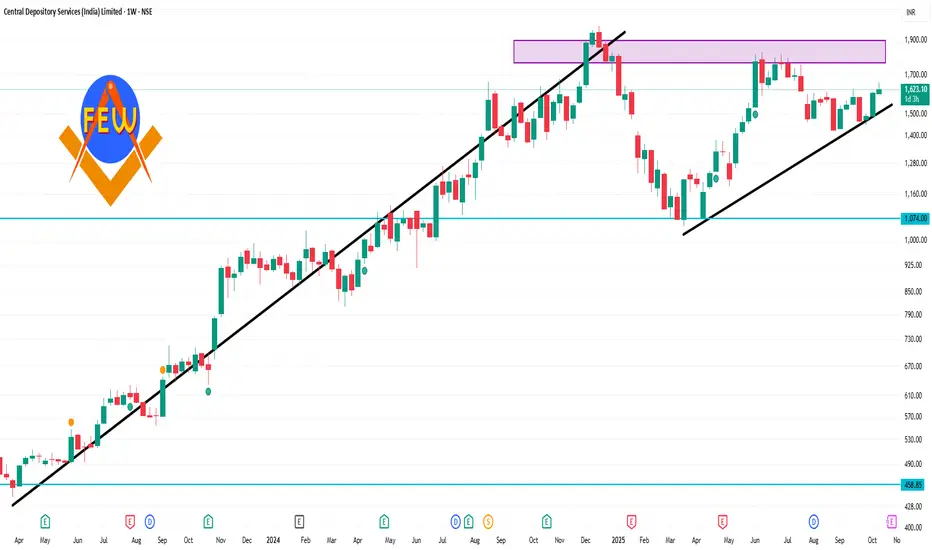
CDSL 1 Week Time Frame 📈 Current Stock Price
NSE Price: ₹1,627.00
Previous Close: ₹1,622.00
Daily Change: +0.31%
📊 Key Metrics
Market Capitalization: ₹34,010.57 crore
52-Week Range: ₹1,047.45 – ₹1,989.80
P/E Ratio (TTM): 68.51
P/B Ratio: 18.79
Dividend Yield: 0.77%
Book Value: ₹84.23
Face Value: ₹10
📅 Recent Performance
1-Week Change: +4.39%
6-Month Change: +32.04%
Part 9 Trading Master ClassOption Expiry and Settlement
Every option contract has a fixed expiry date, after which it becomes invalid. In India, for example, index options like NIFTY and BANKNIFTY expire weekly or monthly, while stock options usually have monthly expiries.
There are two types of settlements:
Cash Settlement: The difference between the strike and market price is credited or debited in cash (used in index options).
Physical Settlement: The actual delivery of stocks occurs (used in stock options in India).
Understanding expiry cycles is crucial, as price movements near expiry can become highly volatile due to time decay and traders closing positions.

Part 8 Trading Master ClassOption Greeks – The Key Metrics
Option pricing is influenced by several mathematical variables known as Option Greeks:
Delta: Measures how much the option price moves for every ₹1 change in the underlying asset.
Theta: Measures time decay — how much the option loses value daily as expiry nears.
Vega: Measures sensitivity to volatility; higher volatility increases premium.
Gamma: Tracks how much delta changes when the underlying price moves.
Rho: Measures sensitivity to interest rate changes.
Professional traders rely on these Greeks to manage risk and adjust positions according to market conditions.

Part 7 Trading Master Class Understanding Option Premium and Its Factors
The option premium is the price a trader pays to buy an option. It consists of two parts — intrinsic value and time value.
Intrinsic Value is the difference between the current price of the underlying asset and the strike price. For example, if a stock trades at ₹110 and the call strike is ₹100, the intrinsic value is ₹10.
Time Value reflects the potential for the option to gain more value before expiry. The longer the time to expiry and the higher the volatility, the greater the time value.
As expiry nears, time value decreases — a phenomenon known as time decay (theta). Understanding how premium behaves helps traders make better entry and exit decisions.

Part 4 Institutional Trading Types of Option Trading Strategies
Option traders use different strategies depending on their market view:
Bullish Strategies: Buying Call Options, Bull Call Spreads.
Bearish Strategies: Buying Put Options, Bear Put Spreads.
Neutral Strategies: Iron Condor, Straddle, Strangle — for when the trader expects low volatility.
These strategies help balance risk and reward, allowing traders to profit even in sideways markets.
