Decoding Market Movements with Volume ProfileWhat is Volume Profile?
Volume Profile is a graphical representation of the amount of trading volume that has occurred at various price levels over a specified period. Unlike traditional volume bars that are plotted at the bottom of a price chart (showing volume over time), Volume Profile displays volume horizontally across price levels, highlighting where the most trading activity occurred.
This is critical because it helps identify price acceptance and rejection zones — areas where traders were most or least interested in transacting. These zones often become future levels of support and resistance.
Core Components of Volume Profile
Point of Control (POC):
This is the price level at which the highest volume of trading occurred within the selected time frame. The POC acts as a “magnet” for price and often represents a fair value area where both buyers and sellers have agreed most.
Value Area (VA):
This is the range of prices that contains around 70% of the total traded volume. It indicates where the majority of trading took place and is divided into:
Value Area High (VAH): The upper boundary of the value area.
Value Area Low (VAL): The lower boundary of the value area.
Prices moving outside this range suggest either overvaluation or undervaluation in the short term.
High Volume Nodes (HVN):
These are zones with concentrated trading activity. They signify strong price acceptance and tend to act as support or resistance.
Low Volume Nodes (LVN):
These are price levels with very little trading activity, showing price rejection zones. When price revisits these areas, it often experiences quick movement due to a lack of liquidity.
How Volume Profile Differs from Traditional Volume Indicators
Traditional volume indicators, such as the volume histogram or On-Balance Volume (OBV), show how much volume occurred over time but do not indicate at which prices the volume took place. Volume Profile, on the other hand, provides a spatial context — revealing where the big players entered or exited the market.
This distinction is vital because markets are driven by institutional traders who operate at specific price levels. By analyzing these price-based volume concentrations, retail traders can align themselves with “smart money” and anticipate key turning points.
Using Volume Profile in Market Analysis
1. Identifying Market Structure
Volume Profile helps traders classify the market into balance (range-bound) and imbalance (trending) conditions.
In a balanced market, volume is evenly distributed, and the price rotates around the POC.
In an imbalanced market, volume shifts in one direction, signaling a new trend or breakout.
Recognizing these conditions early allows traders to adjust strategies — employing mean reversion in balanced phases and trend-following in imbalanced phases.
2. Spotting Support and Resistance Levels
Volume clusters (HVNs) often become key support and resistance zones. When price moves back toward these areas, it may pause or reverse, as these levels represent heavy institutional interest. Conversely, LVNs are potential breakout zones, where prices move swiftly due to a lack of opposing orders.
For example:
If the price rises above VAH with strong volume, it signals bullish conviction.
If it falls below VAL with heavy volume, it indicates bearish strength.
3. Detecting Institutional Activity
Institutions trade in large volumes, and their footprints are visible on the Volume Profile. When you see a large volume concentration forming abruptly, it’s often the result of institutional accumulation or distribution. Understanding these patterns can help traders anticipate future price moves.
For instance:
Accumulation: Heavy volume at the bottom of a range followed by upward price movement.
Distribution: Heavy volume at the top of a range followed by a downward trend.
4. Volume Profile and Trend Confirmation
When analyzing trends, Volume Profile confirms whether price movements are supported by strong participation.
In an uptrend, increasing volume at higher price levels suggests healthy demand.
In a downtrend, higher volume at lower prices confirms strong selling pressure.
If volume weakens during trend continuation, it may signal an impending reversal.
Integrating Volume Profile with Other Technical Tools
To enhance accuracy, traders often combine Volume Profile with complementary tools such as:
Moving Averages:
Identify overall trend direction, while Volume Profile reveals strong price zones within that trend.
Price Action Analysis:
Combine candlestick patterns (like pin bars or engulfing candles) with volume zones to spot high-probability entries.
Market Profile (TPO Charts):
While Volume Profile shows volume distribution, Market Profile displays time spent at each price level, offering a deeper understanding of market behavior.
Fibonacci Retracements:
When Fibonacci levels align with HVNs or LVNs, the confluence strengthens potential reversal zones.
Volume Profile Across Different Markets
Stock Market:
In equities, Volume Profile reveals where institutional buying or selling occurred. It helps traders determine entry levels during consolidations and exit points during rallies.
Futures Market:
Futures traders rely heavily on Volume Profile to identify fair value zones. Exchanges provide accurate volume data, making this tool extremely effective for intraday and positional analysis.
Forex Market:
Though Forex lacks centralized volume data, many platforms offer tick volume approximations. Even this limited data, when analyzed with price levels, gives valuable market insights.
Cryptocurrency Market:
In crypto trading, where volatility is high, Volume Profile helps traders detect zones of high liquidity and potential breakout points.
Practical Trading Strategies Using Volume Profile
1. Reversion to Mean (POC Bounce) Strategy
Wait for price to move away from POC and show exhaustion.
Enter trade when price starts reverting back toward POC.
Use VAH and VAL as targets and stop-loss zones.
2. Breakout and Retest Strategy
Identify LVN or VAL/VAH breakout levels.
Wait for the price to retest these zones with declining volume.
Enter in the direction of the breakout, using the next volume node as the target.
3. Volume Gap Play
When there’s a visible volume gap between two HVNs, it indicates a low liquidity zone.
If price enters this gap, it usually moves quickly until it reaches the next high-volume area.
4. Intraday Volume Profile Setup
Use smaller time-frame profiles (like 5-min or 15-min sessions).
Identify session POCs and value areas.
Trade pullbacks to these zones in alignment with overall market bias.
The Psychology Behind Volume Profile
Volume Profile doesn’t just show numbers — it visualizes market psychology. Every spike or dip in volume tells a story about traders’ emotions:
High-volume zones reflect equilibrium — agreement between buyers and sellers.
Low-volume zones reflect indecision or rejection — a lack of conviction.
Shifts in volume concentration reveal sentiment transitions, such as greed turning to fear or vice versa.
By interpreting these patterns, traders can anticipate how collective behavior might drive the next market phase.
Advantages of Using Volume Profile
Provides clear visual representation of where the real market interest lies.
Identifies hidden support and resistance levels ignored by conventional indicators.
Helps understand institutional footprints and market intent.
Offers flexibility across all markets and time frames.
Encourages data-driven trading decisions instead of emotional impulses.
Limitations of Volume Profile
Despite its effectiveness, traders must remain aware of its constraints:
It requires accurate volume data — not always available in decentralized markets.
Works best when combined with other technical tools.
Interpretation can be subjective; novice traders might misread key zones.
In fast-moving or news-driven markets, volume analysis may lag behind price action.
Conclusion
The Volume Profile is not just another indicator; it’s a comprehensive framework for understanding how markets truly function. By revealing the invisible dynamics of supply and demand, it allows traders to see beyond surface-level price movements. When integrated with disciplined market analysis, it becomes a strategic advantage — helping identify fair value, detect institutional participation, and forecast future price direction with greater confidence.
In today’s algorithm-driven trading environment, those who understand where and why volume accumulates can anticipate market turns before they happen. Whether you’re a short-term scalper, swing trader, or long-term investor, mastering the Volume Profile can transform your market perspective — turning raw data into actionable insight and uncertainty into opportunity.
Tradingidea
Part 12 Trading Master Class Profit and Loss
Buyer’s profit can be unlimited (especially for call options) but the loss is limited to the premium paid.
Seller’s profit is limited to the premium received but losses can be unlimited.
Option Strategies
Traders combine calls and puts to form strategies like covered calls, straddles, strangles, spreads, etc., depending on whether they expect the market to rise, fall, or remain stable.
Uses of Options
Options are used for:
Hedging (reducing risk on existing positions)
Speculation (betting on price movements)
Income generation (through option writing)

Part 11 Trading Master Class Strike Price
The strike price is the pre-decided price at which the option buyer can buy (call) or sell (put) the underlying asset.
Expiry Date
Options have a limited life. The expiry date is the last day the option can be exercised—after this, it becomes worthless.
Premium
The premium is the cost paid by the buyer to purchase the option. It’s determined by factors like time left to expiry, volatility, and distance from the strike price.
Leverage
Options provide high leverage—you can control large positions with a small amount of money. However, this also increases potential risk.

Part 4 Learn Institutional Trading Option trading is a type of derivative trading where traders buy or sell the right (but not the obligation) to buy or sell an underlying asset—like stocks, indices, or commodities—at a specific price before a certain date.
Two Main Types of Options
Call Option: Gives the holder the right to buy the asset.
Put Option: Gives the holder the right to sell the asset.
Key Participants
There are two sides in an options trade:
Buyer (Holder): Pays a premium for the right to trade.
Seller (Writer): Receives the premium and has an obligation to fulfill the contract if exercised.

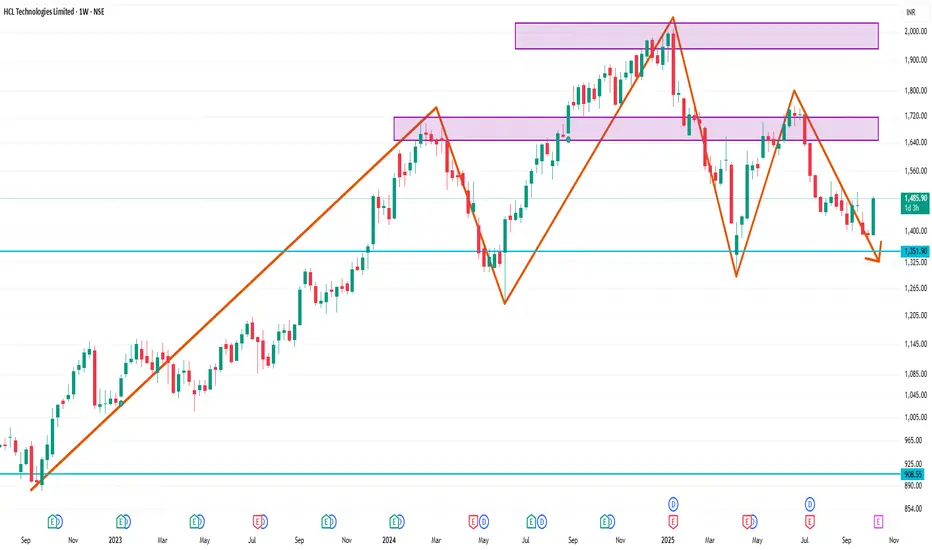
HCLTECH 1 Week Time Frame📈 1-Week Performance Overview
Current Price: ₹1,480.00 (as of October 9, 2025)
Weekly Gain: Approximately 6.51%
📊 Recent Trading Highlights
October 8, 2025: Closed at ₹1,452.85, up 1.34% from the previous day, outperforming the BSE SENSEX Index, which declined by 0.19%.
October 7, 2025: Closed at ₹1,433.65, marking a 1.20% increase, with the SENSEX Index rising by 0.17%.
October 3, 2025: Closed at ₹1,393.25, up 0.27%, while the SENSEX Index gained 0.28%.
📉 52-Week Range
52-Week High: ₹2,011.00 (January 13, 2025)
52-Week Low: ₹1,302.75
Current Price: ₹1,480.00
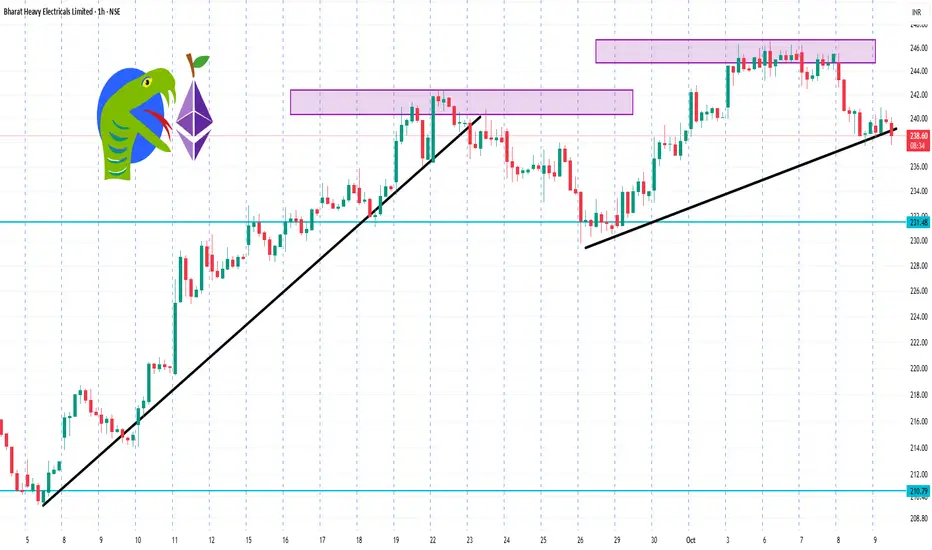
BHEL 1 Hour Time Frame 📉 1-Hour Technical Analysis Summary
Overall Signal: Strong Sell
Relative Strength Index (RSI): 41.43 — approaching oversold territory
MACD: -0.58 — indicating downward momentum
Stochastic Oscillator: 21.78 — confirming bearish bias
Average Directional Index (ADX): 54.36 — suggesting a strong trend
Williams %R: -76.66 — indicating oversold conditions
Commodity Channel Index (CCI): -68.24 — supporting bearish outlook
Pivot Levels:
Support: S1 = ₹238.45
Resistance: R1 = ₹240.85
These indicators collectively suggest a continuation of the current downtrend.
🔍 Key Price Levels
Intraday Support: ₹236.19
Intraday Resistance: ₹243.64
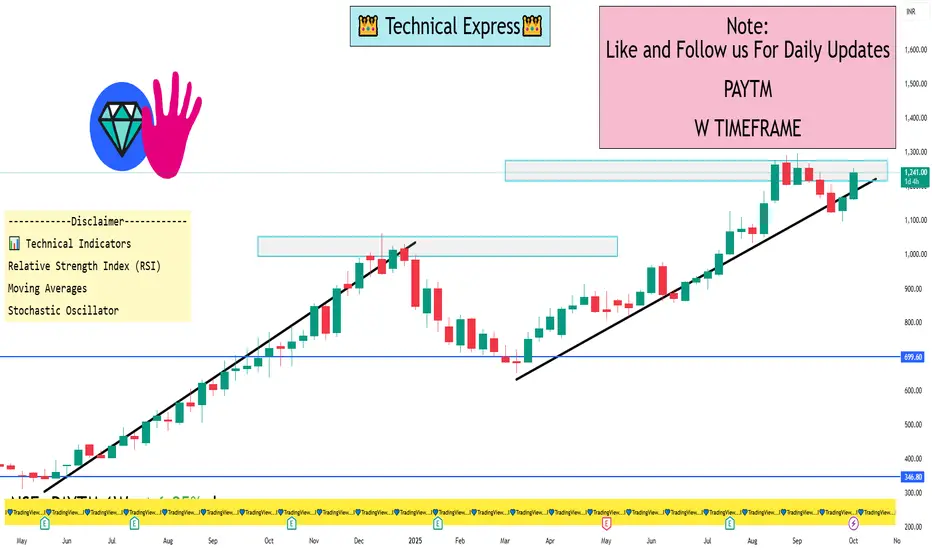
PAYTM 1 Week View 📈 Current Price Snapshot
Latest Price: ₹1,241.50
Day's Range: ₹1,224.30 – ₹1,247.80
52-Week Range: ₹651.50 – ₹1,296.60
🔧 Key Technical Levels (1-Week Timeframe)
Resistance Levels:
₹1,247.80 – Recent intraday high
₹1,288.30 – Near-term resistance zone
Support Levels:
₹1,224.30 – Recent intraday low
₹1,119.00 – Short-term support
📊 Technical Indicators
Relative Strength Index (RSI): 57.67 – Indicates bullish momentum without being overbought.
Moving Averages: Both short-term and long-term moving averages are in a bullish alignment, supporting the positive trend.
Stochastic Oscillator: In the bullish zone, suggesting continued upward momentum.
🧭 Summary
The stock is currently trading near its recent intraday high, indicating strong bullish momentum. With RSI and moving averages supporting the uptrend, PAYTM appears poised to test higher resistance levels in the near term. However, investors should monitor the stock's movement near the resistance level of ₹1,288.30 for potential breakout or reversal signals.
Momentum Trading Secrets: Unlocking the Market’s Hidden Energy1. The Science of Momentum
Momentum trading is rooted in behavioral finance and market psychology. It leverages the tendency of investors to underreact or overreact to new information, creating sustained price moves. The basic scientific principle can be summarized as:
“Assets that have performed well recently are likely to continue performing well in the near future, and vice versa.”
Key aspects include:
Trend Identification: Momentum traders look for assets with strong directional movement.
Rate of Change (ROC): Calculating how fast an asset’s price is changing helps determine momentum strength.
Volume Confirmation: High trading volume validates the sustainability of a trend.
Behavioral Patterns: Fear and greed amplify trends, making momentum strategies more predictable.
2. Tools and Indicators in Momentum Trading
Momentum traders rely heavily on technical indicators to gauge the strength of a move. Some of the most effective tools include:
Relative Strength Index (RSI): Measures overbought or oversold conditions to anticipate potential trend continuations or reversals.
Moving Average Convergence Divergence (MACD): Helps identify trend direction and momentum shifts.
Stochastic Oscillator: Useful for spotting trend reversals or continuation signals in volatile markets.
Volume Weighted Average Price (VWAP): Indicates the average price weighted by volume, often used by institutional traders to confirm momentum.
Rate of Change (ROC): Measures the percentage change in price over a specific period, signaling momentum strength.
The secret lies in combining indicators rather than relying on one. For example, using RSI for trend strength and MACD for entry timing often produces higher-probability trades.
3. Secrets to Identifying True Momentum
Not all price movements represent genuine momentum. The following secrets help distinguish real trends from false signals:
Look Beyond the Noise: Small price fluctuations are often misleading. True momentum comes with consistent directional moves and high volume.
Time Frame Alignment: Momentum should be confirmed across multiple time frames. A short-term uptrend in a long-term downtrend can be risky.
Sector and Market Context: Stocks often move in sync with sectors. Identifying sector momentum can increase trade success.
Catalyst Awareness: Earnings reports, news events, and macroeconomic data often trigger strong momentum moves.
Volume Patterns: Sudden spikes in volume often precede sharp moves, indicating institutional participation.
4. Entry and Exit Strategies
Mastering momentum trading requires precise timing. Secrets in execution include:
Breakout Trading: Enter trades when price breaks key resistance or support levels with high momentum.
Pullback Entries: Waiting for minor retracements during a trend allows for safer entries at lower risk levels.
Trailing Stop Losses: Using dynamic stops that follow the trend ensures profits are locked in while letting winners run.
Scaling Positions: Incrementally increasing positions as momentum strengthens reduces risk exposure.
The critical secret: never fight the trend. Momentum trading is about riding the wave, not predicting reversals.
5. Risk Management Secrets
Momentum trading can be extremely profitable but also highly risky if not managed properly. Successful traders use:
Position Sizing: Limiting exposure to a small percentage of the trading account prevents catastrophic losses.
Stop Loss Discipline: Predefined exit points are crucial, as momentum can reverse quickly.
Diversification: Trading across multiple assets or sectors spreads risk while capturing diverse momentum opportunities.
Volatility Assessment: Understanding the volatility of the instrument ensures proper risk-reward alignment.
The secret is balancing aggressive profit potential with controlled risk, turning a volatile strategy into a sustainable one.
6. Psychological Edge in Momentum Trading
Momentum trading is as much about mindset as strategy. The key psychological secrets include:
Emotion Control: Fear and greed can destroy momentum trades. Sticking to rules and systems is vital.
Patience and Discipline: Waiting for the right setup rather than chasing price is a hallmark of successful traders.
Adaptability: Market conditions change. Momentum traders must adjust strategies to new trends, not rely on past performance.
Confidence vs. Overconfidence: Understanding the difference ensures consistent execution without reckless risk-taking.
7. Advanced Momentum Trading Techniques
Seasoned traders often leverage advanced techniques to amplify profits:
Sector Rotation Strategy: Moving capital into sectors showing strongest momentum while exiting weak sectors.
Pairs Trading with Momentum: Trading correlated assets by buying the stronger momentum asset and shorting the weaker.
Algorithmic Momentum Strategies: Using quantitative models to scan multiple instruments and automatically execute trades.
Options for Momentum Leverage: Using call and put options to magnify returns while managing capital efficiently.
These techniques reveal the “hidden secrets” of institutional-level momentum trading, making it more than just buying high and selling higher.
8. Common Mistakes to Avoid
Even experienced traders stumble when ignoring momentum trading rules. Common pitfalls include:
Chasing Trends Too Late: Entering after most of the move is over reduces profit potential.
Ignoring Volume: Low-volume momentum often reverses unexpectedly.
Over-Leveraging: Excessive leverage can wipe out accounts during sudden reversals.
Neglecting Market Context: Ignoring broader market trends can lead to false signals.
Awareness of these mistakes is a secret weapon in protecting both capital and confidence.
9. Case Studies of Momentum Trading Success
Momentum trading has produced legendary gains for traders who mastered its secrets. For instance:
Tech Stock Surges: Riding early momentum in high-growth tech companies during earnings announcements.
Commodity Moves: Capturing sharp momentum in oil or gold during geopolitical events.
Cryptocurrency Trends: Exploiting rapid price swings with disciplined momentum strategies.
These examples highlight that momentum trading is applicable across markets and time frames, provided the rules are followed.
10. The Future of Momentum Trading
With advancements in technology, momentum trading is evolving:
AI and Machine Learning: Algorithms can detect momentum patterns faster than human traders.
Social Sentiment Analysis: Platforms now measure crowd psychology and predict momentum based on social chatter.
High-Frequency Trading (HFT): Institutional traders use speed and algorithms to exploit tiny momentum shifts.
Traders who understand these trends and adapt their strategies will maintain a competitive edge in the future markets.
Conclusion
Momentum trading is an art backed by science. Its secrets lie not just in indicators or charts, but in understanding market psychology, managing risk, and executing trades with discipline. By mastering trend identification, entry and exit timing, and psychological control, traders can transform momentum strategies into consistent profit engines.
While momentum trading can seem risky, applying these secrets systematically turns volatility into opportunity. In today’s fast-moving markets, momentum trading remains one of the most powerful tools for traders willing to combine technical skill with strategic insight.
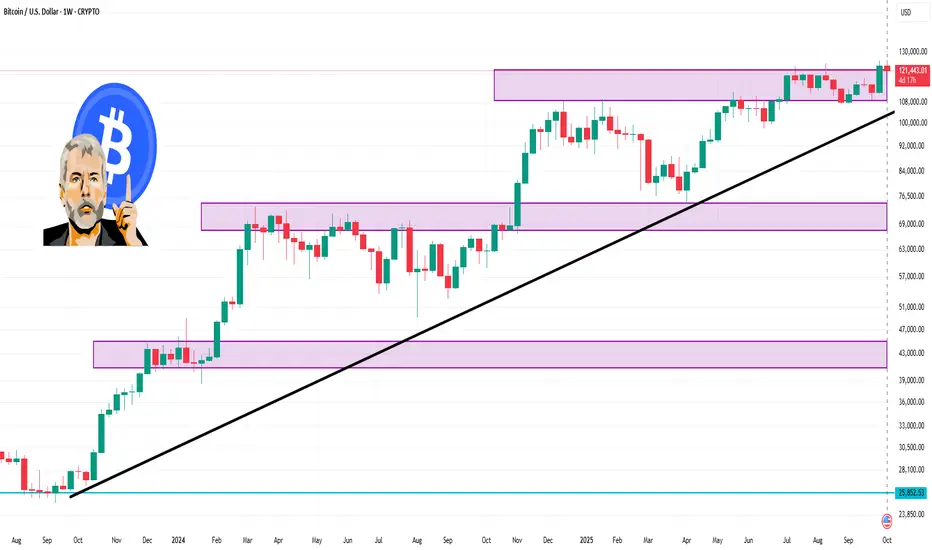
BTC against USD 1 Week Time Frame 📊 Weekly Technical Levels
Resistance Levels:
$124,652.59
$127,266.08
$129,248.44
Support Levels:
$120,056.73
$118,074.38
$115,460.88
These levels are based on Barchart's technical analysis and are derived from the most recent data available.
📈 Technical Indicators
Relative Strength Index (RSI): The RSI is currently at 61.95%, indicating that Bitcoin is neither overbought nor oversold.
Stochastic Oscillator: Both the %K and %D lines are in the 80% range, suggesting that Bitcoin is in an overbought condition, which could precede a pullback.
Average True Range (ATR): The 9-day ATR is 3,316.77, indicating a daily price movement of approximately 2.73%.
Directional Movement Index (DMI): The +DI is at 35.72, and the -DI is at 10.17, suggesting a strong bullish trend.
🔮 Market Outlook
Analysts project that Bitcoin may reach up to $126,865 within the next week, with a potential target of $129,753 over the next four weeks.
⚠️ Risk Considerations
While the long-term outlook appears bullish, it's essential to monitor key support levels. A drop below $120,000 could signal a short-term correction. Additionally, the stochastic oscillator indicates an overbought condition, which may lead to a pullback.
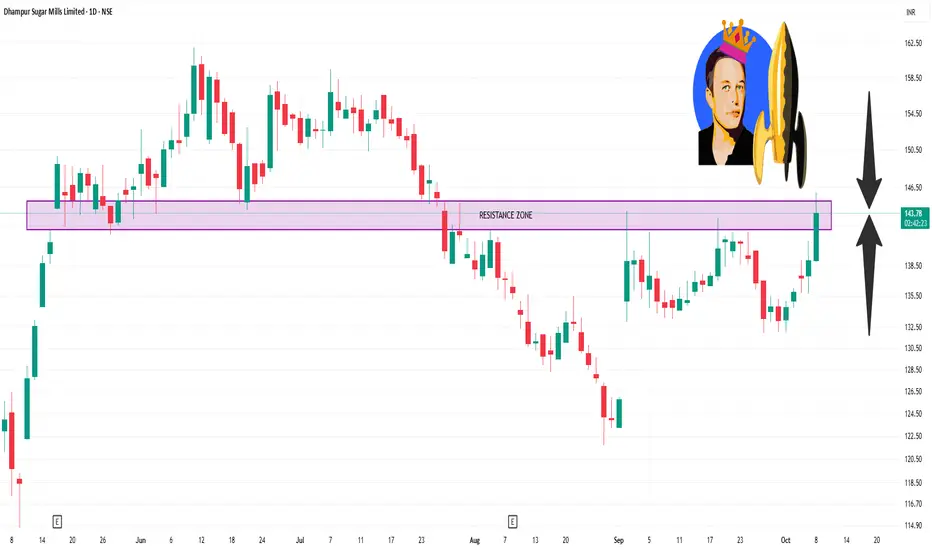
DHAMPURSUG 1 Day Time Frame 📊 Intraday Support & Resistance Levels
Based on recent technical analyses, here are the key levels for intraday trading:
Resistance Levels:
R1: ₹141.44
R2: ₹143.87
R3: ₹146.74
Support Levels:
S1: ₹136.14
S2: ₹133.27
S3: ₹130.84
These levels are derived from the Classic pivot point method and are calculated based on the price range of the previous trading day.
🔄 Pivot Points
The pivot point for today is ₹138.57, with variations in resistance and support levels across different methods:
Classic Pivot Point:
Pivot: ₹138.57
Resistance: ₹141.44, ₹143.87, ₹146.74
Support: ₹136.14, ₹133.27, ₹130.84
Fibonacci Pivot Point:
Pivot: ₹138.57
Resistance: ₹140.59, ₹141.84, ₹143.87
Support: ₹136.54, ₹135.29, ₹133.27
Camarilla Pivot Point:
Pivot: ₹138.57
Resistance: ₹139.51, ₹139.99, ₹140.48
Support: ₹138.53, ₹138.05, ₹137.56
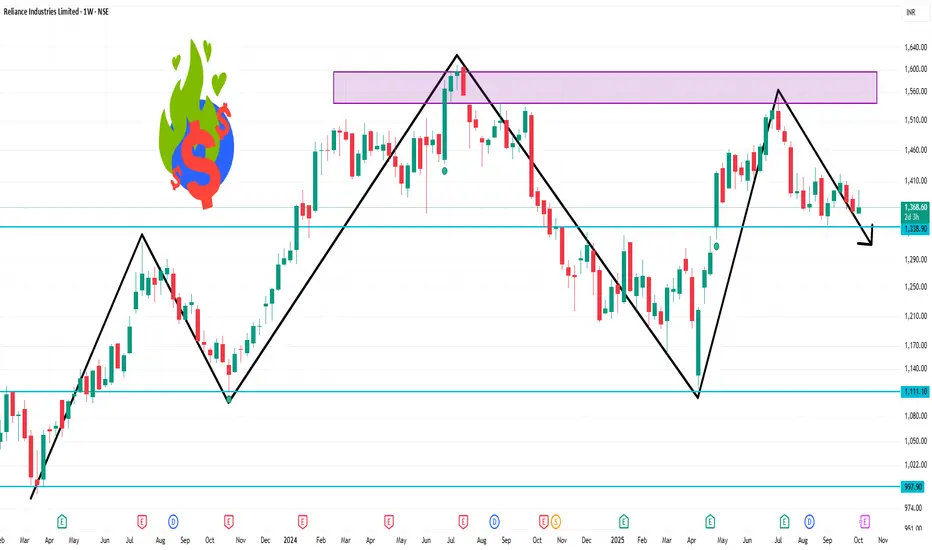
RELIANCE 1 Week Time Frame 📊 Weekly Technical Outlook
Overall Trend: The prevailing trend is bearish, with a "Strong Sell" signal on the weekly timeframe.
Moving Averages: All key moving averages—5-day, 10-day, 20-day, 50-day, 100-day, and 200-day—are indicating a "Sell" signal.
Relative Strength Index (RSI): The RSI is at 44.99, suggesting the stock is neither overbought nor oversold but leans towards a bearish stance.
MACD: The Moving Average Convergence Divergence (MACD) is positive at 1.73, indicating potential upward momentum.
🔧 Key Support & Resistance Levels
Weekly Pivot Point: ₹1,369.77
Support Levels: ₹1,318.43, ₹1,337.67
Resistance Levels: ₹1,401.87, ₹1,414.73
🔍 Additional Indicators
Technical Summary: The stock is rated as a "Strong Sell" based on moving averages and technical indicators.
Pivot Analysis: Current price is trading below the weekly pivot point, indicating a bearish short-term outlook.
📈 Conclusion
Reliance Industries Ltd is currently in a bearish phase on the weekly chart, with all major moving averages signaling a "Sell." While the MACD suggests some potential for upward movement, the overall technical indicators and pivot analysis point towards caution. Traders should monitor the support levels closely; a break below ₹1,318.43 could lead to further downside.
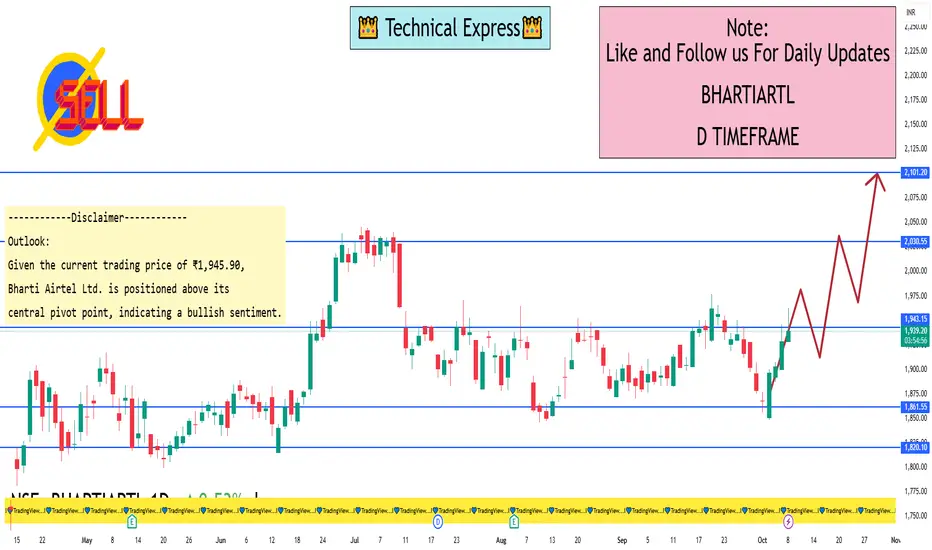
BHARTIARTL 1 Day ViewTechnical Overview:
Support Levels:
Standard Pivot: ₹1,895.30
Camarilla S3: ₹1,916.35
Fibonacci S1: ₹1,879.00
Resistance Levels:
Standard Pivot: ₹1,914.80
Camarilla R3: ₹1,937.43
Fibonacci R1: ₹1,942.57
Central Pivot Range:
Top: ₹1,927.00
Central: ₹1,925.00
Bottom: ₹1,923.00
These levels are derived from standard pivot points, Camarilla, and Fibonacci calculations, providing a comprehensive view of potential support and resistance zones.
Outlook:
Given the current trading price of ₹1,945.90, Bharti Airtel Ltd. is positioned above its central pivot point, indicating a bullish sentiment. The stock is approaching the Camarilla R3 resistance level of ₹1,937.43, which, if surpassed, could lead to further upward momentum. Conversely, a decline below the standard support level of ₹1,895.30 may signal a bearish trend.
Choose Mutual Funds Smartly1. Understanding Mutual Funds
Before choosing mutual funds, it’s important to understand what they are.
Definition: A mutual fund is a pooled investment vehicle where money from multiple investors is collected and invested in a diversified portfolio of stocks, bonds, or other securities by professional fund managers.
Types of Mutual Funds:
Equity Funds: Invest primarily in stocks; higher risk, higher potential returns.
Debt Funds: Invest in bonds, government securities, and fixed-income instruments; lower risk, moderate returns.
Hybrid Funds: Mix of equity and debt; balance of risk and return.
Sectoral/Thematic Funds: Focus on specific sectors (like technology, pharma) or themes (like ESG investing).
Index Funds & ETFs: Track market indices; passive management; low expense ratio.
Key takeaway: Understanding the type of fund helps align investments with your financial goals and risk tolerance.
2. Define Your Investment Goals
Choosing mutual funds smartly begins with clarity about your financial objectives.
Short-term Goals (0–3 years): Emergency fund, vacation, buying a car. Focus on low-risk funds like debt or liquid funds.
Medium-term Goals (3–7 years): House down payment, higher education. Consider hybrid or balanced funds.
Long-term Goals (7+ years): Retirement, wealth creation. Equity funds or index funds are suitable for long-term growth.
Tip: Always match the fund’s investment horizon with your financial goal horizon.
3. Assess Your Risk Appetite
Risk tolerance is crucial for fund selection.
High-risk appetite: Can tolerate volatility for higher returns → Equity or sectoral funds.
Moderate-risk appetite: Comfortable with some fluctuations → Balanced or hybrid funds.
Low-risk appetite: Prefer stable returns → Debt funds or government securities.
Important: Assess your risk not just financially but emotionally. Some investors panic during market dips.
4. Analyze Fund Performance
Past performance is not a guarantee, but it indicates the fund manager’s skill.
Look for consistency: Check returns over 1, 3, 5, and 10 years.
Compare with benchmarks: A good equity fund should outperform its benchmark index.
Evaluate risk-adjusted returns: Use metrics like Sharpe Ratio or Standard Deviation.
Example: A fund that gives 12% annual return with moderate volatility is preferable to a 15% return fund with extreme fluctuations.
5. Evaluate the Fund Manager
A skilled fund manager can make a huge difference in returns.
Experience matters: Check the manager’s track record over different market cycles.
Fund house reputation: Trust established fund houses with strong research capabilities.
Fund manager tenure: Frequent changes may indicate instability.
Pro tip: A strong fund manager is particularly important in actively managed equity and sectoral funds.
6. Expense Ratio and Fees
Costs directly reduce your returns.
Expense Ratio: Annual fee charged by the fund for managing your money. Lower is better.
Exit Load: Fee for selling before a certain period. Avoid high exit loads if you plan to stay flexible.
Tip: Compare expense ratios across similar funds. Even a 1% difference compounds over long-term investments.
7. Tax Implications
Mutual fund investments are subject to taxes. Understanding them helps in smart planning.
Equity Funds:
Short-term capital gains (STCG) – 15% if held ≤1 year
Long-term capital gains (LTCG) – 10% on gains above ₹1 lakh if held >1 year
Debt Funds:
STCG – Taxed as per income slab if held ≤3 years
LTCG – 20% with indexation if held >3 years
ELSS Funds:
Equity-linked savings scheme; 3-year lock-in; tax-saving benefit under Section 80C
Smart strategy: Use tax-efficient funds to reduce liabilities and increase net returns.
8. Diversification and Portfolio Strategy
Diversification reduces risk without sacrificing returns.
Across Asset Classes: Mix equity, debt, and hybrid funds.
Within Equity: Invest in large-cap, mid-cap, and small-cap funds.
Geographic Diversification: Some funds invest globally, reducing dependence on a single economy.
Example: A portfolio with 50% large-cap equity, 20% mid/small-cap, 20% debt, and 10% international equity balances growth and stability.
9. Check the Fund’s Investment Style
Understanding the fund’s style helps anticipate performance in different markets.
Equity Funds: Growth vs. Value, Large-cap vs. Mid-cap vs. Small-cap
Debt Funds: Duration strategy – short-term, medium-term, or long-term
Hybrid Funds: Equity-Debt ratio and rebalancing frequency
Pro tip: Align the style with market conditions and your risk tolerance.
10. Review Fund Ratings and Research Reports
Independent fund ratings provide a quick insight into quality.
Agencies: CRISIL, Morningstar, Value Research
Ratings reflect: Past performance, volatility, fund manager expertise, and consistency
Use as a guide: Not a sole decision factor
11. Monitor and Rebalance Regularly
Investing smartly doesn’t end at selection.
Track Performance: Review quarterly or semi-annually
Rebalance Portfolio: Adjust allocation as goals, risk tolerance, or market conditions change
Avoid Emotional Decisions: Don’t panic during market downturns; focus on long-term goals
12. SIPs vs. Lump Sum Investment
Systematic Investment Plans (SIPs) are generally safer for new investors.
SIP: Regular, smaller investments; reduces impact of market volatility via rupee-cost averaging
Lump Sum: One-time investment; better if markets are undervalued or for experienced investors
Smart choice: For beginners or long-term wealth creation, SIPs in equity or hybrid funds are ideal.
13. Beware of Marketing Hype
Avoid choosing funds based on:
Short-term performance or “hot” recommendations
Celebrity endorsements or ads
Peer pressure
Smart investors: Focus on fundamentals, not hype.
14. Tools to Aid Smart Selection
Several online platforms can help in research:
Morningstar, Value Research, Moneycontrol: Fund performance, ratings, comparison
Robo-advisors: Personalized fund recommendations based on risk profile and goals
Mutual fund apps: For SIPs, monitoring, and portfolio tracking
15. Case Study: Smart vs. Hasty Choice
Investor A: Chose fund based on last year’s 40% return. Fund dropped 25% next year → panic sold → loss realized.
Investor B: Analyzed 5-year performance, fund manager experience, risk-adjusted returns → consistent 12–15% returns → held long-term → wealth accumulation.
Lesson: Smart selection focuses on consistency, not short-term gains.
16. Final Checklist Before Investing
Define your goal and time horizon
Assess risk tolerance
Understand fund type and strategy
Analyze past performance and fund manager
Compare expense ratios and fees
Evaluate tax implications
Ensure diversification
Start with SIP or lump sum wisely
Monitor periodically and rebalance
Conclusion
Choosing mutual funds smartly is less about luck and more about informed decision-making. By understanding your goals, assessing risk, analyzing funds carefully, and maintaining discipline, investors can achieve consistent returns and long-term wealth creation. Smart investors don’t chase hype—they focus on research, planning, and patience. Mutual funds, when selected and managed intelligently, are a powerful tool for financial freedom.
Mastering Trade with Volume: The Hidden Key to Market Precision1. Understanding Volume in Trading
Volume refers to the total number of units traded for a particular asset within a given time period. It is commonly displayed as a histogram at the bottom of price charts. Volume tells traders how strong a price move is, and can provide insights into market psychology:
High volume often confirms trends or signals the climax of a move.
Low volume indicates weak conviction or a potential pause in the market.
Volume spikes can mark key turning points or breakout areas.
Volume is a measure of liquidity. Highly liquid markets with large volume enable smoother trading, while thin volume markets may show exaggerated price swings.
2. Why Volume Matters in Trading
Volume analysis is not just about counting trades—it’s about interpreting market intent. Here’s why it matters:
Confirming Trends: A rising price with increasing volume validates the uptrend. Conversely, a rising price on declining volume suggests weakening momentum.
Identifying Reversals: Sudden volume spikes during downtrends or uptrends often precede reversals.
Breakouts and Fakeouts: Breakouts from key support or resistance levels are more reliable when confirmed by volume.
Market Sentiment: Volume reveals the psychology of participants—buyers and sellers—showing whether a trend is driven by genuine interest or speculation.
3. Key Volume-Based Trading Tools
Several technical tools leverage volume to improve trading accuracy:
Volume Bars: The simplest tool, showing traded quantity per time period.
Volume Moving Average (VMA): Helps identify unusual volume relative to average.
On-Balance Volume (OBV): Cumulative measure of volume flow to detect buying/selling pressure.
Volume Price Trend (VPT): Combines price and volume to measure the strength of moves.
Volume Profile: Displays volume distribution across price levels to identify key zones of support/resistance.
Each of these tools offers traders a unique perspective on market dynamics and provides high-probability trade setups.
4. Volume and Market Structure
To trade effectively with volume, it’s critical to combine it with market structure analysis:
Support and Resistance: High volume near support/resistance confirms strong buying or selling interest.
Breakouts: Breakouts accompanied by volume spikes indicate genuine moves, while low-volume breakouts are likely false.
Trend Continuation: In an uptrend, higher volume on rallies and lower volume on pullbacks suggests a healthy trend.
Trend Exhaustion: When volume decreases at the end of a trend, it signals potential reversal or consolidation.
By aligning volume with price action and market structure, traders can filter noise and focus on high-confidence trades.
5. Volume Trading Strategies
Volume trading is highly adaptable across time frames, from intraday to long-term investing. Here are some proven strategies:
a) Volume Breakout Strategy
Identify key support or resistance levels.
Enter trades when price breaks out with above-average volume.
Use volume spikes to confirm the legitimacy of breakouts.
b) Volume Reversal Strategy
Look for extreme volume spikes after prolonged trends.
Price action with unusual volume may indicate trend exhaustion.
Combine with candlestick patterns or indicators for confirmation.
c) Volume Divergence Strategy
Compare volume trends with price trends.
If price rises but volume falls, it suggests weakening buying pressure.
Similarly, falling prices with declining volume may indicate sellers are losing control.
d) Volume-Weighted Average Price (VWAP) Strategy
VWAP shows average price based on volume and is widely used by institutional traders.
Traders can align entry and exit points with VWAP levels for better trade execution.
6. Psychological Insights from Volume
Volume analysis provides insights into market psychology:
Fear and Greed: Sudden surges in volume often reflect panic selling or aggressive buying.
Institutional Activity: Large volume spikes may indicate accumulation or distribution by institutional players.
Herd Behavior: Retail traders often follow price blindly, but volume analysis reveals true market participation.
Understanding these psychological cues helps traders anticipate future price action rather than reacting to it.
7. Combining Volume with Other Indicators
Volume works best in combination with other technical tools:
With Moving Averages: Confirms trend strength.
With RSI/Stochastic: Volume validates overbought/oversold conditions.
With Price Patterns: Breakouts, triangles, and flags are more reliable with volume confirmation.
With Market Depth: Combines volume data with order book analysis for precision.
8. Common Mistakes in Volume Trading
Even experienced traders make errors:
Ignoring Relative Volume: Not all volume is meaningful; compare with average levels.
Overtrading on Volume Spikes: Volume spikes without context can lead to false signals.
Neglecting Trend Context: Volume must be analyzed within the current market structure.
Misreading Low-Liquidity Markets: Thinly traded instruments may produce misleading volume patterns.
Avoiding these mistakes ensures that volume becomes a powerful ally, not a misleading signal.
9. Practical Examples
Breakout Example: A stock breaks resistance at ₹150 with 3x average volume. Traders who wait for volume confirmation are more likely to profit.
Reversal Example: A prolonged downtrend shows a sudden surge in buying volume at ₹100. This often signals the bottoming phase.
Divergence Example: Nifty rises to new highs, but OBV falls. This warns of a weakening rally, prompting traders to tighten stops or take profits.
10. Conclusion
Volume is often called the “lifeblood of trading” for a reason. It tells the story behind the price, revealing the strength, conviction, and psychology of market participants. Traders who master volume analysis gain a critical edge—identifying high-probability trades, confirming trends, and spotting reversals early. By combining volume with price action, market structure, and other technical indicators, traders can transform their approach from guesswork to precision trading.
Ultimately, volume is not just a number—it is the pulse of the market, and learning to read it effectively is one of the most powerful skills a trader can acquire.
Trends in the Equity Market1. Rise of Retail Participation
One of the most significant trends in recent years has been the surge of retail investors in the equity market. Traditionally dominated by institutional players, retail participation has grown due to:
Easy access through online trading platforms – Apps like Zerodha, Upstox, and Groww in India, and Robinhood in the US, have democratized investing.
Low brokerage fees and fractional investing – Small investors can now invest with minimal capital, diversifying their portfolios effectively.
Social media and community-driven investing – Platforms like Twitter, Reddit, and YouTube have fueled investment communities, leading to phenomena like meme stocks and coordinated retail rallies.
Impact: Retail participation increases market liquidity, adds volatility in certain stocks, and changes market sentiment faster than ever.
2. Technology-Driven Trading
Technological advancements have reshaped equity market operations, giving rise to new trading strategies:
Algorithmic trading: High-frequency trading (HFT) leverages algorithms to execute trades in milliseconds, impacting liquidity and price efficiency.
AI and machine learning: Predictive analytics and AI-driven stock recommendations help investors make data-backed decisions.
Blockchain and tokenized assets: Decentralized finance (DeFi) introduces tokenized stocks and fractional ownership, expanding access.
Impact: Technology accelerates decision-making, increases efficiency, and reduces human bias, but can also amplify sudden market moves during high volatility periods.
3. Sectoral Shifts and Investment Preferences
Equity markets evolve in response to macroeconomic cycles and technological innovation. Current sectoral trends include:
Technology and software: Cloud computing, AI, and fintech dominate investor attention.
Green energy and ESG: Renewable energy, electric vehicles, and ESG-compliant companies attract sustainable investment funds.
Consumer and healthcare: As disposable incomes rise and aging populations expand, consumer staples and healthcare continue to see robust growth.
Impact: Understanding sectoral shifts is crucial for portfolio diversification and identifying growth opportunities.
4. Global Influences on Domestic Markets
Equity markets no longer operate in isolation. Global factors significantly affect domestic equities:
Interest rate movements: Central bank policies in major economies influence capital flows and risk appetite.
Geopolitical developments: Conflicts, trade agreements, and sanctions can trigger sector-specific volatility.
Global economic cycles: Inflation, recessions, or commodity price swings can reshape equity valuations worldwide.
Impact: Investors must adopt a global perspective and hedge against systemic risks to protect portfolios.
5. Increased Focus on ESG Investing
Environmental, Social, and Governance (ESG) investing has moved from niche to mainstream:
Companies demonstrating strong ESG metrics often enjoy higher valuation premiums.
ESG-focused funds attract both retail and institutional money.
Regulatory frameworks in regions like Europe and India are increasingly mandating ESG disclosures.
Impact: ESG considerations now influence stock selection, corporate behavior, and long-term market trends.
6. Volatility and Market Sentiment
Equity markets are inherently volatile, but recent trends have amplified sentiment-driven fluctuations:
Behavioral finance influence: Fear, greed, and herd behavior can cause sudden price swings.
Events-driven volatility: Earnings surprises, policy changes, or economic shocks affect short-term trading patterns.
Use of derivatives: Options and futures increase market leverage, influencing volatility patterns.
Impact: Investors must combine technical analysis with market sentiment to navigate swings effectively.
7. Rise of Passive Investing and ETFs
Another major trend is the increasing dominance of passive investing:
Exchange-Traded Funds (ETFs) and index funds attract inflows due to low costs and broad market exposure.
Passive strategies reduce the influence of individual stock picking, shifting markets toward index-driven movements.
Institutional adoption of passive strategies has altered liquidity and valuation dynamics.
Impact: Passive investing has stabilized long-term returns but can lead to concentrated risk during market downturns.
8. Regulatory and Policy Trends
Government regulations play a critical role in shaping equity markets:
Capital market reforms: Simplified IPO processes, demat accounts, and trading technology have encouraged participation.
Tax incentives: Policies like long-term capital gains tax reforms influence investor behavior.
Global compliance: Regulations like MiFID II in Europe and SEBI guidelines in India ensure transparency and protect investors.
Impact: Regulatory trends influence market confidence, compliance costs, and investment strategies.
9. Market Integration and Cross-Border Investing
Investors increasingly diversify across geographies:
Mutual funds, global ETFs, and foreign portfolio investments enable exposure to international equities.
Correlation between global markets has increased; for instance, US Federal Reserve decisions affect Indian and Asian equities.
Currency fluctuations now directly impact returns for foreign investors.
Impact: Cross-border investing provides diversification but introduces currency and geopolitical risks.
10. Emerging Technologies and AI in Equity Analysis
The integration of AI and Big Data is transforming how equity markets operate:
Predictive analytics: Forecasting earnings, detecting anomalies, and assessing risk in real time.
Natural Language Processing (NLP): Analyzing news, earnings calls, and social media sentiment to predict market reactions.
Robo-advisors: Automated portfolio management using AI-driven insights.
Impact: AI reduces human error, enhances research efficiency, and allows more informed investment decisions.
11. Behavioral and Social Media Influences
Equity markets are increasingly influenced by social media trends:
Platforms like Reddit’s WallStreetBets can cause rapid price movements.
Viral investment stories often impact stocks without fundamental changes.
Public perception, amplified by social media, now drives trading behavior alongside traditional financial metrics.
Impact: Social-driven market movements highlight the importance of monitoring both fundamentals and sentiment indicators.
12. Future Outlook
The equity market continues to evolve:
Integration of technology and finance: AI, blockchain, and algorithmic trading will define market structure.
Sustainable investing: ESG and impact investing will guide corporate and investor decisions.
Global interconnectivity: Investors will increasingly need to monitor global macro trends, interest rates, and geopolitical developments.
Conclusion: Understanding trends in the equity market is crucial for successful investing. Retail participation, technological innovation, ESG focus, and global integration are reshaping how markets operate. Investors who adapt to these trends can position themselves for long-term growth while managing volatility and risk.

Algorithmic AI Trading SystemIntroduction
Algorithmic AI trading systems are transforming the financial markets by combining the power of algorithms, artificial intelligence (AI), and big data to make trading more efficient, precise, and profitable. Traditional trading relied heavily on human intuition and manual execution, which was slower and prone to errors. In contrast, AI-powered trading systems leverage complex mathematical models, machine learning, and real-time data analysis to execute trades automatically, often outperforming human traders in speed and accuracy.
The integration of AI in algorithmic trading has become crucial for institutions, hedge funds, and retail traders seeking competitive advantages in highly volatile and liquid markets.
1. Understanding Algorithmic Trading
Algorithmic trading, often called algo-trading, uses predefined rules and mathematical models to execute trades automatically. These rules are designed based on market data such as price, volume, and timing. The main features include:
Speed: Algorithms can execute orders in milliseconds, capitalizing on short-lived market opportunities.
Accuracy: Reduces human errors in execution, ensuring trades occur exactly as planned.
Cost Efficiency: Automation lowers operational costs and reduces slippage in high-frequency trades.
Types of Algorithmic Trading Strategies
Trend-Following Algorithms: Identify and follow market trends to generate profits.
Mean Reversion Algorithms: Trade based on the assumption that prices will return to their historical average.
Statistical Arbitrage: Exploit price inefficiencies between correlated assets.
High-Frequency Trading (HFT): Leverages milliseconds-level execution speed for arbitrage or market making.
While these strategies are effective, AI enhances them by incorporating machine learning and predictive analytics to adapt to changing market conditions.
2. Role of Artificial Intelligence in Trading
Artificial intelligence brings adaptability, predictive power, and self-learning capabilities to algorithmic trading. AI in trading generally involves:
Machine Learning (ML): Algorithms learn from historical and real-time data to predict future price movements.
Natural Language Processing (NLP): Analyzes news, earnings reports, and social media sentiment to inform trades.
Deep Learning: Identifies complex non-linear patterns in market data that traditional models might miss.
AI Applications in Trading
Predictive Analytics: AI models forecast asset price movements and volatility based on historical data.
Sentiment Analysis: NLP models assess market sentiment from financial news, tweets, or analyst reports.
Risk Management: AI continuously monitors market exposure, portfolio risks, and liquidity constraints.
Trade Execution Optimization: Machine learning adjusts order execution to minimize slippage and transaction costs.
By combining AI with algorithms, trading systems move from rule-based automation to adaptive intelligence, enabling smarter and faster decision-making.
3. Architecture of an AI Trading System
A robust AI trading system typically consists of four key components:
Data Acquisition Layer:
Gathers structured (price, volume) and unstructured data (news, social media).
Sources include market feeds, APIs, historical databases, and alternative datasets like satellite imagery or economic indicators.
Data Processing & Feature Engineering:
Cleans, normalizes, and transforms raw data into meaningful inputs for AI models.
Feature engineering is critical to highlight relevant signals for price prediction.
AI Modeling Layer:
Machine learning models such as Random Forests, Gradient Boosting, or LSTM neural networks predict price movements or detect anomalies.
Reinforcement learning can be used to optimize trading strategies over time based on rewards and penalties.
Execution & Monitoring Layer:
Converts AI-generated signals into actionable trades using low-latency order execution engines.
Continuously monitors market conditions, system performance, and risk exposures.
4. Benefits of Algorithmic AI Trading
Speed and Efficiency: AI systems process vast datasets and execute trades far faster than humans.
24/7 Market Monitoring: AI can continuously monitor multiple markets without fatigue.
Data-Driven Decisions: Eliminates emotional bias from trading, relying on objective, statistical analysis.
Adaptive Strategies: Machine learning allows strategies to evolve with changing market dynamics.
Risk Minimization: Predictive models and real-time monitoring help prevent major losses.
5. Challenges and Risks
Despite its advantages, algorithmic AI trading comes with risks:
Overfitting: AI models trained on historical data may fail in live market conditions.
Market Impact: High-frequency trades may inadvertently affect market prices.
Data Quality Issues: Inaccurate or incomplete data can lead to wrong trading decisions.
Cybersecurity Risks: AI systems are vulnerable to hacking or manipulation.
Regulatory Compliance: Algorithmic and AI-driven trades are under strict regulatory scrutiny in many markets.
Traders must balance innovation with caution, ensuring robust risk management and compliance protocols.
6. Popular AI Trading Strategies
Reinforcement Learning for Portfolio Optimization:
AI agents learn to maximize portfolio returns while minimizing risk using reward-based learning.
Sentiment-Based Trading:
NLP algorithms analyze news and social media sentiment to predict price trends.
Algorithmic Arbitrage:
AI identifies temporary price discrepancies across exchanges for profit.
Predictive Modeling for Volatility:
AI forecasts market volatility, enabling traders to hedge positions effectively.
Hybrid Models:
Combines technical indicators, fundamental data, and sentiment analysis for holistic decision-making.
7. Case Studies and Real-World Applications
Hedge Funds and Investment Banks:
Firms like Renaissance Technologies and Goldman Sachs use AI-driven strategies to outperform traditional market approaches.
Retail Trading Platforms:
AI-powered trading bots for retail investors provide automated signal generation and trade execution.
Cryptocurrency Markets:
AI systems exploit the high volatility of crypto markets to generate consistent returns.
Alternative Data Utilization:
AI can analyze satellite imagery, weather data, or shipping patterns to predict commodity prices or stock movements.
8. The Future of AI in Trading
The AI trading landscape is evolving rapidly:
Explainable AI: Traders demand transparency in AI-driven decisions to trust automated systems.
Cross-Asset Integration: AI systems will increasingly manage multi-asset portfolios, including stocks, crypto, and derivatives.
Quantum Computing: May accelerate AI algorithms, enabling near-instantaneous market analysis.
Regulatory Evolution: Regulators are developing frameworks to monitor and manage AI-driven trading risks.
The future points toward AI-driven systems that are smarter, faster, more adaptive, and capable of operating across global markets seamlessly.
Conclusion
Algorithmic AI trading systems represent a paradigm shift in financial markets. By combining computational speed, adaptive intelligence, and vast data processing capabilities, these systems are setting new benchmarks for efficiency, profitability, and risk management. While challenges like overfitting, cybersecurity risks, and regulatory hurdles exist, the potential benefits for investors and institutions are immense.
AI in trading is not just about automation; it is about building systems that think, learn, and adapt—ushering in a new era where data-driven intelligence shapes the future of finance.
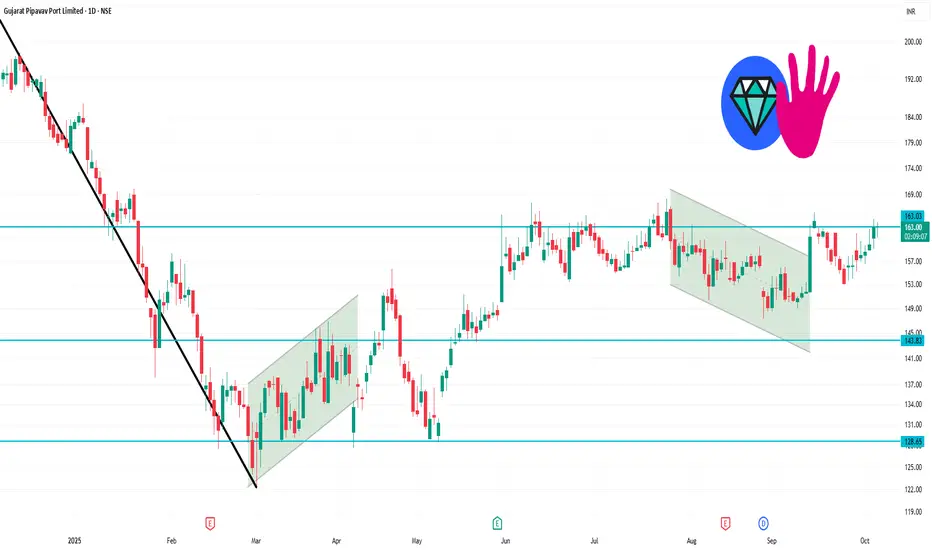
GPPL 1 Day Time Frame 📊 Support & Resistance Levels
Classic Pivot Points:
Support (S1): ₹156.60
Resistance (R1): ₹163.20
Pivot Point (PP): ₹158.45
Fibonacci Levels:
Support: ₹157.19 (50% retracement)
Resistance: ₹160.49 (61.8% retracement)
Camarilla Levels:
Support (S1): ₹161.58
Resistance (R1): ₹164.56
These levels are calculated based on the previous day's high, low, and close prices.
Top Stock Research
📈 Technical Indicators
Relative Strength Index (RSI): 58.6 — Indicates a neutral stance, neither overbought nor oversold.
Moving Average Convergence Divergence (MACD): 1.04 — Suggests a buy signal, indicating potential bullish momentum.
Average Directional Index (ADX): 13.98 — Reflects a weak trend, suggesting indecision in the market.
Commodity Channel Index (CCI): 75.98 — Neutral, showing no strong trend direction.
Rate of Change (ROC): -0.84 — Indicates a slight bearish momentum.
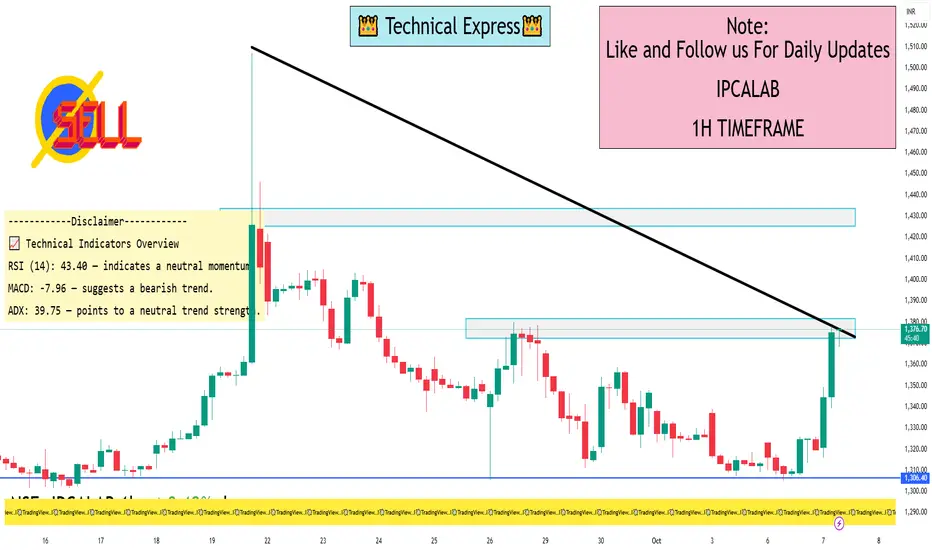
IPCALAB 1 Hour View📊 1-Hour Timeframe: Support & Resistance Levels
Based on recent intraday data, here are the key support and resistance levels for IPCA Laboratories Ltd. on the 1-hour timeframe:
🔽 Support Levels:
S1: ₹1,324.36
S2: ₹1,323.13
S3: ₹1,322.06
🔼 Resistance Levels:
R1: ₹1,326.66
R2: ₹1,327.73
R3: ₹1,328.96
These levels are derived from standard pivot point calculations and are widely used by traders to identify potential reversal points.
📈 Technical Indicators Overview
RSI (14): 43.40 — indicates a neutral momentum.
MACD: -7.96 — suggests a bearish trend.
ADX: 39.75 — points to a neutral trend strength.
Moving Averages:
5-period EMA: ₹1,325.64 — indicates a buy signal.
50-period EMA: ₹1,352.22 — suggests a sell signal.
200-period EMA: ₹1,351.26 — indicates a sell signal.
Pivot Points:
Pivot: ₹1,325.43
R1: ₹1,326.66
S1: ₹1,324.36
These indicators collectively suggest a cautious outlook for short-term traders, with a prevailing bearish sentiment.
Market Swings, Inflation, and Interest Rates1. Market Swings: The Pulse of Financial Markets
Market swings, also known as market volatility, refer to the rapid and sometimes unpredictable fluctuations in asset prices. These swings can occur in stock markets, bond markets, commodities, or foreign exchange markets. They are driven by a combination of factors including economic data, geopolitical events, corporate earnings, investor sentiment, and macroeconomic policies.
Volatility is a natural part of financial markets. While minor fluctuations are expected, extreme swings often signal underlying instability or heightened uncertainty. For instance, a sudden drop in stock prices may be triggered by negative employment data, unexpected changes in central bank policies, or geopolitical tensions. Conversely, rapid upward swings can result from strong economic indicators, corporate profitability, or liquidity injections by central banks.
Understanding market swings requires recognizing that they are often a reflection of investor psychology as much as economic fundamentals. Fear and greed can amplify price movements, creating feedback loops that exacerbate market volatility.
2. Inflation: The Erosion of Purchasing Power
Inflation is the rate at which the general level of prices for goods and services rises, thereby eroding purchasing power. It is a critical macroeconomic variable because it directly impacts consumer behavior, corporate profitability, and investment decisions. Moderate inflation is considered healthy for the economy, as it encourages spending and investment. However, high inflation can destabilize markets, reduce real returns on investments, and create uncertainty about future economic conditions.
Inflation is measured using indices such as the Consumer Price Index (CPI) and the Producer Price Index (PPI). Persistent increases in these indices indicate that the cost of living is rising, which can lead to tighter monetary policy. For investors, rising inflation often leads to higher volatility in equities, bonds, and commodities. Certain sectors, like consumer staples and utilities, may perform relatively better during inflationary periods due to consistent demand, while growth-oriented sectors may suffer.
3. Interest Rates: The Cost of Money
Interest rates, determined primarily by central banks, represent the cost of borrowing money. They influence every aspect of the economy, from corporate investments to consumer spending. When central banks increase interest rates, borrowing becomes more expensive, which can slow economic activity. Conversely, lower interest rates encourage borrowing and investment but can also contribute to higher inflation.
Interest rates are closely tied to market swings and inflation. For example, when inflation rises unexpectedly, central banks may increase interest rates to cool down the economy. This can lead to sudden market adjustments, especially in interest-sensitive sectors such as real estate, banking, and technology. Conversely, during economic slowdowns, central banks often reduce interest rates to stimulate growth, which can drive equity markets higher.
4. The Interplay Between Market Swings, Inflation, and Interest Rates
The relationship between market swings, inflation, and interest rates is complex and cyclical. Inflation often drives central banks’ interest rate decisions, which in turn impact market volatility.
Inflation → Interest Rate Adjustment → Market Reaction: Rising inflation typically prompts central banks to increase interest rates to curb spending. This often results in market sell-offs, as higher rates increase borrowing costs for businesses and reduce consumer spending, impacting corporate profits.
Interest Rates → Market Liquidity → Market Swings: Lower interest rates generally increase liquidity in the market, encouraging investments in riskier assets like stocks and real estate. Conversely, higher interest rates can reduce liquidity, leading to increased volatility as investors reassess risk and reallocate assets.
Market Swings → Inflation Expectations → Policy Decisions: Significant market swings can influence inflation expectations. For instance, a sudden spike in commodity prices can heighten inflation fears, prompting central banks to intervene with policy adjustments.
5. Case Studies of Market Swings Influenced by Inflation and Interest Rates
The 1970s Stagflation: During the 1970s, the U.S. experienced high inflation combined with stagnant economic growth. Interest rates were raised to control inflation, leading to significant market volatility and prolonged economic uncertainty.
The 2008 Global Financial Crisis: Preceding the crisis, low-interest rates encouraged excessive borrowing and speculative investments. When the housing bubble burst, market swings were amplified, and inflationary pressures emerged briefly in certain sectors.
COVID-19 Pandemic Market Reactions: In 2020, global markets experienced extreme swings due to the pandemic. Central banks reduced interest rates to near-zero levels, injecting liquidity into markets. Inflation remained low initially but surged in 2021–2022, causing renewed volatility as central banks adjusted rates upward.
6. Sectoral Impact of Inflation and Interest Rate Changes
Different sectors respond uniquely to market swings driven by inflation and interest rates:
Technology and Growth Stocks: Highly sensitive to interest rate hikes because future earnings are discounted more heavily.
Consumer Staples and Utilities: Typically resilient during inflationary periods due to consistent demand.
Financials: Benefit from higher interest rates through improved net interest margins but may suffer if higher rates reduce loan demand.
Commodities: Often act as a hedge against inflation, but can experience volatility due to geopolitical risks and supply-demand imbalances.
7. Strategies for Investors Amid Market Swings
Investors can employ several strategies to navigate the intertwined effects of market swings, inflation, and interest rates:
Diversification: Spreading investments across sectors and asset classes reduces exposure to volatility.
Hedging: Using derivatives or inflation-protected securities to mitigate risks.
Monitoring Central Bank Signals: Paying close attention to monetary policy statements and inflation data to anticipate interest rate changes.
Value vs. Growth Balancing: Allocating between growth and value stocks based on interest rate and inflation trends.
Commodities and Real Assets: Incorporating gold, real estate, or commodities as a hedge against inflation.
8. Global Implications and Policy Considerations
The interplay of market swings, inflation, and interest rates is not confined to a single country. Global capital flows, trade dynamics, and foreign exchange markets amplify these effects across borders. For instance, interest rate hikes in the U.S. can lead to capital outflows from emerging markets, triggering currency depreciation and local market swings. Policymakers must balance inflation control with growth objectives, often navigating difficult trade-offs.
9. The Role of Technology and AI in Predicting Market Movements
Advances in technology, data analytics, and AI are helping investors and institutions better anticipate market swings. By analyzing inflation trends, interest rate projections, and historical market reactions, AI-driven models can provide probabilistic forecasts, aiding in more informed investment decisions. These tools, however, cannot eliminate risk entirely, especially during unprecedented shocks or black swan events.
10. Conclusion
Market swings, inflation, and interest rates are inseparable forces shaping the global financial landscape. Their interaction determines the rhythm of markets, influencing investment strategies, economic growth, and financial stability. For investors and policymakers, understanding these dynamics is crucial to navigating volatility and making strategic decisions. While the future is inherently uncertain, careful monitoring of inflationary trends, interest rate policies, and market signals can provide a roadmap for managing risk and capitalizing on opportunities in a complex economic environment.

AI Trading Profits: Unlocking the Future of Smart Market Gains1. Understanding AI Trading
AI trading refers to the use of machine learning, natural language processing, and advanced algorithms to make trading decisions. Unlike traditional trading, which relies on human intuition, AI trading analyzes massive datasets in real-time, identifies patterns, and executes trades with precision. AI systems are capable of learning from historical data, adapting to changing market conditions, and continuously improving their performance.
Key components include:
Data acquisition: Collecting historical and real-time financial data.
Pattern recognition: Using machine learning to identify profitable trends.
Execution algorithms: Automatically placing trades based on AI predictions.
Risk management: Monitoring positions and adjusting strategies dynamically.
2. Sources of AI Trading Profits
AI trading profits come from multiple sources, often simultaneously:
a. Arbitrage Opportunities
AI can identify price discrepancies across markets faster than humans. For example, slight differences in currency pairs or stock prices between exchanges can be exploited within milliseconds, yielding small but highly consistent profits.
b. Predictive Market Analysis
AI models can forecast price movements using historical data, news sentiment, macroeconomic indicators, and social media trends. By predicting short-term or long-term trends, traders can enter and exit positions at optimal moments.
c. High-Frequency Trading (HFT)
AI enables high-frequency trading, executing thousands of trades per second. This leverages micro-movements in asset prices to generate cumulative profits over time.
d. Sentiment Analysis
Modern AI models analyze news articles, social media, and financial reports to gauge market sentiment. Positive or negative sentiment can trigger AI-based trading strategies that anticipate market reactions.
3. AI Trading Strategies That Drive Profits
AI trading profits are heavily influenced by the strategies employed:
Trend-Following Algorithms: AI detects upward or downward price trends and automatically adjusts positions.
Mean Reversion Models: Identifying when an asset is overbought or oversold and betting on a return to the mean.
Reinforcement Learning Systems: AI learns optimal trading actions through trial-and-error simulations.
Neural Network Predictive Models: Deep learning models analyze complex data patterns to predict future price movements.
Portfolio Optimization Algorithms: AI balances risk and return by continuously reallocating assets across diverse instruments.
4. Advantages of AI in Trading Profits
Speed and Accuracy: AI can analyze vast data in milliseconds, far faster than human traders.
Emotionless Trading: AI removes emotional biases that often lead to trading mistakes.
24/7 Market Monitoring: AI can operate continuously in global markets.
Adaptive Learning: Machine learning models improve over time, refining strategies.
Scalability: AI can simultaneously trade multiple markets and instruments.
5. Challenges and Risks in AI Trading
While AI offers significant profit potential, risks remain:
Data Quality Issues: Poor or biased data can lead to incorrect predictions.
Overfitting: AI models may perform well in simulations but fail in live markets.
Market Volatility: Sudden market shocks can overwhelm AI systems.
Regulatory Constraints: Certain jurisdictions impose rules on automated trading.
Ethical Concerns: AI-driven market manipulation risks exist if not properly monitored.
6. Case Studies of AI Trading Profits
Hedge Funds: Quantitative hedge funds like Renaissance Technologies and Two Sigma generate billions annually using AI-driven strategies.
Retail Traders: Platforms using AI-assisted trading tools allow retail traders to capture profitable signals.
Cryptocurrency Markets: AI is used extensively in crypto trading to exploit high volatility and sentiment-driven price swings.
7. Future Outlook of AI Trading Profits
The future of AI trading promises even greater profitability as technology advances:
Integration of Alternative Data: Satellite imagery, social trends, and IoT data will refine AI predictions.
AI-Driven Risk Management: Advanced AI models will optimize risk-adjusted returns.
Global Market Connectivity: AI will seamlessly trade across borders, currencies, and asset classes.
Hybrid Human-AI Models: Traders will increasingly use AI as an assistant, combining human intuition with machine precision.
Conclusion
AI trading profits represent a paradigm shift in financial markets. By leveraging speed, accuracy, predictive capabilities, and advanced strategies, AI transforms how profits are generated. However, success depends on high-quality data, robust algorithms, and continuous monitoring. For traders, institutions, and investors, AI is no longer optional—it is the key to achieving consistent, scalable, and intelligent market gains.
AI Predicts Market Moves1. The Foundation: How AI Understands Market Behavior
AI predicts market movements by analyzing enormous amounts of structured and unstructured data. Unlike traditional models that rely on past prices and fixed formulas, AI adapts dynamically to changing market conditions.
Here’s how the process works:
Data Collection: AI systems gather information from multiple sources — stock prices, volumes, social media sentiment, macroeconomic indicators, corporate filings, and even satellite images.
Feature Engineering: Machine learning algorithms identify key features (price momentum, volatility, correlations) that may impact future movements.
Model Training: AI models, especially deep learning networks, are trained using historical data to learn patterns that precede bullish or bearish trends.
Prediction: The trained model predicts probable outcomes, such as price direction, volatility range, or breakout levels.
Feedback Loop: The system continuously learns from real-time data, refining its accuracy over time.
This self-learning nature makes AI a powerful force in financial prediction, as it becomes more accurate and efficient the longer it operates.
2. Machine Learning Models That Power Market Predictions
Several AI techniques are used to predict market movements. Each serves a unique role depending on the type of market data and the trading objective.
A. Supervised Learning
Supervised models are trained on labeled data (e.g., past price data with known outcomes). Common algorithms include:
Linear and Logistic Regression: Useful for basic price trend forecasts.
Random Forests and Gradient Boosting: Handle complex, nonlinear relationships between variables.
Support Vector Machines (SVM): Ideal for identifying trend reversals.
B. Unsupervised Learning
Unsupervised models detect hidden patterns without pre-labeled outcomes.
Clustering (e.g., K-means): Groups similar stocks or market behaviors.
Principal Component Analysis (PCA): Reduces data complexity to identify dominant market factors.
C. Deep Learning and Neural Networks
These models simulate how the human brain processes information.
Recurrent Neural Networks (RNNs) and LSTM (Long Short-Term Memory): Designed to analyze sequential data like time series, making them perfect for price prediction.
Convolutional Neural Networks (CNNs): Surprisingly effective for pattern recognition in candlestick charts or heatmaps.
Transformers (like those used in ChatGPT): Emerging models that can process multiple forms of data — text, numbers, sentiment — simultaneously for market insight.
D. Reinforcement Learning
In this model, AI acts as an agent that learns by taking actions and receiving feedback (reward or penalty). It’s widely used in algorithmic trading to optimize execution strategies or portfolio balancing.
3. Sentiment Analysis: Reading the Market’s Mood
The market is not purely mathematical — it’s emotional. Investor sentiment can drive markets up or down faster than fundamentals. AI sentiment analysis decodes these emotions from textual and social data sources.
Natural Language Processing (NLP) allows AI to read news articles, analyst reports, earnings calls, and social media posts.
By detecting tone and language, AI gauges whether market sentiment is bullish, bearish, or neutral.
Sentiment data is then quantified and fed into predictive models to anticipate short-term movements.
For example, a sudden surge in positive social media mentions about a stock may indicate upcoming bullish momentum. Conversely, a negative news trend could trigger an early warning for a price drop.
4. Big Data Meets AI: The New Market Edge
Market prediction used to depend primarily on numerical data — prices, volumes, and indicators. Today, AI uses big data to analyze patterns across multiple dimensions simultaneously.
Key data types AI analyzes include:
Price and Volume Data: Traditional market information.
Fundamental Data: Balance sheets, earnings reports, P/E ratios.
Macroeconomic Data: Inflation, interest rates, GDP growth.
Alternative Data: Satellite imagery (e.g., tracking retail traffic), credit card spending, or shipping volumes.
Behavioral Data: Search engine trends, social media posts, and online sentiment.
AI’s ability to merge these data types into a single predictive framework creates a far more holistic understanding of market dynamics — something human analysts can’t achieve manually.
5. High-Frequency Trading (HFT) and Predictive Algorithms
AI plays a crucial role in high-frequency trading, where thousands of trades occur in milliseconds. Here, even a microsecond advantage can yield significant profits.
AI systems in HFT:
Predict short-term price fluctuations based on market microstructures.
Execute trades automatically using reinforcement learning strategies.
Continuously adapt to new data and refine models to maintain a competitive edge.
For instance, if AI detects a sudden imbalance between buy and sell orders, it might predict a short-term breakout and place rapid-fire orders to capitalize on the move — all before human traders can react.
6. Predictive Portfolio Management and Risk Control
AI doesn’t just forecast prices; it predicts risk. Predictive portfolio models use AI to optimize allocations by analyzing correlations, volatility, and macroeconomic scenarios.
Predictive Asset Allocation: AI forecasts which assets are likely to outperform under certain conditions.
Dynamic Hedging: Machine learning models predict downside risk and automatically adjust hedges using derivatives.
Anomaly Detection: AI identifies abnormal price movements that may indicate fraud, manipulation, or systemic instability.
This predictive capability helps fund managers stay one step ahead of uncertainty, minimizing losses and enhancing long-term returns.
7. AI-Powered Tools Used by Traders
The global trading ecosystem now hosts numerous AI-based tools and platforms that help traders predict and react faster.
Examples include:
Bloomberg Terminal AI: Integrates NLP to summarize financial news instantly.
Kavout’s Kai Score: AI-driven stock ranking system.
Upstox and Zerodha (India): Implement algorithmic and data-driven recommendations powered by AI analytics.
AlphaSense: Scans millions of financial documents to detect sentiment and trends.
Even retail traders can now use AI-based trading bots that combine technical indicators, sentiment data, and reinforcement learning to generate predictive insights.
8. Limitations and Risks of AI Predictions
While AI has immense potential, it’s not infallible. Market predictions are inherently uncertain, and several challenges remain:
Black-Box Models: Deep learning models often lack transparency. Traders may not understand why a prediction was made.
Data Bias: If training data is skewed or incomplete, predictions may be inaccurate.
Overfitting: Models may perform well on past data but fail in new, unseen conditions.
Market Manipulation Risks: Predictive AI can be exploited by bad actors who manipulate data sources.
Flash Crashes: Rapid automated trading decisions can trigger sudden market collapses, as seen in past HFT incidents.
Thus, while AI enhances prediction power, it must be used responsibly, with human oversight and ethical guardrails.
9. The Human-AI Partnership in Trading
Despite automation, human intuition still matters. The most successful traders today combine AI-driven insights with human experience.
AI handles the data overload, filtering millions of variables into actionable signals.
Humans interpret context, political events, and macroeconomic nuances that models might miss.
Hybrid Strategies — where AI predicts and humans confirm — are proving to be the most effective approach for modern trading.
This collaboration ensures that traders harness the computational power of AI without losing the strategic foresight that only human judgment provides.
10. The Future of AI Market Predictions: What Lies Ahead
The next generation of AI in trading will go beyond prediction — it will move toward autonomous financial decision-making.
Emerging trends include:
Quantum AI Trading: Combining quantum computing with AI to handle even more complex datasets.
Generative AI Models: Creating simulated market scenarios for predictive testing.
Explainable AI (XAI): Making black-box models transparent so traders understand the “why” behind predictions.
Emotion AI: Measuring real-time trader sentiment through voice and facial analysis for behavioral prediction.
Global Integration: AI systems linking across markets — equities, commodities, forex, and crypto — for unified predictive analysis.
By 2030, it’s expected that over 70% of all trades globally will be AI-assisted or AI-driven, making machine intelligence the core of the financial ecosystem.
Conclusion: The Predictive Revolution in Trading
AI has evolved from being a buzzword to becoming the backbone of market prediction and trading. Its ability to process massive datasets, identify hidden correlations, and forecast potential moves with remarkable accuracy is transforming the very structure of financial markets.
Yet, while AI can predict patterns and probabilities, it cannot guarantee certainty — because markets are influenced by human behavior, policy shifts, and black swan events that defy logic.
The key lies in balance: leveraging AI’s speed, precision, and learning capability while maintaining human control and intuition. As AI continues to mature, those who adapt early — blending technology with insight — will dominate the next generation of global trading.

AVANTEL 1 Week Time Frame📈 Price Performance (1 Week)
Current Price: ₹202.29
Weekly Change: +11.61%
52-Week Range: ₹95.51 – ₹211.79
📊 Technical Indicators
Moving Averages
20-Day EMA: ₹173.47
50-Day EMA: ₹160.46
100-Day EMA: ₹151.62
200-Day EMA: ₹144.58
Current Price vs. EMAs: The current price is above all major EMAs, indicating a bullish trend.
Relative Strength Index (RSI)
14-Day RSI: 59.26
Interpretation: The RSI is in the neutral zone (50–70), suggesting neither overbought nor oversold conditions.
Moving Average Convergence Divergence (MACD)
MACD Value: 9.44
Signal: Positive MACD indicates upward momentum.
Stochastic RSI
Value: 53.95
Interpretation: Neutral, with no immediate overbought or oversold signals.
🔍 Summary
Trend: Bullish
Indicators: Most technical indicators are aligned with a positive outlook.
Resistance Levels: ₹211.79 (52-week high)
Support Levels: ₹173.47 (20-day EMA)
Commodity MCX Trading1. Overview of MCX and Commodity Trading
The Multi Commodity Exchange (MCX) is India’s premier commodity derivatives exchange, offering futures trading in metals, energy, and agricultural commodities. It was established to provide a transparent and regulated platform for trading commodities, mitigating the risks associated with price volatility.
Key Features:
Futures contracts for commodities
Price discovery mechanism
Hedging opportunities for producers and consumers
Regulated by the Securities and Exchange Board of India (SEBI)
MCX trading allows participants to speculate on price movements or hedge against potential losses in commodity prices. Commodities traded on MCX are divided into precious metals, base metals, energy commodities, and agricultural commodities.
2. Types of Commodities Traded on MCX
MCX offers a variety of commodities under different categories:
Precious Metals: Gold, Silver, Platinum, and Palladium
Base Metals: Copper, Aluminium, Zinc, Lead, Nickel
Energy Commodities: Crude Oil, Natural Gas, Petrol, Diesel
Agricultural Commodities: Cotton, Cardamom, Jeera, Turmeric
Each commodity has specific contracts with defined lot sizes, expiry dates, and tick sizes, providing structured opportunities for traders.
3. Understanding MCX Trading Mechanism
MCX operates on a futures-based trading system. In futures trading, traders agree to buy or sell a commodity at a predetermined price on a future date.
How it works:
Contract Selection: Traders choose the commodity and the expiry month.
Order Placement: Buy or sell orders are placed through brokers registered with MCX.
Margin Requirement: Traders deposit an initial margin to cover potential losses.
Settlement: Contracts are cash-settled or physically delivered at expiry, depending on the commodity.
MCX trading is electronic, ensuring transparency, liquidity, and real-time price discovery.
4. Role of Leverage and Margins
MCX trading involves leverage, which allows traders to control a large value of commodities with a relatively small margin.
Key Points:
Initial Margin: Required to open a position, varies by commodity and market volatility.
Mark-to-Market (MTM): Daily profit or loss adjustments based on closing prices.
Leverage Risk: High leverage can magnify gains but also increases potential losses.
Understanding margin requirements is critical to managing risks effectively in MCX trading.
5. Hedging and Speculation
MCX is used by both hedgers and speculators:
Hedgers: Producers, exporters, and manufacturers use MCX to mitigate price risks. Example: A gold jeweler may hedge against future price rises by buying gold futures.
Speculators: Traders aiming to profit from price fluctuations, often using technical and fundamental analysis to identify trading opportunities.
Hedging ensures stability for businesses, while speculation adds liquidity to the market.
6. Analysis Techniques in MCX Trading
Successful MCX trading relies on technical and fundamental analysis:
Technical Analysis: Uses charts, indicators, and patterns to predict price movements. Common tools include Moving Averages, RSI, MACD, and Bollinger Bands.
Fundamental Analysis: Focuses on supply-demand dynamics, geopolitical events, weather conditions, and macroeconomic factors affecting commodity prices.
A combination of both approaches helps traders make informed decisions.
7. Risk Management in Commodity Trading
Commodity trading carries inherent risks due to price volatility. Effective risk management strategies include:
Stop-loss Orders: Limit potential losses on a position.
Position Sizing: Allocate capital according to risk tolerance.
Diversification: Trade multiple commodities to spread risk.
Regular Monitoring: Keep track of global events, inventory reports, and currency fluctuations.
Risk management is crucial for both short-term and long-term traders.
8. Benefits and Challenges of MCX Trading
Benefits:
High liquidity and transparent trading platform
Opportunities for hedging and speculation
Potential for profit in rising or falling markets
Structured contracts with standardized specifications
Challenges:
High volatility and market risk
Requires understanding of complex derivative contracts
Leverage can magnify losses
Dependence on global commodity trends and geopolitical events
MCX trading offers opportunities for wealth creation but requires discipline, knowledge, and strategy.
Conclusion
MCX commodity trading is an essential tool for hedging, price discovery, and speculative profit in India. With the right analysis, risk management, and disciplined approach, traders can leverage the platform effectively. Understanding contract specifications, margins, market drivers, and trading psychology is crucial for success in the volatile commodity markets.