PHOENIXLTD 1 Week Time Frame📌 Current weekly reference price: ~₹1,730–₹1,740 on NSE (updated latest).
📊 Weekly Pivot & Key Levels (Most Recent)
▶️ Weekly Pivot Point
Weekly Pivot (Standard): ₹1,768.93 (central reference for the week)
📈 Weekly Resistance Levels
(Upside levels where price may face selling pressure)
1. R1: ~₹1,818.67 – first major resistance zone this week
2. R2: ~₹1,910.83 – secondary resistance on extended upside
3. R3: ~₹1,960.57 – deep stretch resistance if bullish momentum builds
Interpretation:
A weekly close above ₹1,818–₹1,820 would suggest strength and bullish continuation into higher zones.
Strong upside momentum could target tier‑2 and tier‑3 resistance levels above ₹1,900.
📉 Weekly Support Levels
(Key downside levels where price may find buying interest)
1. S1: ~₹1,676.77 – immediate support if price dips from current levels
2. S2: ~₹1,627.03 – deeper zone of support below S1
3. S3: ~₹1,534.87 – medium‑term support zone, stronger base area
Interpretation:
If price confirms a break below weekly support ₹1,676–₹1,680, it increases the likelihood of further correction toward ₹1,627 and then ~₹1,535.
📌 Summary — Weekly Price Action Framework
Bullish Scenario (weekly view):
Price sustains above pivot ~₹1,768–₹1,770
Breaks ₹1,818–₹1,820 weekly resistance
➡️ Upside target zones: ₹1,910 → ₹1,960+
Bearish/Neutral Scenario (weekly view):
Weekly close below ₹1,676–₹1,680 support
➡️ Downside zones: ₹1,627 → ₹1,535
Tradingideas

Part 2 Institutional Trading Vs. Technical AnalysisWhat Is an Option Contract?
An option contract is a legal agreement that gives the buyer the right, but not the obligation, to buy or sell an underlying asset at a predetermined price within a specified time period.
Each option contract has four essential components:
Underlying Asset – Stock, index, commodity, currency, etc.
Strike Price – The price at which the underlying can be bought or sold.
Expiration Date – The date when the option contract expires.
Premium – The price paid by the option buyer to the seller (writer).
There are two parties in every option trade:
Option Buyer (Holder) – Pays the premium, has rights.
Option Seller (Writer) – Receives the premium, has obligations.

Part 1 Institutional Trading Vs. Technical Analysis Introduction to Option Trading
Option trading is one of the most powerful and flexible tools available in modern financial markets. Unlike traditional stock investing, where profits depend mainly on price movement in one direction, option trading allows traders to benefit from price movement, time decay, volatility changes, and even price stagnation.
An option is a derivative instrument, meaning its value is derived from an underlying asset such as stocks, indices, commodities, currencies, or ETFs. Options are widely used by retail traders, institutional investors, hedge funds, and market makers for speculation, hedging, income generation, and risk management.
The key appeal of options lies in their leverage, defined risk (for buyers), strategic flexibility, and adaptability across market conditions—bullish, bearish, or sideways.

How to Control Trading Risk1. Understand That Risk Is Inevitable
Risk cannot be eliminated; it can only be managed.
Every trade has uncertainty
Losses are part of the business
Winning traders accept losses calmly and systematically
The goal is not to avoid losses, but to keep losses small and controlled while allowing profits to grow.
2. Risk Only a Fixed Percentage of Capital
One of the most important rules in trading is position sizing.
Risk 1–2% of total capital per trade
Never risk more than 5% on a single trade
Smaller risk ensures survival during losing streaks
Example:
Capital = ₹5,00,000
Risk per trade = 1% = ₹5,000
No matter the setup, your maximum loss must stay near ₹5,000.
This rule prevents emotional decisions and large drawdowns.
3. Always Use a Stop-Loss
A stop-loss is non-negotiable.
Defines maximum loss before entering the trade
Protects against sudden volatility and news
Removes emotional decision-making
Types of stop-loss:
Fixed stop-loss – based on price level
Technical stop-loss – below support or above resistance
Volatility stop-loss – based on ATR or price range
Trailing stop-loss – locks profits as price moves
A trade without a stop-loss is gambling, not trading.
4. Maintain a Positive Risk-Reward Ratio
Risk-reward ratio (RRR) compares potential loss vs potential gain.
Ideal minimum: 1:2
Professional traders prefer 1:3 or higher
Even with 40% win rate, positive RRR keeps you profitable
Example:
Risk = ₹1,000
Reward = ₹3,000
Win 4 out of 10 trades → still profitable
Never enter trades where reward is smaller than risk.
5. Avoid Overtrading
Overtrading is one of the biggest silent account killers.
Causes:
Revenge trading
Fear of missing out (FOMO)
Trading out of boredom
Chasing losses
Solutions:
Trade only high-probability setups
Set daily and weekly trade limits
Stop trading after reaching max daily loss
Quality of trades matters far more than quantity.
6. Control Leverage Carefully
Leverage magnifies both profits and losses.
High leverage reduces margin for error
Small price moves can wipe out capital
Beginners should use minimal leverage
Risk rules with leverage:
Reduce position size when using leverage
Never increase leverage to recover losses
Understand margin requirements clearly
Leverage should be used as a tool, not a shortcut to riches.
7. Diversify, But Do Not Over-Diversify
Diversification reduces risk, but excess diversification dilutes focus.
Avoid putting all capital in one stock or sector
Trade different instruments cautiously
Avoid correlated trades (same direction, same sector)
Bad diversification:
Long multiple banking stocks during sector weakness
Good diversification:
Different sectors, timeframes, and strategies
8. Follow a Written Trading Plan
A trading plan is your risk management blueprint.
It should include:
Entry rules
Exit rules
Stop-loss method
Position sizing
Risk per trade
Daily and weekly loss limits
Without a plan, emotions control decisions.
With a plan, risk becomes measurable and repeatable.
9. Keep Emotions in Check
Emotional trading increases risk drastically.
Common emotional risks:
Fear → premature exits
Greed → ignoring stop-loss
Anger → revenge trading
Overconfidence → oversized trades
Ways to control emotions:
Accept losses as business expenses
Take breaks after losing streaks
Avoid trading during stress or fatigue
Emotional discipline is a risk management skill.
10. Limit Daily, Weekly, and Monthly Losses
Professional traders use drawdown limits.
Example limits:
Daily loss limit: 2–3%
Weekly loss limit: 5–6%
Monthly loss limit: 8–10%
Once the limit is hit:
Stop trading
Review mistakes
Reset mindset
This prevents a bad day from becoming a disastrous month.
11. Avoid Trading During High-Risk Events
Certain periods carry abnormal risk:
Major economic data (CPI, GDP, Fed decisions)
Earnings announcements
Budget and policy announcements
Unexpected geopolitical events
If trading:
Reduce position size
Widen stop-loss carefully
Expect slippage and volatility
Sometimes not trading is the best risk management.
12. Maintain a Trading Journal
A trading journal helps identify hidden risks.
Track:
Entry and exit reasons
Risk-reward ratio
Emotional state
Mistakes and improvements
Over time, patterns emerge:
Which setups fail most
When emotions affect performance
Where risk management breaks down
What gets measured gets improved.
13. Protect Capital First, Profits Second
The golden rule of trading:
“Don’t focus on making money; focus on not losing money.”
Capital preservation ensures:
Longevity in markets
Ability to exploit future opportunities
Psychological confidence
Without capital, even the best strategy is useless.
14. Adapt Risk to Market Conditions
Market volatility changes constantly.
High volatility → smaller position size
Low volatility → tighter stops
Trending markets → wider targets
Range-bound markets → quicker exits
Rigid risk rules without adaptation increase losses.
15. Accept That Not Every Trade Will Work
No strategy has 100% accuracy.
Losses do not mean failure
Stick to process, not outcomes
Evaluate performance over a series of trades
Consistency in risk control beats occasional big profits.
Conclusion
Controlling trading risk is more important than predicting market direction. Successful traders survive long enough because they master capital protection, discipline, and consistency. Risk management turns trading from gambling into a structured business.
If you can:
Limit losses
Maintain positive risk-reward
Control emotions
Protect capital
Then profits become a natural by-product over time.

Axis Bank | Intraday Price-Time Observation Using Square-Based GDisclaimer:
This analysis is for educational purposes only. I am not a SEBI-registered advisor. This is not financial advice.
Educational Case Study | 21 October 2024
This idea presents an educational intraday case study on Axis Bank, focusing on how price–degree alignment and time awareness can be observed using square-based geometric methods commonly discussed in classical market studies.
The purpose of this post is to study chart behavior, not to suggest or validate trades.
📊 Chart Context
Instrument: Axis Bank (NSE)
Date: 21 October 2024
Timeframe: 15-minute (Intraday)
During the session, price showed a shift in momentum after reaching a higher price region. As the move developed, a structured geometric framework was used to observe how price behaved relative to predefined reference points.
🔍 Methodology Used (Observational)
A reference point was marked near 1214, from where price began to decline
From this reference, a 45-degree projection was observed using a square-based calculation method
The derived level appeared near 1197, representing a potential intraday reaction zone
Time was observed as an additional context factor, particularly how price behaved before later session hours
These levels were treated as areas of observation, not certainty points.
📈 Observed Market Behavior
Price approached the projected zone during the intraday session
Near this level, the market showed temporary pressure followed by a short-term response
The behavior aligned with historical observations where price interacts with similar geometric zones
The reaction highlighted how price and time together can influence intraday movement
No trade execution or outcome is implied.
📘 Key Educational Insights
Square-based geometry can help define normal intraday price reach
Certain angles may act as potential reaction areas, depending on context
Time awareness can add structure to intraday observation
This approach emphasizes market structure over indicators
All points are based on historical chart study, not forecasting.
📌 Educational Note
This case study is shared solely for learning and research purposes.
Geometric levels do not guarantee outcomes and should always be treated as contextual tools.
Market responses may vary based on:
Volatility
Liquidity
Broader market structure
🚀 Summary
This intraday case study demonstrates how price geometry and time awareness can be used to observe market behavior in a structured and disciplined way.
More educational observations will follow.

Unlock Trading SecretsUnderstanding Market Behavior
The first trading secret lies in understanding that markets move based on a combination of demand and supply, driven by human behavior. Prices do not move randomly; they react to information such as economic data, corporate earnings, geopolitical events, interest rate changes, and market sentiment. Traders who learn to read these influences gain an advantage. Technical analysis helps decode price action through charts, trends, support and resistance levels, and indicators. Fundamental analysis focuses on the intrinsic value of assets by studying financial statements, macroeconomic factors, and industry trends. Successful traders often combine both approaches instead of relying on only one.
The Power of Discipline and Consistency
One of the most overlooked trading secrets is discipline. Many traders fail not because their strategy is poor, but because they cannot follow it consistently. Discipline means sticking to predefined rules for entry, exit, position sizing, and risk management—regardless of emotions or market noise. Consistency in execution allows traders to measure performance accurately and improve over time. Without discipline, even the best strategy becomes ineffective.
Risk Management: The Core Secret
Risk management is the foundation of long-term trading success. Professional traders focus more on controlling losses than maximizing profits. A common rule is to never risk more than a small percentage of trading capital on a single trade. This ensures survival during losing streaks, which are inevitable in trading. Using stop-loss orders, maintaining a favorable risk-to-reward ratio, and avoiding overleveraging are critical practices. The secret here is simple but powerful: protect your capital first, and profits will follow.
Psychology and Emotional Control
Trading psychology is often described as the true battlefield. Fear, greed, hope, and revenge trading can sabotage even the most skilled traders. Fear may cause early exits, while greed may lead to overtrading or holding positions too long. Emotional control is developed through self-awareness, experience, and structured routines. Keeping a trading journal, reviewing mistakes, and accepting losses as part of the process help build mental resilience. Traders who master their emotions gain a significant edge over those who react impulsively.
Developing a Trading Strategy
Another key trading secret is having a clear, well-tested strategy. A strategy defines what to trade, when to trade, and how to trade. It may be based on trends, breakouts, reversals, momentum, or events such as earnings and economic announcements. The important factor is not the complexity of the strategy, but its clarity and repeatability. Backtesting strategies on historical data and forward-testing them in live or simulated markets builds confidence and reliability.
Timeframe and Trading Style Alignment
Not all trading styles suit every individual. Some traders thrive in fast-paced intraday trading, while others prefer swing trading or long-term investing. Understanding your personality, time availability, and risk tolerance is a crucial secret. A strategy that works well for one trader may fail for another simply due to differences in patience or decision-making speed. Aligning your trading style with your lifestyle increases the chances of consistency and long-term success.
Learning from Losses and Mistakes
Losses are unavoidable in trading, but they are also valuable teachers. The secret is not avoiding losses entirely, but learning from them. Each losing trade offers insight into strategy flaws, emotional mistakes, or market conditions. Traders who analyze losses objectively and make adjustments continuously improve. Those who ignore or emotionally react to losses often repeat the same mistakes.
The Role of Market Cycles
Markets move in cycles—bull markets, bear markets, and sideways phases. Recognizing the current phase is a powerful trading secret. Strategies that work well in trending markets may fail in range-bound conditions. Adapting to market cycles instead of forcing trades improves performance. Flexibility and awareness allow traders to shift strategies or reduce activity when conditions are unfavorable.
Patience and Long-Term Vision
Many beginners seek quick profits, but patience is a hidden trading secret. Sustainable success comes from compounding small, consistent gains over time. Professional traders think in terms of months and years, not days. They focus on process over outcome, knowing that results will naturally follow disciplined execution. Patience helps traders wait for high-probability setups instead of chasing every market move.
Continuous Learning and Adaptation
Markets evolve with technology, regulations, and global events. A trader who stops learning eventually falls behind. Continuous education—through books, courses, market analysis, and self-review—is essential. Staying adaptable and open to improvement is a major secret behind longevity in trading.
Conclusion
Unlocking trading secrets is not about finding a hidden indicator or insider tip. It is about mastering the fundamentals: understanding market behavior, managing risk, controlling emotions, following a disciplined strategy, and committing to continuous learning. Trading rewards those who respect the process and remain patient through challenges. When approached with the right mindset and structure, trading becomes less of a gamble and more of a professional skill—one that can deliver consistent results over the long term.

Mastering Emotional Discipline for Long-Term Trading SuccessCan You Control Revenge Trading?
Revenge trading is one of the most common yet destructive behaviors in financial markets. It happens when a trader, after experiencing a loss, immediately tries to “win back” the money by placing impulsive, emotionally driven trades. Instead of following a well-defined strategy, the trader reacts to frustration, anger, fear, or ego. The result is often a spiral of losses that damages not only the trading account but also confidence and mental well-being. The critical question every trader eventually faces is: can you control revenge trading? The answer is yes—but only with awareness, discipline, and structured systems in place.
Understanding Revenge Trading
Revenge trading is rooted in human psychology. When money is lost, the brain interprets it as a threat or injustice, triggering emotional responses similar to anger or anxiety. Traders feel compelled to “fix” the loss quickly, believing that another trade will restore balance. This mindset shifts focus away from probability and risk management toward emotional satisfaction. The market, however, is indifferent to emotions. It does not reward urgency or desperation; it rewards discipline, patience, and consistency.
Revenge trading often shows up in specific patterns: increasing position size after a loss, abandoning stop-loss rules, overtrading in low-quality setups, or trading outside one’s planned timeframe. Many traders recognize these behaviors only after significant damage has been done, which is why controlling revenge trading requires proactive measures rather than reactive regret.
The Cost of Revenge Trading
The financial cost of revenge trading can be severe. One controlled loss can quickly turn into multiple uncontrolled losses, wiping out weeks or months of gains. Beyond money, the psychological cost is equally damaging. Traders may lose confidence in their strategy, begin doubting their skills, or develop anxiety around trading. Over time, this emotional strain can lead to burnout or complete withdrawal from the markets.
Importantly, revenge trading also disrupts learning. Losses are valuable feedback when analyzed objectively, but revenge trading replaces analysis with emotion. Instead of asking “what went wrong?”, the trader asks “how do I get my money back?”—a question that rarely leads to improvement.
Awareness: The First Step to Control
You cannot control what you do not recognize. The first step in controlling revenge trading is self-awareness. Traders must learn to identify their emotional triggers. Common triggers include a sudden large loss, a series of small losses, missing a profitable trade, or seeing others profit while you lose. By journaling trades and emotions, traders can spot patterns between emotional states and poor decisions.
When you notice physical or mental signals—racing heart, frustration, impulsive thoughts, or the urge to place a trade immediately—it is often a warning sign. Awareness creates a pause between emotion and action, and that pause is where control begins.
Building a Rule-Based Trading System
One of the most effective ways to control revenge trading is to rely on a strict, rule-based trading system. Rules remove discretion at moments when emotions are high. These rules should define entry criteria, exit criteria, stop-loss levels, position sizing, and maximum daily loss.
For example, a daily loss limit is a powerful safeguard. If a trader decides in advance that they will stop trading after losing a certain percentage or amount in a day, it prevents emotional spirals. Similarly, fixed position sizing ensures that no single trade—or emotional impulse—can cause catastrophic damage.
The key is commitment. Rules only work if they are followed even when emotions resist them. Many successful traders treat their rules as non-negotiable, similar to safety protocols in aviation or medicine.
Risk Management as Emotional Protection
Risk management is not just about protecting capital; it is about protecting the trader’s psychology. When risk per trade is kept small, losses become easier to accept. A loss that represents 1% of capital feels manageable, while a loss of 10% can trigger panic and revenge behavior.
Proper risk-reward planning also helps. When traders know that one winning trade can cover multiple small losses, they are less likely to feel desperate after a single loss. This probabilistic mindset—understanding that losses are part of the process—reduces emotional attachment to individual trades.
The Power of Taking a Break
Sometimes the best trade is no trade. Stepping away from the screen after a loss can prevent revenge trading entirely. A short break allows emotions to settle and rational thinking to return. Professional traders often schedule mandatory breaks after significant wins or losses, recognizing that emotional extremes—positive or negative—can impair judgment.
Breaks can be structured, such as a rule to stop trading for the day after two consecutive losses, or informal, such as a walk, meditation, or physical exercise. The goal is to reset emotionally before making another decision.
Developing Emotional Discipline
Emotional discipline is a skill that improves with practice. Techniques such as mindfulness, meditation, or breathing exercises can help traders manage stress and remain present. Over time, traders learn to observe emotions without acting on them. This does not mean suppressing emotions, but rather acknowledging them and choosing not to let them dictate actions.
Reframing losses is another powerful tool. Instead of viewing losses as failures, successful traders see them as business expenses or data points. This mindset shift reduces the emotional sting and the urge to retaliate against the market.
Long-Term Perspective and Professional Mindset
Revenge trading thrives on short-term thinking. A long-term perspective weakens its grip. When traders focus on monthly or yearly performance rather than individual trades, losses feel less personal. Professional traders understand that consistency over hundreds of trades matters more than the outcome of any single one.
Adopting a professional mindset also means accepting responsibility. The market is not an enemy to defeat; it is an environment to navigate. Once traders stop blaming the market and start refining their process, emotional reactions naturally decrease.
Conclusion: Yes, You Can Control Revenge Trading
Revenge trading is not a sign of weakness—it is a natural human response to loss. However, allowing it to dictate decisions is a choice. Through awareness, structured rules, disciplined risk management, emotional regulation, and a long-term mindset, traders can control revenge trading and protect both capital and confidence.
Mastering this aspect of trading often marks the transition from a struggling trader to a consistently profitable one. Markets will always test emotions, but those who learn to respond with discipline rather than revenge gain a decisive edge. In the end, controlling revenge trading is less about controlling the market and more about mastering yourself.

Cross-Market ArbitrageUnlocking Price Inefficiencies Across Global Markets
Cross-market arbitrage is a sophisticated trading strategy that seeks to profit from price discrepancies of the same or closely related financial instruments across different markets. These inefficiencies arise due to differences in liquidity, market structure, trading hours, regulations, currency exchange rates, information flow, and investor behavior. By simultaneously buying an asset in one market where it is undervalued and selling it in another where it is overvalued, traders attempt to capture low-risk or theoretically risk-free profits. Although pure arbitrage opportunities are rare and short-lived in modern markets, cross-market arbitrage remains a critical mechanism that enhances market efficiency and price discovery globally.
Understanding the Concept of Cross-Market Arbitrage
At its core, cross-market arbitrage relies on the “law of one price,” which states that identical assets should trade at the same price when expressed in the same currency. When this condition is violated, arbitrageurs step in to exploit the mismatch. For example, if a company’s shares are listed on two exchanges—such as the New York Stock Exchange (NYSE) and the London Stock Exchange (LSE)—and the price differs after adjusting for exchange rates and transaction costs, an arbitrage opportunity exists. Traders buy shares in the cheaper market and sell them in the more expensive one, earning a profit while simultaneously pushing prices back into alignment.
Cross-market arbitrage can also involve related instruments rather than identical ones. Futures and spot markets, exchange-traded funds (ETFs) and their underlying baskets, cryptocurrencies across multiple exchanges, or commodity prices in different geographic hubs all present opportunities for such strategies.
Types of Cross-Market Arbitrage
One common form is geographical arbitrage, where the same asset trades in different countries or regions. Differences in demand-supply dynamics, capital controls, or settlement mechanisms often create temporary price gaps. Another form is cash-and-carry arbitrage, which involves exploiting differences between spot prices and futures prices across markets. Traders buy the asset in the spot market and sell futures contracts (or vice versa) to lock in a spread.
Inter-exchange arbitrage is prevalent in markets like cryptocurrencies, where the same digital asset can trade at varying prices on different exchanges due to fragmented liquidity and uneven regulatory oversight. ETF arbitrage is another important category, where authorized participants exploit differences between an ETF’s market price and its net asset value (NAV) by creating or redeeming ETF units.
Mechanics and Execution
Executing cross-market arbitrage requires speed, precision, and robust infrastructure. Traders must monitor prices across multiple venues in real time, account for currency conversions, transaction fees, taxes, and settlement risks, and execute trades almost simultaneously to avoid exposure to market movements. In institutional settings, this is often achieved using algorithmic and high-frequency trading systems that can react within milliseconds.
Retail traders, on the other hand, face challenges such as slower execution, higher costs, and limited access to certain markets. As a result, most profitable arbitrage opportunities are captured by large financial institutions, hedge funds, and proprietary trading firms with advanced technology and global reach.
Role of Technology and High-Frequency Trading
Technology has transformed cross-market arbitrage from a manual process into a highly automated one. High-frequency trading (HFT) firms use co-located servers, low-latency networks, and sophisticated algorithms to identify and exploit fleeting price discrepancies. While this has reduced the frequency and size of arbitrage opportunities, it has also improved overall market efficiency by ensuring prices converge quickly across markets.
However, this technological edge raises concerns about market fairness, as smaller participants may be unable to compete on equal footing. Regulators worldwide continue to debate the balance between innovation, efficiency, and equitable market access.
Risks and Limitations
Despite its reputation as a low-risk strategy, cross-market arbitrage is not risk-free. Execution risk arises if trades are not completed simultaneously, exposing the trader to adverse price movements. Liquidity risk can occur if one market lacks sufficient depth to execute large trades without significant price impact. Regulatory risk is also significant, especially when trading across borders with differing rules, capital controls, or tax regimes.
Currency fluctuations add another layer of complexity. Even small changes in exchange rates can erode arbitrage profits if not properly hedged. Additionally, transaction costs, settlement delays, and counterparty risk can turn an apparent arbitrage opportunity into a loss.
Impact on Market Efficiency
Cross-market arbitrage plays a vital role in maintaining market efficiency. By exploiting price differences, arbitrageurs help align prices across markets, ensuring that assets reflect their true economic value. This process improves liquidity, enhances price discovery, and reduces mispricing caused by temporary imbalances or informational delays.
In emerging markets, cross-market arbitrage can also facilitate the integration of local markets with global financial systems. As arbitrage activity increases, price transparency improves, attracting more investors and fostering market development.
Cross-Market Arbitrage in the Indian Context
In India, cross-market arbitrage is commonly observed between cash and derivatives markets, such as equities and index futures. Traders exploit spreads between spot prices and futures contracts, particularly around expiry dates. Arbitrage opportunities also arise between Indian ADRs/GDRs listed overseas and their underlying shares traded domestically, although capital controls and regulatory restrictions limit direct participation.
With the growth of algorithmic trading and improved market infrastructure, Indian markets have become more efficient, reducing large arbitrage gaps. Nevertheless, short-term opportunities still emerge during periods of high volatility, macroeconomic announcements, or sudden shifts in global sentiment.
Future Outlook
As global markets become increasingly interconnected, cross-market arbitrage will continue to evolve. Advances in artificial intelligence, machine learning, and blockchain technology may further compress arbitrage windows while creating new forms of cross-asset and cross-platform opportunities. At the same time, regulatory scrutiny is likely to intensify, particularly around high-speed trading and cross-border capital flows.
In the future, successful arbitrageurs will not only rely on speed but also on superior risk management, data analytics, and a deep understanding of global market dynamics.
Conclusion
Cross-market arbitrage is a cornerstone of modern financial markets, bridging price gaps across exchanges, regions, and asset classes. While the strategy demands advanced technology, substantial capital, and rigorous risk controls, its broader impact benefits all market participants by enhancing efficiency and stability. In a world of increasingly complex and interconnected markets, cross-market arbitrage remains both a powerful trading approach and a vital force ensuring that prices stay fair, transparent, and aligned globally.

USDCHF – M15 | Sell-Side Sweep → Reactive Bounce Price engineered a clean sell-side liquidity run, flushing range lows with displacement. The reaction that followed is corrective, not impulsive. What we’re seeing now is relief buying into discount, not a trend reversal.
Current bounce is unfolding inside prior inefficiency / mitigation, with structure still bearish on the execution timeframe.
Market Read
Range distribution → sharp sell-side sweep
Bounce = mitigation of bearish orderflow
No bullish displacement, only overlap
Execution Bias
Shorts favored on retracement into the marked supply / imbalance
Invalidation only on strong M15 acceptance above the green high
Targets
Recent sell-side lows
Extension into external liquidity below
Deeper discount if momentum expands

Commodity MCX SecretsUnlocking Profitable Trading Opportunities in the Indian Commodity Market
The Multi Commodity Exchange of India (MCX) is the backbone of commodity trading in India, offering a structured, regulated, and transparent platform for trading commodities such as gold, silver, crude oil, natural gas, base metals, and agricultural products. While many traders participate in MCX, only a few consistently succeed. The difference lies in understanding the “secrets” of MCX trading—practical insights, strategies, and risk-management principles that go beyond basic knowledge. These secrets are not shortcuts or illegal tactics; instead, they are a combination of market understanding, discipline, timing, and professional execution.
Understanding the Nature of MCX Commodities
The first secret of MCX trading is recognizing that commodities behave very differently from equities. Commodity prices are directly influenced by global supply-demand dynamics, geopolitical events, currency movements (especially USD-INR), interest rates, weather conditions, and inventory data. For example, gold reacts strongly to inflation expectations, interest rate decisions, and global uncertainty, while crude oil is highly sensitive to OPEC decisions, geopolitical tensions, and inventory reports. Successful MCX traders deeply understand the fundamental drivers of each commodity they trade instead of treating all instruments the same.
Liquidity and Contract Selection
Another crucial MCX secret lies in choosing the right contract. MCX offers multiple contracts with different expiry dates. Professional traders focus on the most liquid contracts, usually the near-month contracts, because they offer tighter bid-ask spreads, better price discovery, and smoother execution. Illiquid contracts can lead to slippage, erratic price moves, and difficulty in exiting positions. Consistency in trading comes from staying where institutional participation is highest.
Timing the Market with Global Cues
MCX may be an Indian exchange, but commodity prices are largely driven by global markets. This means that international trading sessions—especially European and US hours—play a vital role. For energy and metal commodities, the most significant moves often occur after 6:00 PM IST when US markets become active. Experienced MCX traders align their trading hours with global volatility instead of trading randomly throughout the day. They track key global data releases such as US inflation, interest rate decisions, crude oil inventory reports, and employment data to anticipate volatility.
Technical Analysis with Commodity-Specific Adaptation
While technical analysis is widely used in equity trading, applying it blindly to MCX is a common mistake. One of the hidden secrets of MCX trading is adapting technical tools to commodity behavior. Commodities often trend strongly and respect key support and resistance levels more clearly than many stocks. Trend-following indicators like moving averages, RSI, and MACD work well when combined with volume and open interest analysis. Open interest, in particular, is a powerful but underutilized tool in MCX, as it reveals whether money is entering or exiting the market, helping traders confirm the strength of a move.
The Power of Open Interest and Volume
Open interest is one of the most important MCX secrets that retail traders often ignore. Rising prices with rising open interest indicate fresh buying and a strong trend, while rising prices with falling open interest suggest short covering and a potentially weak move. Similarly, falling prices with rising open interest indicate strong short positions. By combining price action, volume, and open interest, traders gain a clearer picture of institutional activity and avoid false breakouts.
Risk Management: The Real Secret to Survival
The biggest secret of long-term success in MCX is not prediction but risk management. Commodity markets are highly leveraged, which can amplify both profits and losses. Professional traders risk only a small percentage of their capital on each trade, strictly follow stop-loss rules, and avoid emotional decision-making. They understand that preserving capital is more important than chasing large profits. Many beginners fail not because their analysis is wrong, but because they overtrade, overleverage, and refuse to exit losing positions.
Understanding Volatility and Position Sizing
Volatility in MCX commodities can change rapidly due to news or global developments. One key secret is adjusting position size according to volatility. When markets are highly volatile, experienced traders reduce their position size to control risk. They also avoid trading during unpredictable events unless they are specifically strategy-driven traders. This flexible approach helps maintain consistency across different market conditions.
Fundamental and Seasonal Insights
Another lesser-known MCX secret is the importance of seasonality. Many commodities follow seasonal patterns based on production cycles, weather, and consumption trends. For example, agricultural commodities are influenced by monsoon patterns, sowing seasons, and harvest cycles, while energy demand varies with weather conditions. Traders who combine seasonal analysis with fundamentals gain a strategic edge by aligning their trades with historically favorable periods.
Discipline and Trading Psychology
Beyond charts and data, the psychological aspect is one of the most powerful MCX secrets. Successful traders maintain discipline, patience, and emotional control. They do not chase the market, revenge trade, or let fear and greed dictate decisions. Instead, they follow predefined trading plans, accept losses as part of the process, and focus on long-term consistency rather than short-term excitement.
Hedging and Professional Use of MCX
MCX is not only a speculative platform but also a powerful hedging tool. Businesses, importers, exporters, and investors use MCX to protect themselves against price fluctuations. Understanding how hedgers operate provides insight into market behavior, especially near expiry. Smart traders observe hedging activity to understand supply-demand pressures and price stability zones.
Conclusion
The true secrets of commodity MCX trading lie in knowledge, preparation, and discipline rather than shortcuts or tips. Understanding the unique behavior of commodities, aligning trades with global cues, using open interest and volume effectively, managing risk professionally, and maintaining psychological control are the foundations of consistent success. MCX rewards traders who treat trading as a business, not a gamble. By mastering these principles, traders can unlock sustainable opportunities in the dynamic and challenging world of commodity markets.

Part 12 Trading Master ClassTypes of Options: Calls and Puts
Options are broadly divided into two categories:
A. Call Option
A Call option gives the buyer the right to buy an asset at a fixed price (strike).
You buy a Call if you expect the market to rise.
You sell a Call if you think the market will stay below the strike or go down.
B. Put Option
A Put option gives the buyer the right to sell an asset at a fixed price.
You buy a Put if you expect the market to fall.
You sell a Put if you expect the market to stay above the strike or move upward.
These two instruments allow traders to take directional views, hedge positions, or earn income through option writing.

Financial Market Guides1. What Are Financial Markets?
Financial markets are systems that facilitate the buying and selling of financial instruments such as stocks, bonds, currencies, commodities, and derivatives. They connect savers (investors) with borrowers (corporations and governments), enabling efficient allocation of capital. Prices in these markets reflect collective expectations about growth, inflation, risk, and future cash flows.
Financial market guides simplify this complex ecosystem by breaking markets into understandable components, explaining participants’ roles, and highlighting the forces that drive price movements.
2. Purpose of Financial Market Guides
The primary purpose of financial market guides is education and decision support. They help market participants:
Understand market structure and instruments
Analyze risk versus return
Interpret macroeconomic and microeconomic signals
Develop investment or trading strategies
Avoid common behavioral and structural mistakes
For new investors, guides provide foundational literacy. For experienced traders, they offer frameworks to refine strategies and adapt to changing market regimes.
3. Major Types of Financial Markets Covered in Guides
A well-structured financial market guide typically explains the following core markets:
a. Equity Markets
Equity markets involve the trading of company ownership through shares. Guides explain concepts such as market capitalization, earnings, valuation ratios, sector rotation, and corporate actions. They also cover different styles like growth, value, dividend, and momentum investing.
b. Fixed Income Markets
Bond markets focus on debt instruments issued by governments and corporations. Financial guides explain interest rates, yield curves, credit risk, duration, and how monetary policy impacts bond prices. Fixed income is often highlighted as a stabilizing force in portfolios.
c. Foreign Exchange (Forex) Markets
Forex markets determine currency values and are the most liquid markets globally. Guides explain exchange rate mechanisms, currency pairs, central bank policies, and global capital flows. Forex is often linked closely with trade balances and macroeconomic stability.
d. Commodity Markets
Commodity markets include energy, metals, and agricultural products. Guides explain supply-demand cycles, geopolitical influences, inflation hedging, and the concept of commodity supercycles.
e. Derivatives Markets
Derivatives such as futures, options, and swaps derive value from underlying assets. Financial market guides emphasize their dual role—risk management (hedging) and speculation—while also warning about leverage-related risks.
4. Market Participants Explained
Financial market guides clearly define who participates in markets and why:
Retail Investors: Individuals investing personal capital
Institutional Investors: Mutual funds, pension funds, insurance companies
Hedge Funds & Prop Traders: Focused on alpha generation
Central Banks: Manage monetary policy and financial stability
Corporations: Raise capital and hedge risks
Understanding participant behavior helps explain liquidity, volatility, and price trends.
5. Role of Macroeconomics in Financial Market Guides
One of the most critical elements of any financial market guide is macroeconomic analysis. Markets do not move in isolation—they respond to:
GDP growth
Inflation trends
Interest rate changes
Employment data
Fiscal and monetary policy
Guides often explain economic cycles (expansion, peak, recession, recovery) and how different asset classes perform across these phases. This macro lens is essential for long-term investing and global asset allocation.
6. Risk Management and Capital Preservation
Financial market guides emphasize that risk management is more important than returns. Common risk concepts include:
Market risk
Credit risk
Liquidity risk
Leverage risk
Behavioral risk
Guides explain tools such as diversification, position sizing, stop losses, asset allocation, and hedging strategies. The core message is clear: survival comes first, profits come second.
7. Behavioral Finance and Psychology
Modern financial market guides increasingly incorporate behavioral finance. Human emotions—fear, greed, overconfidence, and panic—often drive irrational decisions. Guides help readers recognize cognitive biases such as:
Herd mentality
Loss aversion
Confirmation bias
Recency bias
By addressing psychology, financial market guides aim to improve discipline, consistency, and long-term performance.
8. Trading vs. Investing Frameworks
Financial market guides clearly distinguish between trading and investing:
Trading: Short- to medium-term, price-driven, timing-focused
Investing: Long-term, value-driven, fundamentals-focused
Guides explain various styles such as swing trading, position trading, day trading, and index investing, helping participants choose approaches aligned with their capital, time availability, and risk tolerance.
9. Importance of Market Cycles and Regimes
Markets move in cycles, not straight lines. Financial market guides teach readers how to identify:
Bull and bear markets
High-volatility vs. low-volatility regimes
Risk-on and risk-off environments
Recognizing these regimes helps investors adjust strategies instead of applying one-size-fits-all approaches.
10. Technology, Data, and Modern Markets
Contemporary financial market guides also cover the impact of technology:
Algorithmic and high-frequency trading
Data analytics and quantitative models
Online trading platforms
Artificial intelligence and machine learning
Technology has improved access and efficiency but has also increased competition and speed, making education even more critical.
11. Long-Term Value of Financial Market Guides
The true value of financial market guides lies not in predicting markets, but in building a structured mindset. They teach participants how to think probabilistically, manage uncertainty, and continuously adapt. Markets evolve, but core principles—risk, cycles, discipline, and valuation—remain constant.
For individuals aiming to build wealth, protect capital, or pursue professional trading, financial market guides act as enduring references that grow more valuable with experience.
Conclusion
Financial market guides are essential tools for navigating the complexity of global finance. They combine theory, practical frameworks, and real-world insights to help participants understand how markets function, why prices move, and how risks can be managed. In an environment defined by uncertainty and constant change, a strong foundation built through financial market guides is one of the most powerful advantages any market participant can possess.
Whether you are an investor, trader, student, or professional, mastering the concepts outlined in financial market guides is a critical step toward long-term success in the financial world.

Microstructure Trading Edge: Unlocking Profits from Market1. Foundations of Market Microstructure
At its core, market microstructure studies how prices emerge from the interaction of buyers and sellers. Prices do not move randomly; they respond to supply-demand imbalances reflected through orders. These orders are visible (limit orders) or invisible (market orders, hidden liquidity, iceberg orders). The continuous battle between liquidity providers (market makers) and liquidity takers (aggressive traders) determines short-term price movements.
A microstructure trading edge begins with understanding:
Bid-ask spread behavior
Order book depth and imbalance
Trade aggressiveness
Execution priority (price-time priority)
Market impact and slippage
Traders who understand these mechanics can anticipate short-term price changes before they appear on traditional charts.
2. Order Flow as the Core Edge
Order flow is the heartbeat of microstructure trading. It represents the real-time flow of buy and sell orders hitting the market. Unlike indicators derived from historical prices, order flow is leading, not lagging.
A microstructure edge emerges when a trader can:
Identify aggressive buyers or sellers
Detect absorption (large players absorbing market orders)
Spot exhaustion of one side of the market
Read delta divergence (difference between price movement and volume imbalance)
For example, if price is not falling despite heavy selling pressure, it may indicate strong institutional absorption—often a precursor to a reversal. This insight is invisible to standard indicators but clear to order-flow-aware traders.
3. Bid-Ask Spread and Liquidity Dynamics
The bid-ask spread reflects the cost of immediacy. When liquidity is abundant, spreads are tight; when liquidity dries up, spreads widen. Microstructure traders exploit this by understanding when liquidity is likely to vanish or surge.
Key liquidity-based edges include:
Trading during spread compression phases
Avoiding periods of liquidity vacuum (news events, market open/close)
Identifying fake liquidity (spoofing-like behavior or pulled orders)
Recognizing thin books that allow small volume to move price significantly
Professional traders often enter positions just before liquidity expands and exit before it contracts, minimizing transaction costs while maximizing price efficiency.
4. Market Participants and Their Footprints
Different market participants leave distinct footprints:
Retail traders: small size, emotional execution, market orders
Institutions: large size, patient execution, iceberg orders
Market makers: spread capture, inventory management
High-frequency traders (HFTs): speed-based arbitrage, queue positioning
A microstructure edge comes from recognizing who is likely active at a given moment. For instance, sudden bursts of small aggressive orders often indicate retail participation, while steady absorption with minimal price movement points to institutional involvement.
Understanding participant behavior helps traders align themselves with stronger hands instead of fighting them.
5. Price Impact and Execution Efficiency
Every order moves the market to some degree. The relationship between trade size and price movement is known as market impact. Microstructure traders aim to minimize adverse impact while exploiting others’ poor execution.
This edge is particularly strong in:
Scalping strategies
High-frequency mean reversion
VWAP and TWAP deviations
Opening range and closing auction trades
Traders who understand execution mechanics can enter positions at optimal times, reducing slippage and improving net profitability—even if their directional bias is only slightly better than random.
6. Information Asymmetry and Short-Term Alpha
Microstructure trading thrives on information asymmetry, not in the illegal sense, but in the structural sense. Some traders react faster, interpret data better, or understand context more deeply.
Sources of microstructure information advantage include:
Faster interpretation of order book changes
Real-time trade classification (buyer-initiated vs seller-initiated)
Contextual awareness (news + order flow alignment)
Knowledge of exchange-specific rules and quirks
Because microstructure edges operate on very short timeframes, they decay quickly—but when executed repeatedly, they compound into meaningful alpha.
7. Microstructure Across Timeframes
Although often associated with scalping, microstructure is relevant across timeframes:
Ultra-short-term: tick-by-tick order flow and queue dynamics
Intraday: liquidity zones, VWAP interactions, session highs/lows
Swing trading: entry timing refinement using lower-timeframe microstructure
Position trading: identifying institutional accumulation/distribution phases
Even long-term traders gain an edge by using microstructure to optimize entries and exits, improving risk-reward without changing their core thesis.
8. Technology and Tools Behind the Edge
Modern microstructure trading relies heavily on technology:
Depth of Market (DOM)
Time & Sales
Volume profile and footprint charts
Order flow analytics
Low-latency execution platforms
However, tools alone do not create an edge. The real advantage comes from interpretation, context, and discipline. Many traders see the same data, but only a few understand what matters and when.
9. Risks and Limitations of Microstructure Trading
While powerful, microstructure trading is not without challenges:
High transaction costs if overtrading
Psychological pressure from fast decision-making
Edge decay due to competition and automation
Overfitting patterns that do not persist
A sustainable microstructure edge requires strict risk management, continuous adaptation, and an understanding that not every market condition is suitable for microstructure-based trades.
10. Conclusion: Why Microstructure Creates a Lasting Edge
The microstructure trading edge lies in seeing the market as a living process rather than a static chart. By focusing on how trades are executed, how liquidity behaves, and how participants interact, traders gain insight into price movements before they fully develop.
In an era where traditional indicators are widely known and arbitraged, microstructure offers a deeper, more nuanced layer of understanding. While it demands skill, discipline, and experience, it rewards traders with precision, timing, and consistency—qualities that define long-term success in modern financial markets.
Ultimately, microstructure trading transforms the trader from a passive observer of price into an active reader of market intent, where every order tells a story and every imbalance creates opportunity.

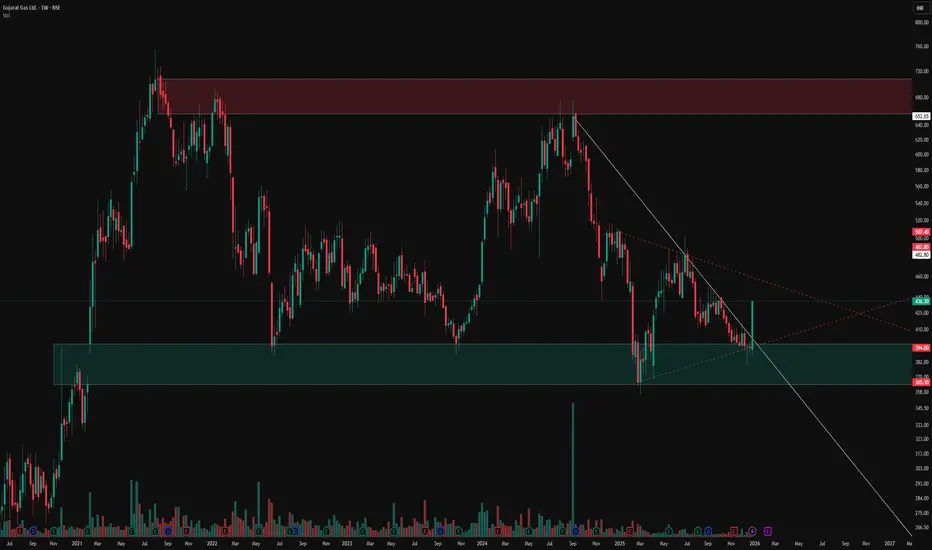
Unveiling Hidden Symmetrical Triangle and Saving from FakeoutsThis weekly chart post highlights key price action elements in a sideways pattern, focusing on zones, trendlines, and a subtle symmetrical triangle for educational observation. Green demand zones and red supply zones frame the overall range, while the white counter trend line traces internal fluctuations. The dotted red line uncovers a hidden symmetrical triangle, where converging lines often lead to breakout rejections observed as fakeouts
Key Chart Features
-Demand & Supply Zones: Green areas mark demand support, red zones indicate supply resistance, revealing price reactions within the sideways structure.
-Counter Trend Line: White line connects minor highs and lows, illustrating counter-trend swings that define the internal rhythm amid broader consolidation.
-Hidden Symmetrical Triangle: Dotted red outline exposes the converging pattern, a consolidation coil with balanced higher lows and lower highs, frequently trapping breakout attempts.
Disclaimer: Not a SEBI-registered advisor. This is purely educational on price dynamics, supply-demand, trendlines, and hidden patterns—no investment advice or forecasts. Past patterns do not guarantee future results; conduct your own analysis.
Part 8 Trading Master ClassImportant Points for Traders
✔ Always check IV (Implied Volatility)
High IV → Selling strategies
Low IV → Buying strategies
✔ Avoid naked selling unless hedged
Unlimited risk is dangerous.
✔ Start with defined-risk strategies
Vertical spreads, iron condor, butterfly
✔ Probability matters more than profit per trade
Most professionals use credit spreads for consistency.
✔ Adjust if market moves aggressively
Rolling helps avoid full losses.

Understanding the Hidden Dangers Behind High ReturnsRisks in Option Trading:
Option trading is often marketed as a powerful financial tool that allows traders to earn high returns with relatively low capital. While it is true that options provide flexibility, leverage, and multiple strategic possibilities, they also carry significant risks that are frequently underestimated, especially by new traders. Understanding these risks is critical before participating in options markets, as a lack of awareness can quickly lead to substantial and sometimes irreversible losses. Option trading is not merely about predicting market direction; it involves time sensitivity, volatility dynamics, pricing models, and psychological discipline. Below is a detailed discussion of the major risks involved in option trading.
1. Leverage Risk
One of the most attractive features of option trading is leverage. With a small amount of capital, traders can control a large notional value of an underlying asset. However, leverage is a double-edged sword. While it magnifies gains, it equally magnifies losses. A small adverse movement in the underlying asset can result in a disproportionately large loss on the option position. In some cases, especially with selling options, losses can exceed the initial investment. Traders who misuse leverage often face rapid capital erosion, making leverage risk one of the most dangerous aspects of option trading.
2. Time Decay (Theta Risk)
Unlike stocks, options are wasting assets. Every option has an expiration date, and as that date approaches, the option loses value due to time decay, known as theta. Even if the underlying asset remains stable, the option’s premium can decline daily. This risk is particularly severe for option buyers, as they must not only be correct about market direction but also about timing. Many traders experience losses simply because the expected price movement did not occur fast enough before expiration.
3. Volatility Risk
Option prices are highly sensitive to changes in volatility, measured by implied volatility (IV). A trader may correctly predict the direction of a stock, index, or commodity, yet still incur losses if volatility contracts after entering the trade. For example, buying options during periods of high implied volatility can be risky because a subsequent volatility drop can reduce option premiums sharply. This phenomenon, often referred to as “volatility crush,” is common after events like earnings announcements. Volatility risk makes option pricing complex and less intuitive for beginners.
4. Unlimited Loss Risk in Option Selling
Selling options, especially naked calls or naked puts, carries potentially unlimited or very large losses. When selling a call option without owning the underlying asset, there is theoretically no limit to how high the price can rise, exposing the seller to unlimited risk. Similarly, selling naked puts can lead to massive losses if the underlying asset collapses. While option selling may generate consistent small profits, one adverse market move can wipe out months or even years of gains.
5. Liquidity Risk
Not all options are actively traded. Some options contracts suffer from low liquidity, leading to wide bid-ask spreads. This means traders may have to buy at a higher price and sell at a much lower price, increasing transaction costs and reducing profitability. In illiquid options, exiting a position quickly during adverse market conditions can be difficult or impossible, further amplifying losses. Liquidity risk is especially relevant in far-out-of-the-money options or contracts with distant expiration dates.
6. Pricing Complexity and Model Risk
Option pricing is based on mathematical models such as the Black-Scholes model, which rely on assumptions like constant volatility and efficient markets. In reality, markets behave unpredictably, and these assumptions often fail. Traders who do not fully understand how option Greeks (Delta, Gamma, Theta, Vega, and Rho) interact may misjudge risk exposure. Misinterpreting pricing dynamics can result in positions behaving very differently from expectations, leading to unexpected losses.
7. Psychological and Emotional Risk
Option trading can be emotionally intense due to rapid price fluctuations and the possibility of quick gains or losses. Fear, greed, overconfidence, and revenge trading often lead traders to deviate from their strategies. The fast-paced nature of options markets can cause impulsive decisions, such as holding losing positions too long or overtrading after a loss. Psychological risk is often underestimated but plays a crucial role in long-term failure or success.
8. Event and Gap Risk
Options are highly sensitive to sudden market events such as economic data releases, geopolitical developments, policy announcements, or corporate earnings. These events can cause sharp price gaps in the underlying asset, leaving traders with little or no opportunity to adjust positions. Stop-loss orders may not work as expected during gaps, especially in option selling strategies. Event risk can turn a seemingly safe trade into a large loss overnight.
9. Margin and Assignment Risk
Option selling often requires margin. If the market moves against the position, brokers may issue margin calls, forcing traders to add funds or close positions at unfavorable prices. Additionally, American-style options can be exercised at any time before expiration, creating assignment risk. Unexpected assignment can lead to sudden stock positions, additional capital requirements, or unintended exposure to market risk.
10. Regulatory and Operational Risk
Changes in regulations, margin requirements, or exchange rules can impact option strategies. Technical issues such as system failures, internet outages, or broker platform glitches can prevent timely execution or exit of trades. These operational risks may not be frequent, but when they occur, they can result in significant financial damage, especially in fast-moving option markets.
Conclusion
Option trading offers powerful opportunities, but it is far from risk-free. The combination of leverage, time decay, volatility sensitivity, and psychological pressure makes it one of the most complex forms of trading. Many traders focus solely on potential returns while ignoring the structural risks embedded in options. Successful option trading requires deep knowledge, disciplined risk management, realistic expectations, and emotional control. Without these, option trading can quickly turn from a wealth-building tool into a capital-destroying activity. Understanding and respecting the risks is not optional—it is essential for survival in the options market.

Divergence Secrets Key Terms in Options
To trade options effectively, understanding the core terminology is essential.
Strike Price
The pre-decided price at which the buyer can buy (call) or sell (put) the asset.
Premium
The price paid to buy an option. It is the cost of having the right without the obligation.
Expiry Date
The last date on which the option can be exercised. In India, index options expire weekly, and stock options expire monthly.
Lot Size
Options are not traded individually like stocks. Each option contract controls a fixed number of shares called the lot size.
In-the-Money (ITM), At-the-Money (ATM), Out-of-the-Money (OTM)
These terms describe how close the option is to profitability relative to the strike price.

ABSLAMC 1 Week Time Frame 📌 Current Price Snapshot (Approx)
Latest traded price ~ ₹805–₹830 range on recent sessions. Prices fluctuate within this zone depending on the source/time but are generally around ₹800+ currently.
📉 Weekly Technical Levels (Support & Resistance)
🔹 Weekly Support Levels
Level Price (Approx) Notes
S1 – First Support ₹790–₹789 Near short‑term weekly support.
S2 – Secondary Support ₹749–₹750 Key weekly demand zone.
S3 – Lower Support ₹725–₹715 Lower support if deeper pullback.
🔹 Weekly Resistance Levels
Level Price (Approx) Notes
R1 – First Resistance ₹854–₹855 Near immediate upper barrier.
R2 – Near Term Higher ₹879–₹880 Next upside pressure.
R3 – Higher Resistance ₹900+ Psychological/52‑week high zone.
📊 Weekly Trend & Momentum
Weekly technical rating on TradingView shows a buy signal (strong buy on 1‑week timeframe).
Oscillators (like RSI & Stoch) on broader data show moderate to positive momentum in recent days.
🕐 Interpretation — 1‑Week Timeframe
Bullish View
Holding above ₹790–₹800 keeps immediate bullish bias.
Weekly breakout above ₹854–₹880 could open path toward ₹900+ levels.
Neutral/Corrective View
A drop below ₹750–₹725 would weaken weekly structure and shift bias toward deeper support.
🛠 Quick Weekly Levels Recap
Resistance (Upside Targets)
₹854 – ₹880
₹900+ (psychological / 52‑week high area)
Support (Downside Safety Nets)
₹790 – ₹789 (immediate)
₹750 – ₹749
₹725 – ₹715 (strong support)

Risk Smart, Grow Fast: The Art of Intelligent Wealth CreationUnderstanding Risk the Right Way
Risk is often misunderstood as something to avoid. In reality, risk is unavoidable in any form of growth—whether in trading, investing, business, or personal development. The key difference between winners and losers is not the presence of risk, but how risk is managed. Smart risk-takers identify potential downsides before focusing on upside. They ask critical questions: What can go wrong? How much can I lose? Can I survive this loss? This mindset shifts risk from a threat into a calculated tool.
The Power of Risk Management
Risk management is the backbone of fast yet sustainable growth. Without it, even the best strategy eventually collapses. Smart risk management involves defining risk limits, position sizing, diversification, and exit rules. In trading and investing, this could mean risking only a small percentage of capital on each trade. In business, it might involve testing ideas on a small scale before full implementation. By controlling downside, you create the freedom to pursue opportunities aggressively without fear of ruin.
Why Smart Risk Accelerates Growth
Ironically, those who take controlled risks often grow faster than those who chase high rewards impulsively. This is because they stay in the game longer. Consistency compounds. A person who avoids catastrophic losses can benefit from compounding returns, learning cycles, and experience. Over time, small intelligent gains stack up, leading to exponential growth. Fast growth is rarely about one big win—it is about many smart decisions executed repeatedly.
The Role of Probability and Edge
Smart risk-takers think in probabilities, not certainties. They understand that no decision guarantees success. Instead, they focus on having an edge—a situation where the odds are slightly in their favor over many repetitions. In markets, this might be a tested strategy. In careers, it might be acquiring rare skills. Growth becomes fast when decisions are aligned with favorable probabilities and repeated consistently with discipline.
Emotional Control: The Hidden Advantage
One of the biggest threats to smart risk-taking is emotion. Fear leads to hesitation, while greed leads to overexposure. Emotional decisions distort risk perception and cause impulsive behavior. Those who grow fast learn to detach emotionally from outcomes and focus on processes. Losses are treated as feedback, not failure. This emotional resilience allows them to take the next opportunity confidently without being psychologically damaged by past setbacks.
Learning From Losses Without Being Destroyed by Them
Losses are inevitable when taking risks, but smart risk-takers design losses to be small and educational. Instead of asking “How do I avoid losses?”, they ask “How do I ensure losses don’t harm my long-term progress?” This shift is powerful. Each controlled loss becomes a tuition fee for experience. Over time, this learning curve accelerates growth far more than avoiding risk altogether.
Leverage: A Tool, Not a Shortcut
Leverage—whether financial, time-based, or skill-based—can accelerate growth dramatically, but it magnifies both gains and losses. Smart growth does not reject leverage; it respects it. Using leverage responsibly means ensuring that a single mistake cannot wipe out years of effort. Those who grow fast understand leverage deeply and apply it only when risk is well defined and controlled.
Diversification vs. Focus
Risk-smart growth balances diversification and focus. Diversification protects capital and reduces volatility, while focus allows for meaningful impact and higher returns. Intelligent growth strategies often start with diversification to survive and learn, then gradually increase focus as confidence, skill, and edge improve. This phased approach reduces risk while maintaining growth momentum.
Long-Term Vision With Short-Term Discipline
Growing fast does not mean thinking short term. In fact, the fastest sustainable growth often comes from a long-term vision supported by strict short-term discipline. Every decision is evaluated based on how it fits into the bigger picture. Short-term setbacks are accepted if they align with long-term goals. This clarity prevents impulsive risk-taking and keeps growth on track.
Risk Smart Is a Mindset, Not a Strategy
Ultimately, Risk Smart, Grow Fast is a mindset. It is about respecting uncertainty, preparing for downside, and acting decisively when opportunity arises. It requires humility to accept what you don’t know and confidence to act on what you do. This mindset applies beyond finance—to careers, entrepreneurship, relationships, and personal growth.
Conclusion
Fast growth is not achieved by avoiding risk or chasing reckless rewards. It is achieved by understanding risk, controlling it, and using it intentionally. When risks are smart, losses are survivable, learning accelerates, and compounding works in your favor. In a world full of noise and shortcuts, those who risk smartly stand out—not because they never fail, but because they never allow failure to stop them. That is the true formula to grow fast and grow strong.

Share Market Explained: A Comprehensive Point-Wise GuideIntroduction to the Share Market
The share market, also known as the stock market or equity market, is a platform where shares of publicly listed companies are bought and sold. It acts as a bridge between companies that need capital to grow and investors who want to grow their wealth. By purchasing shares, investors become part-owners of a company and gain the right to benefit from its growth and profitability.
Meaning of Shares and Stocks
A share represents a unit of ownership in a company. When a company divides its ownership into small units and offers them to the public, these units are called shares. Stocks is a broader term often used to describe ownership in one or more companies. Holding shares allows investors to participate in the company’s success through price appreciation and dividends.
Purpose of the Share Market
The main purpose of the share market is capital formation. Companies raise funds to expand operations, invest in new projects, or reduce debt. For investors, the market provides opportunities to earn returns, beat inflation, and create long-term wealth. It also ensures transparency, price discovery, and liquidity in financial markets.
Primary Market and Secondary Market
The share market is divided into two segments:
Primary Market: Where companies issue shares for the first time through Initial Public Offerings (IPOs). Investors buy shares directly from the company.
Secondary Market: Where existing shares are traded among investors on stock exchanges. Prices here change based on demand and supply.
Role of Stock Exchanges
Stock exchanges like the NSE and BSE in India provide a regulated platform for trading shares. They ensure fair trading practices, transparency, and investor protection. Exchanges also help in price discovery by matching buyers and sellers efficiently using electronic systems.
Market Participants
Several participants operate in the share market:
Retail Investors: Individual investors trading with their personal funds.
Institutional Investors: Mutual funds, insurance companies, pension funds, and foreign investors.
Traders and Speculators: Participants who aim to profit from short-term price movements.
Brokers and Intermediaries: Entities that facilitate buying and selling of shares.
How Share Prices Are Determined
Share prices are determined by demand and supply. When more investors want to buy a stock than sell it, the price rises. When selling pressure increases, the price falls. Factors influencing prices include company performance, earnings, economic conditions, interest rates, global markets, and investor sentiment.
Types of Shares
Equity Shares: Represent ownership and voting rights. Returns depend on company performance.
Preference Shares: Offer fixed dividends and priority over equity shareholders but limited voting rights.
Equity shares are more common among retail investors due to higher growth potential.
Returns from the Share Market
Investors earn returns in two ways:
Capital Appreciation: Increase in share price over time.
Dividends: A portion of company profits distributed to shareholders.
Long-term investors mainly focus on capital appreciation, while income-oriented investors value dividends.
Investment vs Trading
Investing: Focuses on long-term wealth creation by holding quality stocks for years. It relies on fundamental analysis.
Trading: Focuses on short-term price movements, from minutes to weeks. It relies on technical analysis and market timing.
Both approaches require different mindsets and risk management strategies.
Fundamental Analysis
Fundamental analysis studies a company’s financial health, business model, management quality, and growth prospects. Key factors include revenue, profits, balance sheet strength, industry position, and economic outlook. Long-term investors use this to identify undervalued stocks.
Technical Analysis
Technical analysis focuses on price charts, volume, and indicators to predict future price movements. Traders use patterns, support-resistance levels, moving averages, and momentum indicators. It assumes that market prices reflect all available information.
Market Indices
Indices like NIFTY 50 and SENSEX represent the overall performance of the market. They track a basket of top companies and act as benchmarks for investors. Rising indices indicate bullish sentiment, while falling indices signal bearish conditions.
Risk in the Share Market
The share market involves risks such as price volatility, business risk, economic risk, and global uncertainties. Prices can fluctuate sharply in the short term. Understanding and managing risk is crucial for long-term survival and success.
Risk Management and Diversification
Diversification means investing across different sectors and companies to reduce risk. Proper position sizing, asset allocation, and use of stop-losses help protect capital. Successful investors focus more on risk control than on returns.
Role of Regulations
Regulatory bodies like SEBI in India protect investor interests, prevent fraud, and ensure fair market practices. Regulations promote transparency, disclosure, and accountability among listed companies and market participants.
Impact of Economic and Global Factors
Inflation, interest rates, government policies, geopolitical events, and global markets influence share prices. For example, rising interest rates may negatively affect equity markets, while economic growth usually supports higher stock prices.
Behavioral Aspects of the Share Market
Investor psychology plays a major role. Emotions like fear, greed, and overconfidence often lead to irrational decisions. Successful market participants develop discipline, patience, and a rule-based approach.
Long-Term Wealth Creation through the Share Market
Historically, equities have delivered higher returns compared to most asset classes over the long term. Compounding, when profits generate further profits, makes long-term investing powerful. Time in the market is more important than timing the market.
Conclusion
The share market is a vital part of the modern financial system. It offers opportunities for wealth creation, economic growth, and financial participation. While it involves risks, proper knowledge, discipline, and a long-term perspective can help investors benefit significantly. Understanding how the share market works is the first step toward making informed and confident financial decisions.

Option Trading Strategies Styles of Options
• American Style
Can be exercised anytime before expiry.
• European Style
Can only be exercised on expiry day.
Indian index options like Nifty and Bank Nifty follow this style.
Option Trading Strategies
Options allow traders to build combinations depending on market expectations.
1. Bullish Strategies
Long Call
Bull Call Spread
2. Bearish Strategies
Long Put
Bear Put Spread
3. Neutral Strategies
Iron Condor
Short Straddle / Strangle
Butterfly Spread
4. Volatility Strategies
Long Straddle
Long Strangle
These profit from large movements.
Each strategy balances risk and reward differently.

Part 12 Trading Master Class Key Terms in Option Trading
To understand how options work, you need to know some important terms:
• Strike Price
This is the predetermined price at which the buyer can buy (call) or sell (put) the asset.
• Premium
The cost of buying an option. The buyer pays this premium to the seller upfront.
• Expiry Date
Every option has a validity period. After expiry, the contract becomes worthless.
• Lot Size
Options are traded in predefined quantities. You cannot buy a single share option; you must buy a lot.

Market Microstructure and Institutional Trading Strategiesexecuted. However, beneath this surface lies a complex system known as market microstructure, which governs how trades are actually formed, matched, and settled. For institutional participants such as mutual funds, hedge funds, pension funds, banks, and proprietary trading firms, understanding market microstructure is not optional—it is essential. Their trading strategies are deeply shaped by liquidity, order flow, transaction costs, and the behavior of other large participants. This article provides a comprehensive understanding of market microstructure and explains how institutional trading strategies are built around it.
What Is Market Microstructure?
Market microstructure refers to the study of how markets operate at the trade-by-trade level. It focuses on the mechanisms through which orders are submitted, matched, and executed, and how these processes influence price formation. Unlike macro-level analysis that looks at economic data or corporate fundamentals, microstructure zooms in on order books, bid-ask spreads, volume, liquidity, volatility, and execution speed.
Key questions addressed by market microstructure include:
How are prices discovered?
Why do bid-ask spreads exist?
How does liquidity change during different market conditions?
How do large trades impact prices?
Understanding these dynamics is critical, especially for institutional traders whose large orders can move the market.
Core Elements of Market Microstructure
One of the most important elements is the order-driven market, where buyers and sellers place limit and market orders into an electronic order book. The best bid and best ask define the bid-ask spread, which represents the immediate cost of trading. Narrow spreads typically indicate high liquidity, while wide spreads suggest uncertainty or low participation.
Liquidity itself is a central concept. It reflects how easily an asset can be bought or sold without causing a significant price change. Institutions are highly sensitive to liquidity because executing large orders in illiquid markets can lead to unfavorable price movements, known as market impact.
Another critical component is order flow, which captures the sequence of buy and sell orders entering the market. Order flow carries information. Persistent buying or selling pressure often signals institutional activity and can influence short-term price movements even before fundamental news becomes public.
Price Discovery and Information Asymmetry
Market microstructure plays a vital role in price discovery, the process by which markets incorporate information into prices. Not all participants have the same information or the same speed of execution, leading to information asymmetry. Institutional players often invest heavily in research, data analytics, and technology to reduce this disadvantage.
In many cases, prices move not because of new public information, but because of changes in order flow or liquidity conditions. For example, when a large institution begins accumulating shares quietly, prices may gradually rise due to sustained demand, even without any news announcement.
Transaction Costs and Their Importance
For retail traders, transaction costs may seem minor, but for institutions trading millions of shares, they are crucial. Transaction costs include:
Explicit costs: brokerage fees, exchange fees, and taxes.
Implicit costs: bid-ask spread, market impact, and opportunity cost.
Institutional trading strategies are often designed primarily to minimize transaction costs, sometimes even more than to predict market direction. A strategy that predicts price movement correctly but incurs high market impact can still result in poor overall performance.
Institutional Trading Strategies and Microstructure Awareness
Institutional trading strategies are tightly linked to market microstructure. Unlike retail traders, institutions rarely place large market orders at once. Instead, they use sophisticated execution strategies to manage risk and reduce visibility.
One common approach is order slicing, where a large order is broken into smaller pieces and executed gradually. This reduces market impact and makes the trade less detectable. Algorithms such as VWAP (Volume Weighted Average Price) and TWAP (Time Weighted Average Price) are widely used to achieve this.
Another strategy involves liquidity-seeking behavior. Institutions may choose to trade during periods of high volume—such as market open, close, or during major news events—when liquidity is abundant and their trades can be absorbed with less price disruption.
Role of Algorithmic and High-Frequency Trading
Modern institutional trading relies heavily on algorithmic trading systems. These systems analyze real-time order book data, spreads, and volume to decide when and how to execute trades. Algorithms adapt dynamically to changing liquidity conditions, accelerating execution in liquid markets and slowing down when liquidity dries up.
High-frequency trading (HFT), although controversial, is also part of market microstructure. HFT firms act as liquidity providers, continuously posting bids and offers. While they tighten spreads and improve liquidity under normal conditions, they may withdraw during periods of stress, which can amplify volatility—something institutions must carefully manage.
Dark Pools and Off-Exchange Trading
To further reduce market impact, institutions often use dark pools, which are private trading venues where orders are not publicly displayed. Trading in dark pools allows large participants to execute trades anonymously without signaling their intentions to the broader market.
However, dark pool trading comes with trade-offs. While it reduces information leakage, it may offer less price certainty and slower execution. Institutions therefore balance between lit exchanges and dark pools depending on market conditions and urgency.
Risk Management Through Microstructure
Market microstructure is also crucial for risk management. Liquidity risk—the risk that a position cannot be exited without significant loss—is a major concern for institutions. By analyzing depth of market, historical volume, and spread behavior, institutions assess whether a position can be scaled in or out safely.
During periods of market stress, microstructure dynamics can change rapidly. Spreads widen, liquidity evaporates, and correlations increase. Institutional strategies often include contingency rules to pause trading, adjust order sizes, or switch venues when microstructure signals deteriorate.
Implications for Retail Traders
While retail traders do not operate at institutional scale, understanding market microstructure can still be highly beneficial. It explains why prices behave erratically during low-volume periods, why breakouts often fail when liquidity is thin, and why sudden spikes occur near market open or close.
By aligning trades with liquidity, avoiding low-volume traps, and recognizing institutional footprints through volume and order flow, retail traders can significantly improve execution quality and timing.
Conclusion
Understanding market microstructure provides a deep insight into how financial markets truly function beyond charts and indicators. For institutional traders, microstructure is the foundation upon which execution, strategy design, and risk management are built. Institutional trading strategies are not just about predicting price direction; they are about navigating liquidity, minimizing costs, managing information, and executing efficiently.
As markets continue to evolve with technology, algorithmic execution, and alternative trading venues, the importance of market microstructure will only increase. Whether you are an institutional participant or an individual trader aiming to think like one, mastering market microstructure is a powerful step toward more informed and disciplined trading decisions.
