Part 12 Trading Master Class Profit and Loss
Buyer’s profit can be unlimited (especially for call options) but the loss is limited to the premium paid.
Seller’s profit is limited to the premium received but losses can be unlimited.
Option Strategies
Traders combine calls and puts to form strategies like covered calls, straddles, strangles, spreads, etc., depending on whether they expect the market to rise, fall, or remain stable.
Uses of Options
Options are used for:
Hedging (reducing risk on existing positions)
Speculation (betting on price movements)
Income generation (through option writing)
Tradingideas

Part 11 Trading Master Class Strike Price
The strike price is the pre-decided price at which the option buyer can buy (call) or sell (put) the underlying asset.
Expiry Date
Options have a limited life. The expiry date is the last day the option can be exercised—after this, it becomes worthless.
Premium
The premium is the cost paid by the buyer to purchase the option. It’s determined by factors like time left to expiry, volatility, and distance from the strike price.
Leverage
Options provide high leverage—you can control large positions with a small amount of money. However, this also increases potential risk.

Part 2 Ride The Big Moves Understanding Call and Put Options
There are two main types of options: Call Options and Put Options.
Call Option:
A call option gives the holder the right to buy the underlying asset at a fixed strike price within a specified time.
Example: If you buy a call option on Reliance at ₹2,500 strike price and the price rises to ₹2,700, you can exercise your right to buy at ₹2,500 and profit from the difference.
Put Option:
A put option gives the holder the right to sell the underlying asset at a fixed strike price within a specified time.
Example: If you buy a put option on Infosys at ₹1,500 strike price and the stock falls to ₹1,300, you can sell at ₹1,500 and gain the difference.
Think of a Call Option as being bullish (expecting price rise) and a Put Option as being bearish (expecting price fall).

Part 1 Ride The Big Moves Introduction to Options Trading
Options trading is one of the most fascinating and flexible instruments in the financial market. It allows traders and investors to speculate, hedge, and generate income — all from the same market tool.
An option is a financial derivative — meaning its value is derived from an underlying asset, such as stocks, indices, commodities, or currencies. Options are contracts that give the buyer the right, but not the obligation, to buy or sell an asset at a specific price (called the strike price) before or on a particular date (called the expiry date).
In essence, options trading helps investors control large positions with relatively smaller amounts of capital while limiting risk when used correctly.

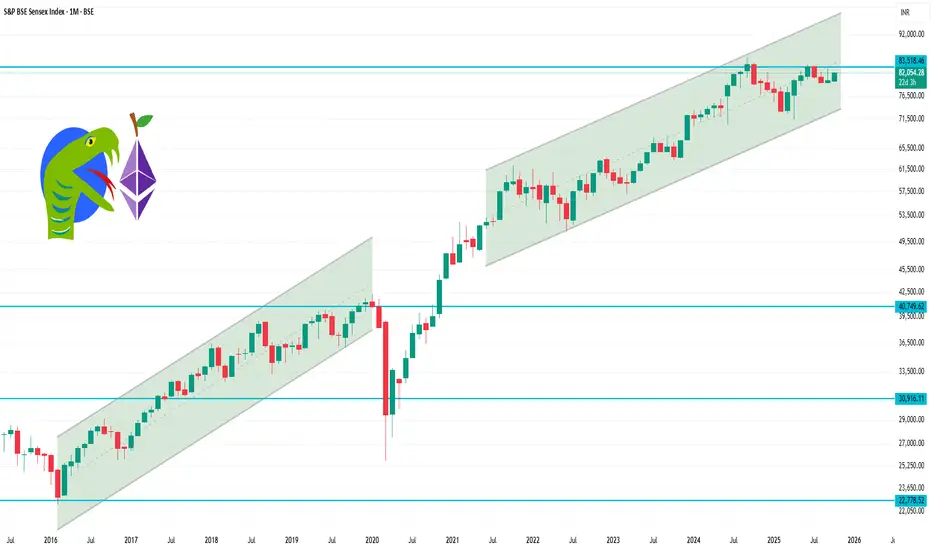
Sensex 1 Month Time Frame 1-Month Performance:
Closing Level: 81,773.66
Change: +1.22%
High: 82,257.74
Low: 81,646.08
52-Week High: 84,099.53
52-Week Low: 71,425.01
Over the past month, the Sensex has experienced a modest upward trend, reaching a high of 82,257.74 and a low of 81,646.08
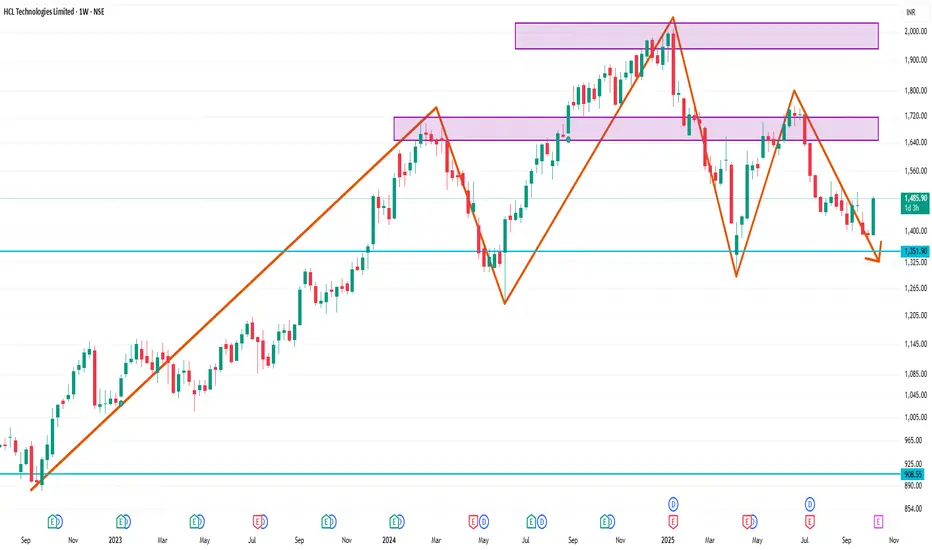
HCLTECH 1 Week Time Frame📈 1-Week Performance Overview
Current Price: ₹1,480.00 (as of October 9, 2025)
Weekly Gain: Approximately 6.51%
📊 Recent Trading Highlights
October 8, 2025: Closed at ₹1,452.85, up 1.34% from the previous day, outperforming the BSE SENSEX Index, which declined by 0.19%.
October 7, 2025: Closed at ₹1,433.65, marking a 1.20% increase, with the SENSEX Index rising by 0.17%.
October 3, 2025: Closed at ₹1,393.25, up 0.27%, while the SENSEX Index gained 0.28%.
📉 52-Week Range
52-Week High: ₹2,011.00 (January 13, 2025)
52-Week Low: ₹1,302.75
Current Price: ₹1,480.00
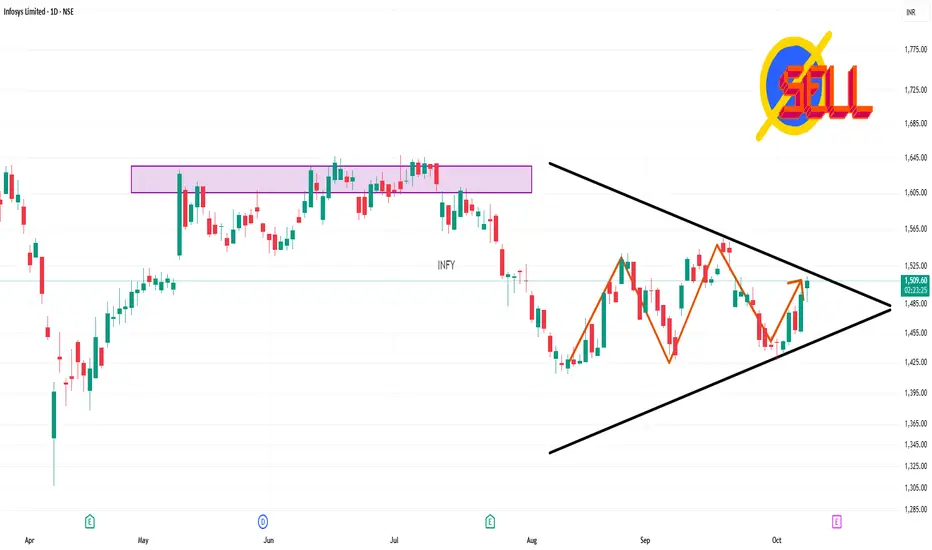
INFY 1 Day Time Frame 📈 Technical Overview (1-Day Timeframe)
Support & Resistance Levels
Immediate Support: ₹1,487.00
Immediate Resistance: ₹1,509.40
Pivot Point: ₹1,498.20
These levels are based on the current day's trading range and can serve as intraday reference points.
Moving Averages
5-Day: ₹1,453.10 (Buy)
10-Day: ₹1,463.10 (Sell)
20-Day: ₹1,491.33 (Sell)
50-Day: ₹1,480.74 (Sell)
100-Day: ₹1,534.03 (Sell)
200-Day: ₹1,614.71 (Sell)
The short-term moving averages indicate a bullish trend, while the longer-term averages suggest a bearish outlook.
Technical Indicators
Relative Strength Index (RSI): 43.75 — Neutral
Stochastic RSI: 25.04 — Neutral
MACD: -11.87 — Bearish
Rate of Change (ROC): -3.66 — Bearish
Commodity Channel Index (CCI): -63.85 — Neutral
These indicators suggest a neutral to slightly bearish momentum.
🔍 Market Sentiment
Infosys has become one of the most actively traded stocks today, particularly in call options, with significant volumes in various strike prices. The stock reached an intraday high, outperforming its sector. However, investor participation has declined, as evidenced by a notable drop in delivery volume.
⚠️ Summary
Infosys Ltd is currently experiencing a neutral to slightly bearish phase on the daily chart. While short-term support holds, the stock faces resistance near ₹1,509.40. Technical indicators like the MACD and ROC suggest downward momentum, and moving averages are predominantly signaling a sell. Traders should monitor the ₹1,509.40 resistance level closely; a breakout above this could shift the bias to bullish.
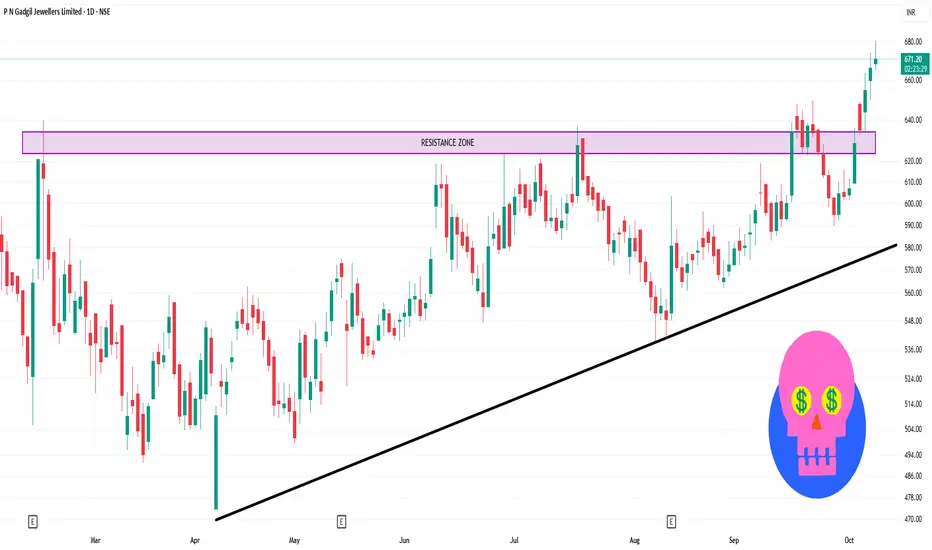
PNGJL 1 Day Time Frame 📈 Intraday Levels (1-Day Time Frame)
Opening Price: ₹668.50
Day’s Range: ₹665.10 – ₹680.65
VWAP (Volume-Weighted Average Price): ₹671.71
Previous Close: ₹666.45
Upper Circuit Limit: ₹733.05
Lower Circuit Limit: ₹599.80
🔧 Technical Indicators
Pivot Points: Classic Pivot Point at ₹663.48, with resistance levels at ₹672.61 (R1) and ₹687.38 (R2). Support levels are at ₹653.02 (S1) and ₹639.58 (S2).
Technical Analysis: The stock is currently in a "Strong Buy" position based on daily analysis, with 9 buy signals and 0 sell signals.
📊 Summary
P N Gadgil Jewellers Ltd is exhibiting a strong bullish trend on the 1-day time frame, with the stock trading above key pivot points and technical indicators signaling upward momentum. The stock has shown resilience, maintaining its position above ₹670.00 throughout the trading session.
For intraday traders, monitoring the resistance levels at ₹672.61 and ₹687.38 could provide insights into potential price targets, while support levels at ₹653.02 and ₹639.58 may act as indicators for possible pullbacks.
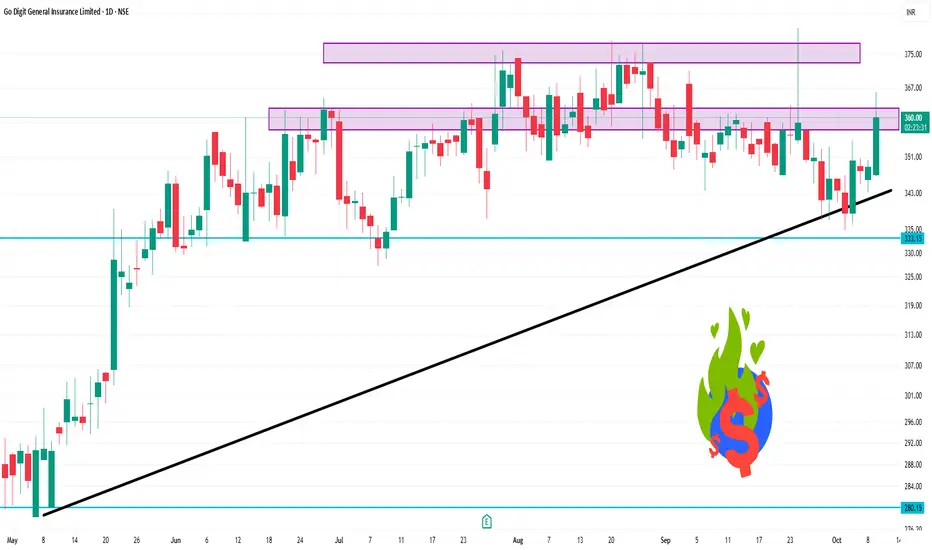
GODIGIT 1 Day Time Frame📊 Intraday Price Movement
Day’s Range: ₹346.65 – ₹350.15
Opening Price: ₹347.10
Closing Price (Previous Day): ₹348.80
Volume Traded: Approximately 55,201 shares
📈 Technical Indicators (1-Day Time Frame)
Relative Strength Index (RSI): 35.92 — indicates a neutral stance
Moving Averages:
5-Day EMA: ₹343.23 (Sell)
10-Day EMA: ₹346.88 (Sell)
20-Day EMA: ₹350.54 (Sell)
50-Day EMA: ₹351.97 (Sell)
100-Day EMA: ₹345.69 (Sell)
200-Day EMA: ₹334.59 (Buy)
MACD: -3.83 — suggests a potential buying opportunity
Commodity Channel Index (CCI): -206.91 — indicates a buying signal
Ultimate Oscillator: 28.51 — suggests a sell signal
Price Rate of Change (ROC): -5.88 — indicates a downward trend
🔍 Summary
The stock is exhibiting a neutral to slightly bearish trend in the short term, with several moving averages signaling a sell. However, indicators like MACD and CCI suggest potential buying opportunities. Investors should monitor for a sustained break above ₹350.00 for a more bullish outlook.
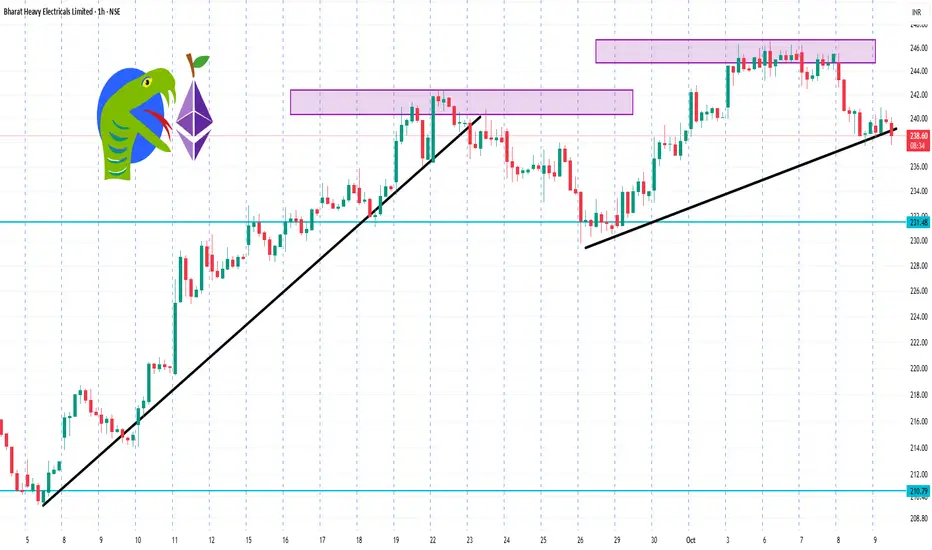
BHEL 1 Hour Time Frame 📉 1-Hour Technical Analysis Summary
Overall Signal: Strong Sell
Relative Strength Index (RSI): 41.43 — approaching oversold territory
MACD: -0.58 — indicating downward momentum
Stochastic Oscillator: 21.78 — confirming bearish bias
Average Directional Index (ADX): 54.36 — suggesting a strong trend
Williams %R: -76.66 — indicating oversold conditions
Commodity Channel Index (CCI): -68.24 — supporting bearish outlook
Pivot Levels:
Support: S1 = ₹238.45
Resistance: R1 = ₹240.85
These indicators collectively suggest a continuation of the current downtrend.
🔍 Key Price Levels
Intraday Support: ₹236.19
Intraday Resistance: ₹243.64
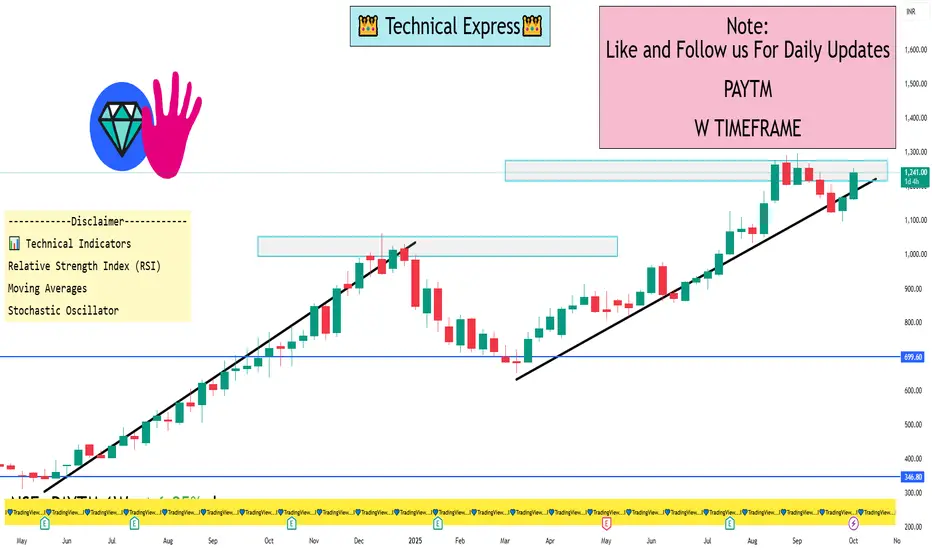
PAYTM 1 Week View 📈 Current Price Snapshot
Latest Price: ₹1,241.50
Day's Range: ₹1,224.30 – ₹1,247.80
52-Week Range: ₹651.50 – ₹1,296.60
🔧 Key Technical Levels (1-Week Timeframe)
Resistance Levels:
₹1,247.80 – Recent intraday high
₹1,288.30 – Near-term resistance zone
Support Levels:
₹1,224.30 – Recent intraday low
₹1,119.00 – Short-term support
📊 Technical Indicators
Relative Strength Index (RSI): 57.67 – Indicates bullish momentum without being overbought.
Moving Averages: Both short-term and long-term moving averages are in a bullish alignment, supporting the positive trend.
Stochastic Oscillator: In the bullish zone, suggesting continued upward momentum.
🧭 Summary
The stock is currently trading near its recent intraday high, indicating strong bullish momentum. With RSI and moving averages supporting the uptrend, PAYTM appears poised to test higher resistance levels in the near term. However, investors should monitor the stock's movement near the resistance level of ₹1,288.30 for potential breakout or reversal signals.
Trading Gold and Cryptocurrency in the Indian Market1. Overview of Gold Trading in India
Gold has deep cultural and economic significance in India. It is widely used in jewelry, savings, and investment, making India one of the largest consumers of gold globally.
1.1 Forms of Gold Investment
In India, gold trading occurs in several forms:
Physical Gold – Jewelry, coins, and bars.
Gold ETFs (Exchange-Traded Funds) – Allow investors to buy units representing gold without physically holding it.
Sovereign Gold Bonds (SGBs) – Issued by the Reserve Bank of India (RBI), providing interest along with appreciation in gold price.
Futures and Options – Traded on the Multi Commodity Exchange (MCX), providing leveraged exposure.
1.2 Gold Trading Mechanics
Gold trading in India, especially in the futures market, involves contracts with standard weights (1 kg, 100 grams, etc.). Prices fluctuate based on domestic demand, international gold prices, USD/INR exchange rates, and geopolitical tensions. Traders can go long (buy) or short (sell), using leverage to maximize returns, though this increases risk.
1.3 Strategies in Gold Trading
Trend Trading: Identifying upward or downward trends in international or domestic gold prices and trading accordingly.
Hedging: Using gold futures to protect portfolios from inflation or currency depreciation.
Arbitrage: Exploiting price differences between spot markets, ETFs, and futures.
1.4 Risks and Considerations
Gold is influenced by global market volatility.
Leverage can magnify losses.
Liquidity in physical gold is higher, but online platforms provide faster execution.
2. Overview of Cryptocurrency Trading in India
Cryptocurrency trading in India is still evolving. Cryptos are digital or virtual currencies that operate on blockchain technology. The most popular are Bitcoin (BTC), Ethereum (ETH), Ripple (XRP), and several altcoins.
2.1 Cryptocurrency Market in India
India has seen explosive growth in cryptocurrency adoption over the last few years. Exchanges like WazirX, CoinDCX, and ZebPay provide platforms for trading Bitcoin and other digital assets. Trading can occur in:
Spot Market: Buying and selling cryptocurrencies at current market prices.
Futures Market: Contracts allowing traders to speculate on future prices.
Margin Trading: Trading using borrowed funds to amplify gains (and risks).
2.2 Regulatory Landscape
Cryptocurrency regulations in India remain in flux:
RBI Restrictions: Previously, banks were restricted from providing services to crypto exchanges, but this has eased after Supreme Court intervention.
Taxation: Cryptocurrency gains are taxed at 30%, with a 1% TDS on transactions above a certain threshold.
Legal Status: Cryptos are legal to trade but not recognized as legal tender.
2.3 Strategies for Crypto Trading
Day Trading: Taking advantage of intraday volatility to make profits.
Swing Trading: Capitalizing on medium-term trends lasting days or weeks.
HODLing: Long-term holding based on belief in price appreciation.
Arbitrage: Exploiting price differences across exchanges.
2.4 Risks and Considerations
Cryptocurrencies are highly volatile; prices can swing 10-20% within hours.
Exchanges may face liquidity or security issues.
Regulatory changes can significantly impact prices.
3. Trading Platforms in India
3.1 Gold Trading Platforms
MCX (Multi Commodity Exchange): Futures and options.
Stock Broker Platforms: Zerodha, Upstox, ICICI Direct provide access to ETFs and SGBs.
Banks and Post Offices: For Sovereign Gold Bonds and physical gold.
3.2 Crypto Trading Platforms
WazirX: Popular for beginners with simple UI.
CoinDCX: Offers derivatives trading and margin facilities.
ZebPay: Secure platform with various coins available.
International Platforms: Binance and Kraken for Indian residents (with caution on regulations).
4. Technical and Fundamental Analysis
4.1 Gold
Technical Analysis: Uses price charts, trendlines, moving averages, and RSI to predict price movements.
Fundamental Analysis: Considers inflation rates, global demand, central bank policies, and geopolitical events.
4.2 Cryptocurrency
Technical Analysis: Chart patterns, candlestick formations, MACD, Bollinger Bands, and volume analysis.
Fundamental Analysis: Blockchain adoption, regulatory news, network updates, and market sentiment.
5. Risk Management
5.1 Gold
Diversify between physical gold, ETFs, and futures.
Limit leverage to avoid margin calls.
Monitor global gold prices and USD/INR movements.
5.2 Cryptocurrency
Trade only with capital you can afford to lose.
Use stop-loss orders to minimize losses.
Keep funds in secure wallets rather than exchanges for long-term holding.
Diversify across coins to spread risk.
6. Future Outlook
6.1 Gold
Gold will remain a core part of Indian investment due to cultural affinity and inflation hedging.
Global uncertainties, such as currency devaluation or geopolitical tensions, can drive prices higher.
6.2 Cryptocurrency
Adoption is expected to rise as digital literacy grows.
Regulations will play a pivotal role in shaping market stability.
Potential for blockchain-based applications beyond trading, including NFTs, DeFi, and metaverse assets.
Conclusion
Trading gold and cryptocurrencies in India offers unique opportunities for portfolio diversification. Gold provides stability and hedging against inflation, while cryptocurrencies offer potential high returns at higher risk. Success in both markets requires understanding the instruments, staying updated with global and domestic trends, employing technical and fundamental analysis, and practicing disciplined risk management.
Indian traders now have access to sophisticated platforms and instruments that enable both short-term speculation and long-term investment. Combining gold and cryptocurrencies strategically can help investors achieve a balance of security, growth, and speculative gains, ensuring a resilient and profitable portfolio in a rapidly evolving financial landscape.

Momentum Trading Secrets: Unlocking the Market’s Hidden Energy1. The Science of Momentum
Momentum trading is rooted in behavioral finance and market psychology. It leverages the tendency of investors to underreact or overreact to new information, creating sustained price moves. The basic scientific principle can be summarized as:
“Assets that have performed well recently are likely to continue performing well in the near future, and vice versa.”
Key aspects include:
Trend Identification: Momentum traders look for assets with strong directional movement.
Rate of Change (ROC): Calculating how fast an asset’s price is changing helps determine momentum strength.
Volume Confirmation: High trading volume validates the sustainability of a trend.
Behavioral Patterns: Fear and greed amplify trends, making momentum strategies more predictable.
2. Tools and Indicators in Momentum Trading
Momentum traders rely heavily on technical indicators to gauge the strength of a move. Some of the most effective tools include:
Relative Strength Index (RSI): Measures overbought or oversold conditions to anticipate potential trend continuations or reversals.
Moving Average Convergence Divergence (MACD): Helps identify trend direction and momentum shifts.
Stochastic Oscillator: Useful for spotting trend reversals or continuation signals in volatile markets.
Volume Weighted Average Price (VWAP): Indicates the average price weighted by volume, often used by institutional traders to confirm momentum.
Rate of Change (ROC): Measures the percentage change in price over a specific period, signaling momentum strength.
The secret lies in combining indicators rather than relying on one. For example, using RSI for trend strength and MACD for entry timing often produces higher-probability trades.
3. Secrets to Identifying True Momentum
Not all price movements represent genuine momentum. The following secrets help distinguish real trends from false signals:
Look Beyond the Noise: Small price fluctuations are often misleading. True momentum comes with consistent directional moves and high volume.
Time Frame Alignment: Momentum should be confirmed across multiple time frames. A short-term uptrend in a long-term downtrend can be risky.
Sector and Market Context: Stocks often move in sync with sectors. Identifying sector momentum can increase trade success.
Catalyst Awareness: Earnings reports, news events, and macroeconomic data often trigger strong momentum moves.
Volume Patterns: Sudden spikes in volume often precede sharp moves, indicating institutional participation.
4. Entry and Exit Strategies
Mastering momentum trading requires precise timing. Secrets in execution include:
Breakout Trading: Enter trades when price breaks key resistance or support levels with high momentum.
Pullback Entries: Waiting for minor retracements during a trend allows for safer entries at lower risk levels.
Trailing Stop Losses: Using dynamic stops that follow the trend ensures profits are locked in while letting winners run.
Scaling Positions: Incrementally increasing positions as momentum strengthens reduces risk exposure.
The critical secret: never fight the trend. Momentum trading is about riding the wave, not predicting reversals.
5. Risk Management Secrets
Momentum trading can be extremely profitable but also highly risky if not managed properly. Successful traders use:
Position Sizing: Limiting exposure to a small percentage of the trading account prevents catastrophic losses.
Stop Loss Discipline: Predefined exit points are crucial, as momentum can reverse quickly.
Diversification: Trading across multiple assets or sectors spreads risk while capturing diverse momentum opportunities.
Volatility Assessment: Understanding the volatility of the instrument ensures proper risk-reward alignment.
The secret is balancing aggressive profit potential with controlled risk, turning a volatile strategy into a sustainable one.
6. Psychological Edge in Momentum Trading
Momentum trading is as much about mindset as strategy. The key psychological secrets include:
Emotion Control: Fear and greed can destroy momentum trades. Sticking to rules and systems is vital.
Patience and Discipline: Waiting for the right setup rather than chasing price is a hallmark of successful traders.
Adaptability: Market conditions change. Momentum traders must adjust strategies to new trends, not rely on past performance.
Confidence vs. Overconfidence: Understanding the difference ensures consistent execution without reckless risk-taking.
7. Advanced Momentum Trading Techniques
Seasoned traders often leverage advanced techniques to amplify profits:
Sector Rotation Strategy: Moving capital into sectors showing strongest momentum while exiting weak sectors.
Pairs Trading with Momentum: Trading correlated assets by buying the stronger momentum asset and shorting the weaker.
Algorithmic Momentum Strategies: Using quantitative models to scan multiple instruments and automatically execute trades.
Options for Momentum Leverage: Using call and put options to magnify returns while managing capital efficiently.
These techniques reveal the “hidden secrets” of institutional-level momentum trading, making it more than just buying high and selling higher.
8. Common Mistakes to Avoid
Even experienced traders stumble when ignoring momentum trading rules. Common pitfalls include:
Chasing Trends Too Late: Entering after most of the move is over reduces profit potential.
Ignoring Volume: Low-volume momentum often reverses unexpectedly.
Over-Leveraging: Excessive leverage can wipe out accounts during sudden reversals.
Neglecting Market Context: Ignoring broader market trends can lead to false signals.
Awareness of these mistakes is a secret weapon in protecting both capital and confidence.
9. Case Studies of Momentum Trading Success
Momentum trading has produced legendary gains for traders who mastered its secrets. For instance:
Tech Stock Surges: Riding early momentum in high-growth tech companies during earnings announcements.
Commodity Moves: Capturing sharp momentum in oil or gold during geopolitical events.
Cryptocurrency Trends: Exploiting rapid price swings with disciplined momentum strategies.
These examples highlight that momentum trading is applicable across markets and time frames, provided the rules are followed.
10. The Future of Momentum Trading
With advancements in technology, momentum trading is evolving:
AI and Machine Learning: Algorithms can detect momentum patterns faster than human traders.
Social Sentiment Analysis: Platforms now measure crowd psychology and predict momentum based on social chatter.
High-Frequency Trading (HFT): Institutional traders use speed and algorithms to exploit tiny momentum shifts.
Traders who understand these trends and adapt their strategies will maintain a competitive edge in the future markets.
Conclusion
Momentum trading is an art backed by science. Its secrets lie not just in indicators or charts, but in understanding market psychology, managing risk, and executing trades with discipline. By mastering trend identification, entry and exit timing, and psychological control, traders can transform momentum strategies into consistent profit engines.
While momentum trading can seem risky, applying these secrets systematically turns volatility into opportunity. In today’s fast-moving markets, momentum trading remains one of the most powerful tools for traders willing to combine technical skill with strategic insight.
Demat Account Secrets in Trading —Every Traders Should KnowIntroduction
A Demat account is the digital locker for your shares and securities — the backbone of equity investing and trading in modern markets. But beyond opening an account and watching prices, there are plenty of practical, operational, and strategic “secrets” that experienced traders and long-term investors use to reduce costs, manage risks, and extract real value. This guide unpacks those lesser-known but high-impact insights: from choosing the right Depository Participant (DP) and optimizing charges, to advanced features like pledging, e-voting, corporate actions handling, fraud prevention, and tax implications. Whether you’re a frequent intraday trader, a swing trader, or a buy-and-hold investor, these tips will help you use your Demat account more intelligently.
1. Demat 101 — the fundamentals (so you can stop guessing)
A Demat (dematerialized) account holds securities in electronic format. In India, two depositories — NSDL and CDSL — maintain the records; brokers or banks act as Depository Participants (DPs) who provide the interface. When you buy shares, they land in your Demat account; when you sell, they are debited.
Key components:
DP (Depository Participant): Your broker/bank managing the Demat.
Client ID / Beneficiary Owner (BO) ID: Unique identifier for holdings.
ISIN: International Security Identification Number for each instrument.
Statement of Holdings (MSOH): Periodic summary of your holdings.
Understanding the basics helps avoid simple but costly mistakes, like missing corporate action deadlines or confusing a brokerage trading account fee with a DP demat charge.
2. Choosing the right DP — the biggest hidden lever for costs & convenience
Everyone talks about brokerage, but DP fees and service quality quietly shape net returns.
What to compare:
Account opening fees and annual maintenance charges (AMC) — DPs vary widely.
Transaction fees / custodian charges — per scrip or flat per transaction?
Pledge/unpledge fees — important if you use margin funding.
Speed & UI of the DP portal/app — corporate actions, e-voting, and statements are handled through the DP interface.
Customer service responsiveness — when issues arise (frozen shares, IPO refunds), fast support saves money.
Integration with your broker — some brokers offer bundled Demat+trading at lower cost.
Value-adds — auto-pay for corporate actions, consolidated statements, or tax reports.
A little fee shopping can save hundreds per year for active traders. If you trade frequently, prioritize low transaction/DVP (delivery versus payment) costs. If you hold long-term, low AMC and reliable corporate action handling matter more.
3. Know every charge — the micro-fees that add up
Demat-related costs are often small, but they compound.
Common fees:
Account opening fee
Annual maintenance charge (AMC)
Transaction charges (debited shares, off-market transfer)
Rematerialization fee (if you want physical certificates)
Pledge/unpledge fee
Dematerialization fee (converting physical to electronic)
Re-registration fee (if transferring DP)
Pro tip: Ask for a clear fee schedule before opening. Some DPs waive AMC for the first year or if you maintain a minimum balance.
4. Pledging shares — a secret weapon (and its pitfalls)
Pledging lets you use your Demat holdings as collateral for loans or margin from your broker or financial institution without selling them. This is a powerful tool but needs careful handling.
When to pledge:
To avoid selling for short-term margin calls.
To take loans against shares for diversification, emergency liquidity, or tax planning.
Risks & secrets:
Margin haircut: Lenders apply haircuts; volatile scrips get lower borrowing value.
Forced unpledge/sell: If the borrower (you or broker) defaults, the lender can liquidate.
Pledge charges & delays: Unpledging can take time; if markets move quickly you might not recover positions in time.
Keep pledged shares low proportion of total holdings to preserve flexibility.
Best practice: Use pledging conservatively and document the exact terms — interest, margin maintenance, and liquidation triggers.
5. Corporate actions — don’t let freebies slip away
Corporate actions include dividends, bonus shares, rights issues, stock splits, and buybacks. These affect your holdings and tax position.
Secrets:
Auto-execution settings: Some DPs auto-apply rights/renunciation choices; others require manual action. Know your DP’s default.
Track ex-dates and record dates: Missing a record date can mean missing a dividend or allocation.
Tax implications: Dividends and buybacks have different taxation; plan around holding periods to optimize capital gains tax.
Fractional shares from corporate actions may be paid out in cash — watch your account for small value credits.
Tip: Set calendar reminders for big corporate events for your core holdings.
6. Intraday trading & Demat — what traders often misunderstand
Many intraday traders think Demat doesn’t matter because intraday uses the trading account. But Demat still influences some things:
Delivery cycles: If you convert an intraday position to delivery, shares will land in your Demat only after settlement — check T+1/T+2 rules for the exchange.
Transaction vs delivery charges: No Demat debit for intraday (since shares aren’t delivered), but frequent delivery trades create more DP debits and costs.
Avoid unnecessary delivery: If you don’t intend to hold beyond the day, use intraday product to avoid DP transaction costs.
Secret: Using product/overnight margin vs MIS/Intraday modes changes margin requirements and whether shares actually hit your Demat account.
7. Security & fraud prevention — protect the locker
Scams target accounts everywhere. Protecting your Demat is non-negotiable.
Practical measures:
No POA unless necessary: Power of Attorney allows brokers to debit shares; while convenient, it’s a risk if given indiscriminately.
Two-factor authentication for broker/DPS portals.
Regularly reconcile your MSOH with transactions — report discrepancies immediately.
Keep KYC up to date — mismatches slow down corporate actions and transfers.
Beware phishing & SMS frauds: Never share OTPs, passwords, or UCCs.
Freeze facility: Many DPs offer "freeze" on holdings to prevent off-market transfer — useful if you detect suspicious activity.
Secret: If you must grant POA for ease of trading, limit it and use a reputable broker with transparent audit logs and insurance cover.
8. Reconciliation and statements — the daily routine of pros
Make it a habit:
Check daily trade reports and weekly Demat statements.
Match buy/sell confirmations with Demat credits/debits.
Track corporate action updates and small credits (fractional payouts, interest).
Why this matters: Small reconciliation catches — like a miscredited dividend or a failed transfer — can save disputes and losses later.
9. Off-market transfers & gifts — tax and legal subtleties
Off-market transfer (transfer of shares between Demat accounts without exchange) is common for gifts, family transfers, or private transactions.
Secrets:
Stamp duty & documentation: Gifts may require stamped transfer forms and declarations.
Gift taxation: In many jurisdictions, gifts from non-relatives have tax consequences. Document relationship and value.
Lock-in periods for ESOPs: Employee stock plans often have restrictions — off-market transfers may be blocked until vesting or expiry.
Always get the paperwork right to avoid future audits or blocked transfers.
10. IPO allotment & ASBA — how Demat helps get allocations
When you apply for IPOs, you must provide your Demat beneficiary ID. ASBA (Application Supported by Blocked Amount) ties refunds to the bank account, but Demat ensures shares — if allotted — are credited cleanly. Tip: Keep your Demat details updated and ensure PAN/DP mapping is correct to avoid allotment or transfer failures.
11. Taxation & reporting — your Demat is a tax record
Demat statements are primary source documents for capital gains calculations. Hidden advantages:
Broker consolidated statements often include trade-wise P&L and tax reports — use them for accurate filings.
Record holding periods precisely to differentiate between short-term and long-term rates.
Track cost basis across corporate actions — splits, bonus shares, and mergers alter cost per share; your DP statement and ISIN mapping help reconstruct basis.
Secret: Use consolidated transaction history from DP + broker to build an auditable trail for taxes.
12. Advanced tricks traders use (legitimately)
Scrip selection for pledge-margins: Keep a small basket of high-liquidity, low-volatility blue-chips for emergency pledges — they attract better haircuts.
Arbitrage of corporate actions: Professional traders sometimes buy before bonus/record dates to capture specific corporate actions, but account for ex-dates and tax impacts.
Fractional sell tactic: For small fractional leftover holdings after corporate actions, monitor for cash credits or plan an off-market consolidation to reduce micro-lots.
Caveat: All strategies must respect exchange rules and insider trading laws.
13. Common mistakes & how to avoid them
Giving POA to unknown brokers. Fix: Use limited POA or avoid if not necessary.
Ignoring AMC & small fees. Fix: Annual review of DP and renegotiate or switch.
Not tracking corporate action timelines. Fix: Subscribe to alerts and maintain a calendar.
Assuming all charges are the broker’s responsibility. Fix: Read fee schedule and keep records.
Failure to reconcile statements. Fix: Weekly reconciliation habit.
14. Switching DPs — the painless way
If you’re unhappy, transfer holdings using the Off-Market Transfer or Consolidation process. You’ll submit a DIS (Delivery Instruction Slip) at your current DP or use electronic transfer forms. Watch for transfer fees and timing — sometimes it’s cheaper to transfer slowly to avoid peak fees.
Secret: Coordinate transfer during low market activity to avoid missing corporate action deadlines.
15. Final checklist — your Demat hygiene
Know your DP’s fee schedule inside out.
Keep KYC & bank details updated and linked.
Avoid giving unrestricted POA; prefer limited authorizations.
Reconcile statements weekly.
Use pledge sparingly and understand haircut rules.
Track corporate action dates and tax implications.
Enable strong authentication and freeze options if suspicious activity occurs.
Use consolidated broker/DP tax reports at filing time.
Conclusion
A Demat account is more than a passive repository — it’s an operational hub for your market activity. Traders who master its mechanics and hidden levers (fee optimization, pledge use, corporate action handling, security practices) gain efficiency, reduce unexpected costs, and protect themselves from fraud. Whether you’re day-trading, swing trading, or building a long-term portfolio, treat your Demat account with the same discipline you apply to strategy and risk management. Small operational advantages compound over months and years — and often separate consistent winners from unlucky participants.
Midcap Multi-Bagger Moves in Trading1. Understanding Midcap Stocks
Midcap stocks generally refer to companies with a market capitalization ranging between ₹5,000 crore to ₹20,000 crore (or $500 million to $5 billion) depending on the market. They strike a balance between stability and growth potential:
Large-cap stocks are stable but slow-growing.
Small-cap stocks offer high growth but come with extreme volatility.
Midcap stocks combine growth potential with manageable risk, making them ideal candidates for multi-bagger moves.
Midcaps are often in the growth phase of their lifecycle. They have proven business models but are not yet fully recognized by institutional investors. This under-representation creates opportunities for early investors to gain extraordinary returns.
2. Characteristics of Midcap Multi-Bagger Stocks
Not all midcap stocks become multi-baggers. Successful midcap multi-baggers usually share some common characteristics:
Strong Revenue and Earnings Growth: Companies showing consistent growth in revenue and net profits, often higher than industry averages.
Scalable Business Model: Ability to expand operations, enter new markets, or increase product offerings without proportionally increasing costs.
Innovative Products/Services: Midcaps introducing unique products or services that create market disruption.
High Return Ratios: Consistently high ROE (Return on Equity) and ROCE (Return on Capital Employed) indicate efficient use of capital.
Low Debt Levels: Companies with manageable debt can reinvest profits into growth rather than servicing loans.
Institutional Recognition: Gradual interest from mutual funds and large investors often acts as a catalyst for price appreciation.
3. Factors Driving Multi-Bagger Moves
The movement of midcap stocks into multi-bagger territory is driven by a combination of fundamental, technical, and macroeconomic factors:
a) Fundamental Drivers
Profitability Expansion: Companies increasing margins due to operational efficiency, technology adoption, or scale benefits.
Sectoral Tailwinds: Industries experiencing high demand, regulatory support, or government incentives (like IT, renewable energy, pharmaceuticals).
Market Share Gains: Companies successfully capturing competitors’ market share through innovation or cost leadership.
b) Technical Drivers
Breakout Patterns: Price movements above historical resistance levels often attract momentum traders.
Volume Expansion: Rising volumes signal genuine investor interest and reduce liquidity concerns.
Institutional Accumulation: When large investors buy in gradually, it supports price stability and long-term uptrend.
c) Macroeconomic Factors
Economic Growth: Midcaps benefit more in a growing economy due to scalability and higher discretionary spending.
Policy Support: Favorable government policies like Make in India, tax incentives, or industry-specific reforms accelerate growth.
Liquidity Conditions: Low-interest rates and higher retail participation often drive up stock prices, including midcaps.
4. Strategies to Identify Midcap Multi-Baggers
Investors employ multiple strategies to identify potential midcap multi-baggers:
Fundamental Analysis:
Analyze balance sheets for revenue and profit growth.
Assess profitability ratios like ROE, ROCE, and profit margins.
Check debt-to-equity ratios and cash flows.
Sectoral Analysis:
Identify industries with high growth potential.
Look for midcaps within these sectors that are leaders or emerging leaders.
Technical Screening:
Use moving averages, trend lines, and volume indicators to spot breakout stocks.
Identify consolidation patterns that precede a rally.
Growth vs. Valuation Analysis:
A true multi-bagger is often undervalued relative to its growth potential.
Metrics like PEG ratio (Price/Earnings to Growth) can be useful.
Tracking Promoter Holding and Insider Buying:
Increasing promoter confidence is often a precursor to stock price appreciation.
Macro Awareness:
Be aware of government initiatives, economic cycles, and sector-specific reforms.
5. Risks Associated with Midcap Multi-Baggers
While midcap multi-baggers are enticing, they come with risks that every trader should be aware of:
Volatility: Prices can fluctuate dramatically due to low liquidity.
Market Sentiment: Negative news or global macro events can disproportionately impact midcaps.
Execution Risk: Companies may fail to scale operations efficiently, leading to missed expectations.
Overvaluation Risk: During bull markets, midcaps often get overvalued, leading to corrections.
Regulatory Risk: Policy changes can affect midcap companies more than established large-cap firms.
Risk management strategies like stop-loss orders, portfolio diversification, and position sizing are crucial to protect capital.
6. Trading Approaches for Midcap Multi-Baggers
There are multiple ways to approach midcap multi-bagger stocks in trading:
a) Long-Term Investment (Buy & Hold)
Buy fundamentally strong midcaps with multi-bagger potential.
Hold through market volatility to realize exponential gains over 3-5 years.
b) Momentum Trading
Focus on midcaps showing breakout patterns, high relative strength, and institutional buying.
Enter during upward trends and exit once momentum weakens.
c) Swing Trading
Identify short-term price oscillations in fundamentally strong midcaps.
Capitalize on price swings while limiting exposure to prolonged downturns.
d) Options Strategies
Use call options to leverage returns with limited capital in highly promising midcap stocks.
Protective puts can hedge against unexpected downtrends.
7. Case Studies of Midcap Multi-Baggers
Several midcap companies in India and globally have delivered exceptional returns:
Bajaj Finance (India) – Evolved from midcap to large-cap, delivering 10x+ returns over a decade.
Page Industries (India) – Niche player in textiles, achieved multi-bagger status due to consistent growth.
Eicher Motors (India) – Benefited from strong product positioning and market share gains.
Case studies highlight the importance of timely investment, research, and patience in reaping multi-bagger benefits.
8. Tips for Retail Traders
Diversify: Avoid putting all capital into one midcap stock.
Focus on Fundamentals: Short-term volatility may be high, but strong fundamentals increase multi-bagger chances.
Monitor Trends: Follow market news, sector growth, and macroeconomic indicators.
Patience is Key: Multi-bagger moves often take 3–7 years to materialize.
Avoid Herd Mentality: Don’t chase stocks just because they are trending; focus on research-based picks.
Conclusion
Midcap multi-baggers represent a unique opportunity for traders and investors willing to balance risk and reward. These stocks lie at the intersection of growth, innovation, and market inefficiencies. While identifying them requires a combination of fundamental research, technical analysis, and macroeconomic awareness, the potential rewards can be extraordinary. By understanding the drivers, risks, and strategies involved, traders can position themselves to benefit from the transformational wealth creation that midcap multi-baggers offer.
The world of midcap trading is not for the faint-hearted, but for disciplined investors with a growth mindset, it can be the playground of extraordinary returns.
Advanced Option Strategies1. Understanding Advanced Option Strategies
Advanced option strategies involve combining multiple option positions in ways that optimize outcomes for specific market scenarios. Unlike straightforward buying or selling of single options, these strategies use combinations of calls, puts, or both, sometimes with different strike prices and expiration dates, to achieve nuanced profit/loss structures.
Traders use these strategies for several reasons:
Hedging: Protect existing portfolios against adverse price movements.
Speculation: Take calculated bets on the direction, volatility, or timing of price movements.
Income Generation: Earn premiums through selling options while controlling risk.
Volatility Trading: Profit from changes in implied volatility rather than price direction alone.
To successfully implement advanced option strategies, traders must have a deep understanding of option Greeks (Delta, Gamma, Theta, Vega, and Rho), as these metrics determine how option prices react to market movements.
2. Popular Advanced Option Strategies
2.1 Spreads
Spreads involve buying and selling options of the same type (calls or puts) on the same underlying asset but with different strike prices or expiration dates. Spreads can be broadly categorized into vertical spreads, horizontal spreads, and diagonal spreads.
2.1.1 Vertical Spreads
Vertical spreads involve buying and selling options with the same expiration date but different strike prices. They can be bullish or bearish.
Bull Call Spread: Buy a call at a lower strike and sell a call at a higher strike. This strategy limits both profit and loss and is profitable if the stock price rises moderately.
Bear Put Spread: Buy a put at a higher strike and sell a put at a lower strike. Profitable if the underlying declines moderately.
Example: A stock trading at $100:
Buy 1 call at $100 strike for $5
Sell 1 call at $110 strike for $2
Net cost: $3, Maximum gain: $7, Maximum loss: $3
2.1.2 Horizontal (Time) Spreads
Also called calendar spreads, horizontal spreads involve options with the same strike price but different expiration dates.
Long Calendar Spread: Buy a long-dated option and sell a short-dated option at the same strike. This strategy profits from low volatility and time decay.
2.1.3 Diagonal Spreads
A combination of vertical and horizontal spreads, diagonal spreads involve options with different strikes and expiration dates. These allow traders to take advantage of both time decay and directional moves.
2.2 Straddles and Strangles
These strategies are designed to profit from volatility, regardless of price direction.
2.2.1 Straddle
A straddle involves buying a call and a put at the same strike price and expiration date. Traders use straddles when they expect significant price movement but are unsure of the direction.
Pros: Unlimited profit potential if the underlying makes a large move.
Cons: High cost due to purchasing two options, risk of losing premium if the price remains stable.
2.2.2 Strangle
A strangle is similar to a straddle but uses out-of-the-money options. This makes it cheaper but requires a bigger price movement to be profitable.
Example: Stock at $100:
Buy 1 OTM call at $105
Buy 1 OTM put at $95
Outcome: Profitable if the stock moves significantly beyond $105 or below $95.
2.3 Butterfly Spreads
Butterfly spreads are limited-risk, limited-reward strategies that involve three strike prices. The most common is the call butterfly spread:
Buy 1 call at lower strike
Sell 2 calls at middle strike
Buy 1 call at higher strike
This strategy profits if the underlying price remains near the middle strike at expiration. Variants include put butterflies and iron butterflies.
Iron Butterfly: Combines a call and put spread, offering a strategy that benefits from low volatility with defined risk and reward.
2.4 Condors
Condor strategies, like butterflies, involve four strikes and aim to profit from a narrow price range.
Iron Condor: Sell an OTM put and OTM call, and buy further OTM put and call to limit risk.
Pros: Generates income in low volatility markets.
Cons: Limited profit, requires precise range predictions.
2.5 Ratio Spreads
Ratio spreads involve buying and selling options in unequal quantities. For instance, a trader might buy 1 call and sell 2 calls at a higher strike.
Pros: Can generate credit upfront, benefit from moderate moves.
Cons: Unlimited risk if the underlying moves sharply beyond the sold options.
2.6 Backspreads
Backspreads are the opposite of ratio spreads: they involve selling fewer options and buying more further out-of-the-money options. Traders use them when expecting large moves in the underlying asset.
Example: Sell 1 ATM call, buy 2 OTM calls.
Outcome: Profitable if the stock surges, limited risk if the stock drops slightly.
2.7 Synthetic Positions
Synthetic strategies replicate the payoff of holding the underlying asset using options:
Synthetic Long Stock: Buy a call and sell a put at the same strike and expiration.
Synthetic Short Stock: Sell a call and buy a put.
These strategies allow traders to gain exposure to price movements without actually holding the underlying stock.
2.8 Box Spread
A box spread is a combination of a bull call spread and a bear put spread, effectively creating a riskless arbitrage if executed correctly.
Profit/Loss: The spread’s value converges to the difference between strikes at expiration, usually used by professional traders for interest rate arbitrage.
3. Practical Considerations
Advanced option strategies require careful planning and risk management. Key considerations include:
Volatility: High implied volatility increases option premiums, affecting the profitability of debit vs. credit strategies.
Time Decay (Theta): Strategies like calendar spreads benefit from time decay, while long options lose value as expiration approaches.
Liquidity: Illiquid options can have wide bid-ask spreads, increasing execution costs.
Greeks Management: Understanding Delta, Gamma, Vega, and Theta is critical for predicting how positions respond to market changes.
Margin Requirements: Complex strategies, especially those with naked positions, may require significant margin.
4. Risk Management
Even advanced strategies carry risks. Techniques to manage risk include:
Diversification: Avoid putting all capital into a single underlying or strategy.
Stop-Loss Orders: Predefined exit points can prevent large losses.
Position Sizing: Limit exposure per trade to a fraction of the total portfolio.
Adjustments: Rolling or converting positions can mitigate adverse movements.
5. Advantages of Advanced Option Strategies
Flexibility: Traders can structure strategies for bullish, bearish, or neutral market conditions.
Defined Risk: Many strategies offer limited-risk exposure compared to outright positions in the underlying asset.
Profit from Volatility: Traders can earn profits even in sideways markets.
Portfolio Hedging: Protects against large moves without selling assets.
6. Challenges and Limitations
Complexity: Understanding multiple legs, Greeks, and expiration cycles can be challenging.
Execution Costs: Commissions and slippage can reduce profits.
Market Timing: Many strategies require precise timing and predictions.
Psychological Pressure: Multi-leg trades can be stressful and require constant monitoring.
7. Conclusion
Advanced option strategies offer traders sophisticated tools to manage risk, speculate on price movements, and generate income. From spreads and straddles to butterflies and synthetic positions, each strategy has unique characteristics suited for different market conditions. Success in these strategies requires a thorough understanding of option pricing, Greeks, volatility, and risk management techniques. While the rewards can be substantial, the complexity and risks demand disciplined execution, continual learning, and practice.
For traders willing to invest the time in mastering these strategies, options provide a versatile framework to navigate today’s dynamic markets and optimize portfolio performance.
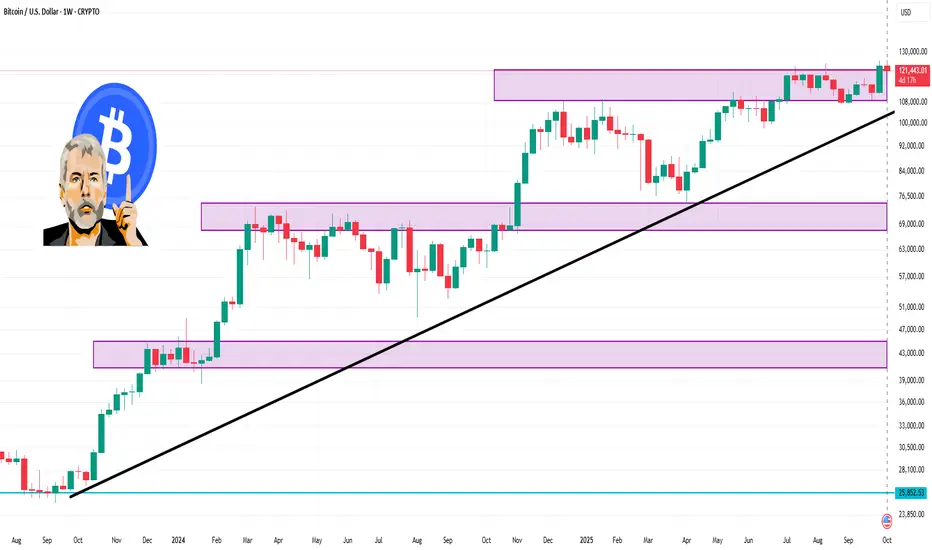
BTC against USD 1 Week Time Frame 📊 Weekly Technical Levels
Resistance Levels:
$124,652.59
$127,266.08
$129,248.44
Support Levels:
$120,056.73
$118,074.38
$115,460.88
These levels are based on Barchart's technical analysis and are derived from the most recent data available.
📈 Technical Indicators
Relative Strength Index (RSI): The RSI is currently at 61.95%, indicating that Bitcoin is neither overbought nor oversold.
Stochastic Oscillator: Both the %K and %D lines are in the 80% range, suggesting that Bitcoin is in an overbought condition, which could precede a pullback.
Average True Range (ATR): The 9-day ATR is 3,316.77, indicating a daily price movement of approximately 2.73%.
Directional Movement Index (DMI): The +DI is at 35.72, and the -DI is at 10.17, suggesting a strong bullish trend.
🔮 Market Outlook
Analysts project that Bitcoin may reach up to $126,865 within the next week, with a potential target of $129,753 over the next four weeks.
⚠️ Risk Considerations
While the long-term outlook appears bullish, it's essential to monitor key support levels. A drop below $120,000 could signal a short-term correction. Additionally, the stochastic oscillator indicates an overbought condition, which may lead to a pullback.
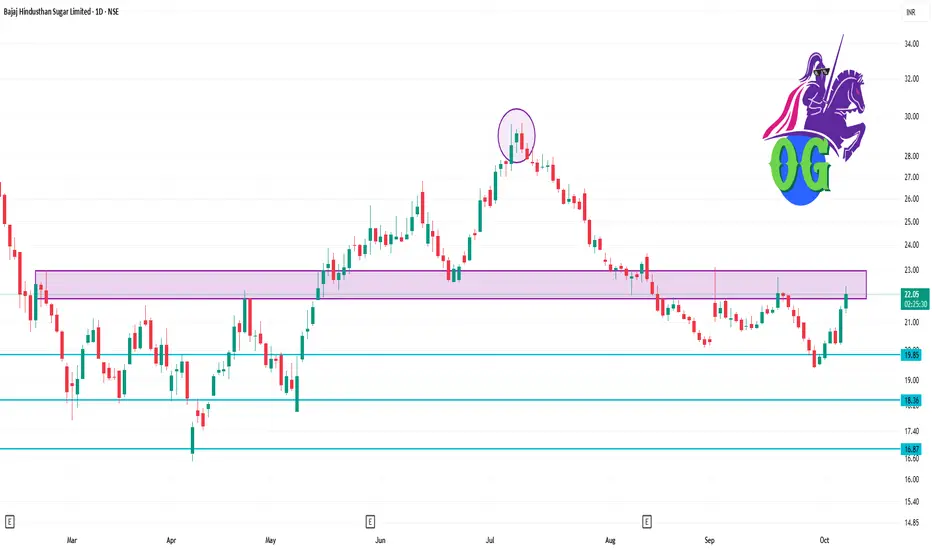
BAJAJHIND 1 Day Time Frame 📈 Current Price Action
Current Price: ₹21.79
Day's Range: ₹21.23 – ₹22.34
Volume: ~9.15 million shares traded
VWAP: ₹21.91
52-Week Range: ₹16.56 – ₹40.75
The stock has shown a positive movement today, trading above key pivot levels and indicating a continuation of the uptrend.
🔧 Key Technical Levels
📌 Pivot Points
Central Pivot Point (CPR): ₹21.09
Support Levels:
S1: ₹20.59
S2: ₹19.69
S3: ₹19.19
Resistance Levels:
R1: ₹21.99
R2: ₹22.49
R3: ₹23.39
Camarilla Pivot:
R2: ₹21.74
S2: ₹21.22
The stock is currently trading above the central pivot point, suggesting a bullish intraday bias.
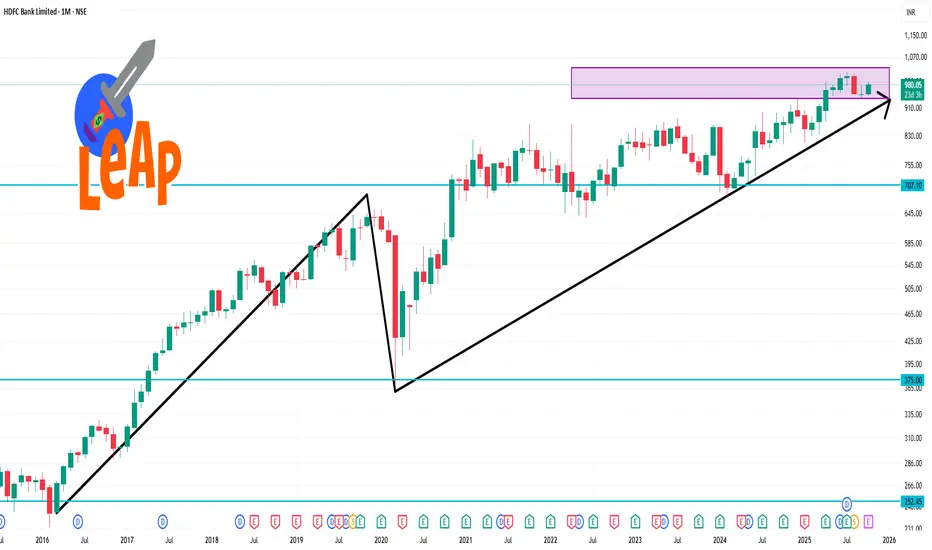
HDFCBANK 1 Month Time Frame 📊 1-Month Technical Outlook
Technical Rating: Strong Buy
Pivot Points:
Classic: Pivot: ₹960.28 | Support: ₹937.03, ₹951.12 | Resistance: ₹974.37, ₹983.53, ₹997.62
Fibonacci: Pivot: ₹960.28 | Support: ₹945.91, ₹951.40 | Resistance: ₹974.65, ₹983.53
Camarilla: Pivot: ₹961.30 | Support: ₹961.09, ₹963.80 | Resistance: ₹967.85, ₹969.21
Moving Averages:
Short-Term (MA5, MA10, MA20): Buy
Medium-Term (MA50): Sell
Long-Term (MA100, MA200): Buy
Relative Strength Index (RSI): 50.54 (Neutral)
MACD: -4.82 (Sell)
Average True Range (ATR): 13.27 (Moderate Volatility)
ADX (Trend Strength): 19.12 (Weak Trend)
Williams %R: -36.70 (Buy)
Commodity Channel Index (CCI): -13.66 (Neutral)
Rate of Change (ROC): -0.22 (Sell)
🔍 Summary
HDFC Bank's stock shows a bullish trend over the past month, with positive technical indicators and a strong buy signal. However, the neutral RSI and sell signal from the MACD suggest caution. Investors should monitor these indicators closely for potential shifts in market sentiment.
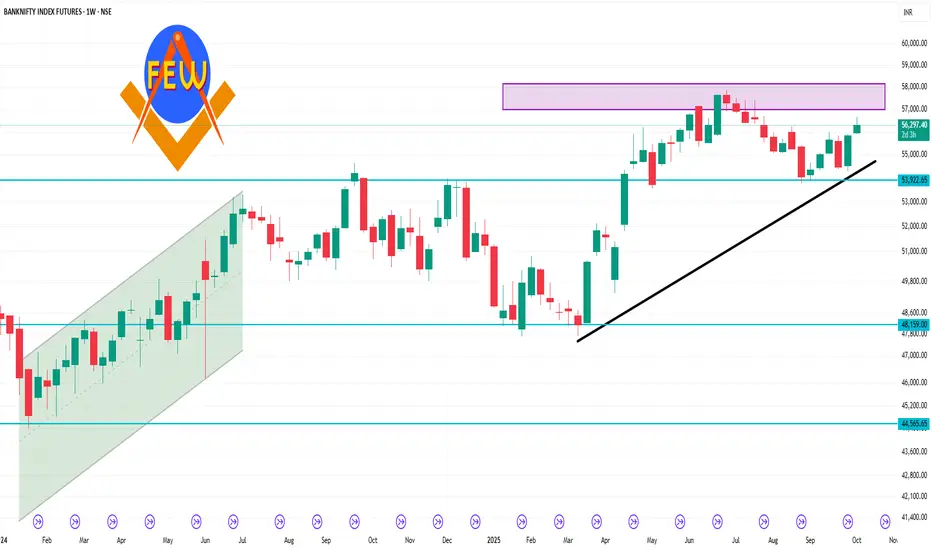
Banknifty 1 Week Time Frame 📊 Current Technical Snapshot
Spot Level: Approximately 55,900
Trend: Neutral to slightly bullish
Support Levels: 55,531; 55,778; 56,009
Resistance Levels: 56,486; 56,733; 56,964
🔍 Key Observations
Consolidation Zone: The Bank Nifty is trading within a defined range, with immediate support near 55,850–55,750 and resistance around 56,650–56,750. A breakout above 56,800 could target 57,000.
Bullish Bias: Sustaining above the 56,000 level may lead to a rally towards the 56,500–56,800 zone, followed by 57,000.
Rising Wedge Pattern: The index is forming a rising wedge, indicating potential consolidation with a chance of reversal. Immediate resistance lies around the 56,400 level, with a strong supply zone leading to potential reversal or selling pressure. A decisive breakout above 56,600 would turn bullish.
📈 Weekly Outlook (October 8–10, 2025)
Bullish Scenario: A breakout above 56,800 could target 57,000, with further upside potential.
Bearish Scenario: Failure to hold above 55,750 may lead to a decline towards 55,500 or lower.
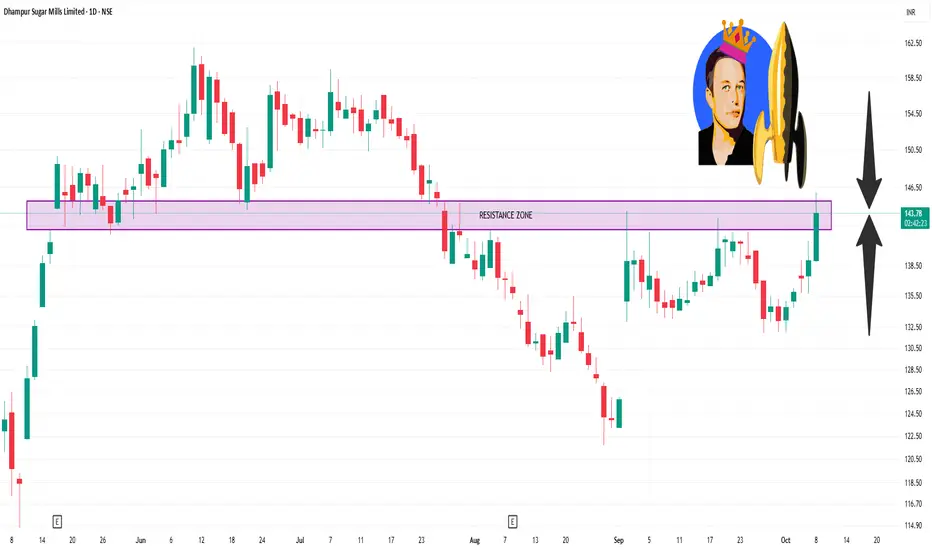
DHAMPURSUG 1 Day Time Frame 📊 Intraday Support & Resistance Levels
Based on recent technical analyses, here are the key levels for intraday trading:
Resistance Levels:
R1: ₹141.44
R2: ₹143.87
R3: ₹146.74
Support Levels:
S1: ₹136.14
S2: ₹133.27
S3: ₹130.84
These levels are derived from the Classic pivot point method and are calculated based on the price range of the previous trading day.
🔄 Pivot Points
The pivot point for today is ₹138.57, with variations in resistance and support levels across different methods:
Classic Pivot Point:
Pivot: ₹138.57
Resistance: ₹141.44, ₹143.87, ₹146.74
Support: ₹136.14, ₹133.27, ₹130.84
Fibonacci Pivot Point:
Pivot: ₹138.57
Resistance: ₹140.59, ₹141.84, ₹143.87
Support: ₹136.54, ₹135.29, ₹133.27
Camarilla Pivot Point:
Pivot: ₹138.57
Resistance: ₹139.51, ₹139.99, ₹140.48
Support: ₹138.53, ₹138.05, ₹137.56
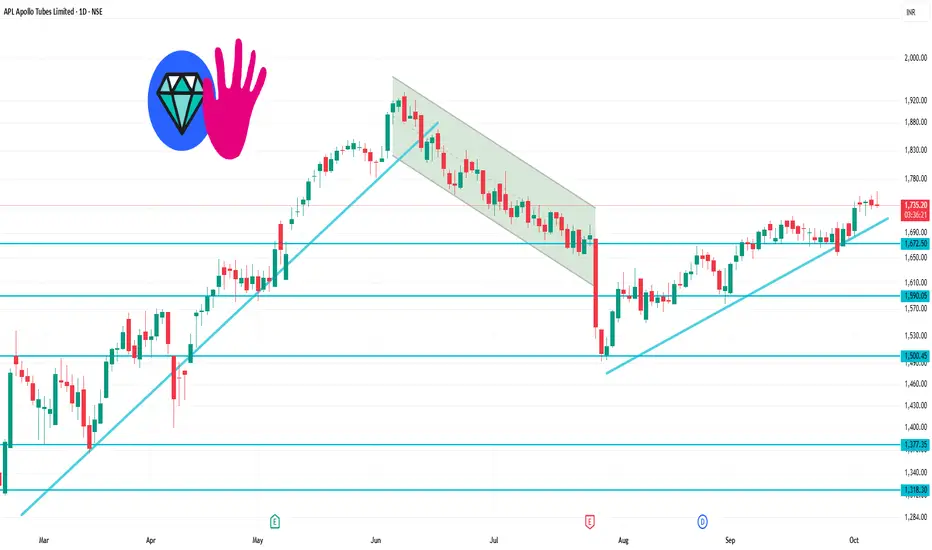
APLAPOLLO 1 Day Time Frame📊 Intraday Support & Resistance Levels
Immediate Support Levels: ₹1,717.57 and ₹1,733.63
Immediate Resistance Levels: ₹1,764.6 and ₹1,764.6
📈 Pivot Points
Standard Pivot Point: ₹1,749.57
Camarilla R3: ₹1,742.82
Fibonacci Resistance: ₹1,748.19
📉 Technical Indicators
Overall Technical Strength: Strong Buy
Moving Averages: Bullish
Oscillators: Bullish
🔮 Trend Outlook
The stock is trading above key support levels, indicating a potential continuation of the upward trend. However, it's essential to monitor for any signs of reversal or consolidation near resistance levels.
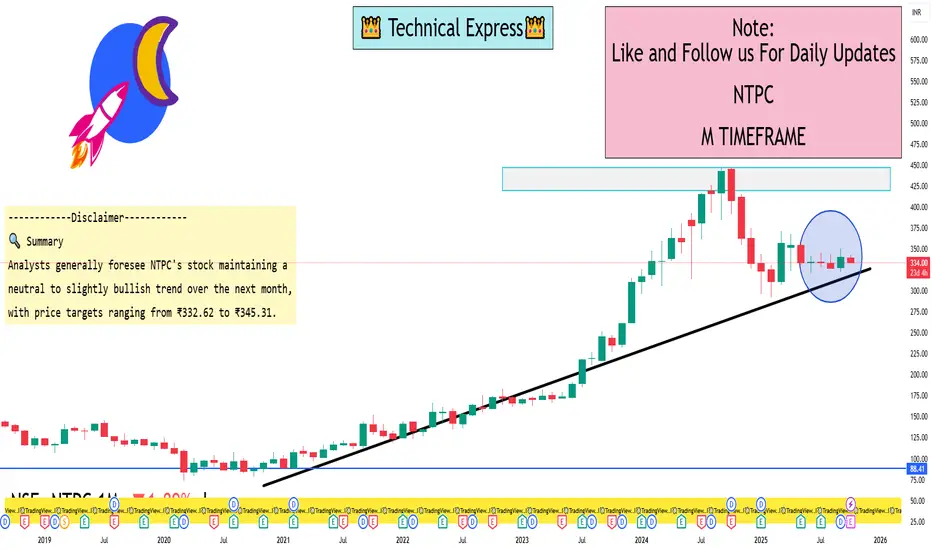
NTPC 1 Month View📊 1-Month Price Targets & Forecasts
WalletInvestor: Projects a price range of ₹332.62 to ₹345.31 within the next 14 days, with a potential upside to ₹416.02 over the next year.
MunafaSutra: Identifies immediate support at ₹326.63 and resistance at ₹338.93, suggesting a sideways trading range.
StockInvest.us: Anticipates NTPC's stock to trade between ₹319.95 and ₹343.83 over the next 3 months, indicating a neutral trend.
🔍 Summary
Analysts generally foresee NTPC's stock maintaining a neutral to slightly bullish trend over the next month, with price targets ranging from ₹332.62 to ₹345.31. The consensus suggests potential upside, but the stock may experience fluctuations within this range.