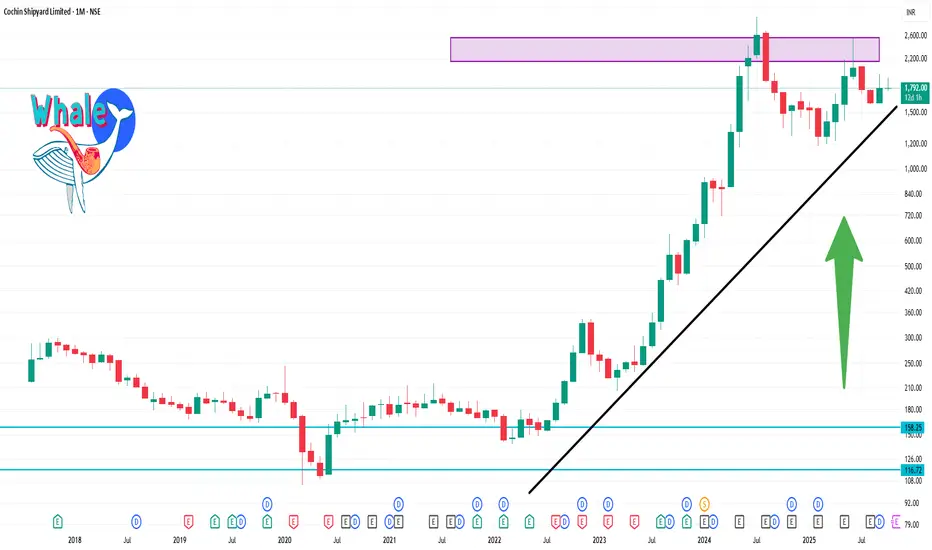
COCHINSHIP 1 Month Time Frame 📊 Current Stock Price
Current Price: ₹1,792.00
Daily Range: ₹1,773.00 – ₹1,824.00
52-Week Range: ₹1,180.20 – ₹2,545.00
Market Cap: ₹47,144 Crore
P/E Ratio (TTM): 56.07
Book Value: ₹213
Dividend Yield: 0.54%
ROE: 15.8%
ROCE: 20.4%
Face Value: ₹5.00
VWAP: ₹1,792.00
Volume: 1,101,864 shares traded today
📈 Support and Resistance Levels
Immediate Support: ₹1,773.00
First Resistance: ₹1,824.00
Breakout Resistance: ₹1,844.00 – A breakout above this level could target ₹1,918, ₹1,992, and potentially ₹2,097
Tradingideas
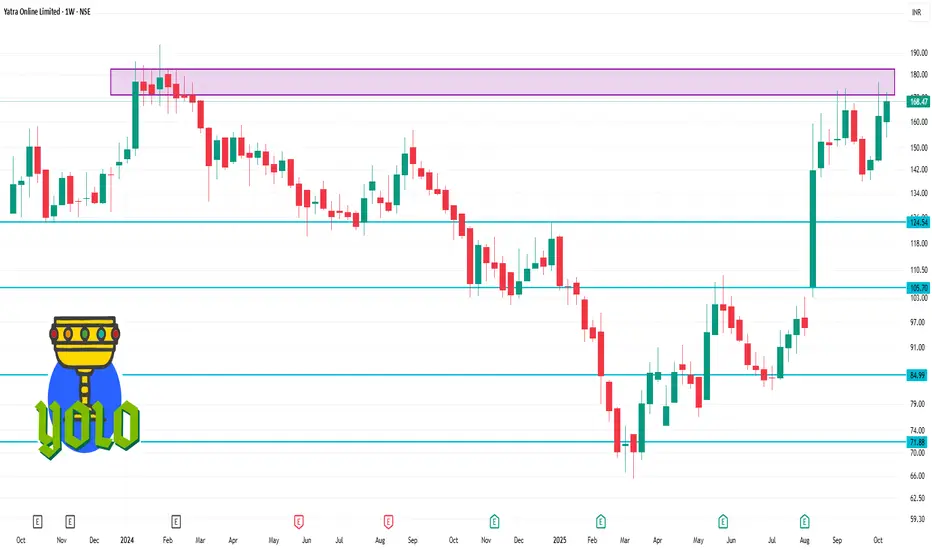
YATRA 1 Week Time Frame 📈 1-Week Price Performance (Oct 10–Oct 17, 2025)
Opening Price (Oct 10): ₹162.23
Closing Price (Oct 17): ₹168.47
Weekly Gain: +3.85%
This upward trend indicates a steady recovery and positive sentiment among investors.
🔍 Key Highlights
52-Week Range: ₹65.51 – ₹176.66
Market Capitalization: ₹2,643.57 crore
P/E Ratio: 53.15
P/B Ratio: 3.29
Earnings Per Share (EPS): ₹3.09 (as of June 2025)
These metrics suggest that while the stock is trading at a premium, it reflects the market's expectations of future growth.
📊 Technical Indicators
50-Day Simple Moving Average (SMA): ₹148.20
200-Day SMA: ₹104.50
Relative Strength Index (RSI): 64.5 (indicating moderate bullish momentum)
Money Flow Index (MFI): 76.1 (approaching overbought territory)
These indicators suggest that the stock is in a strong uptrend, though investors should monitor for potential overbought conditions.
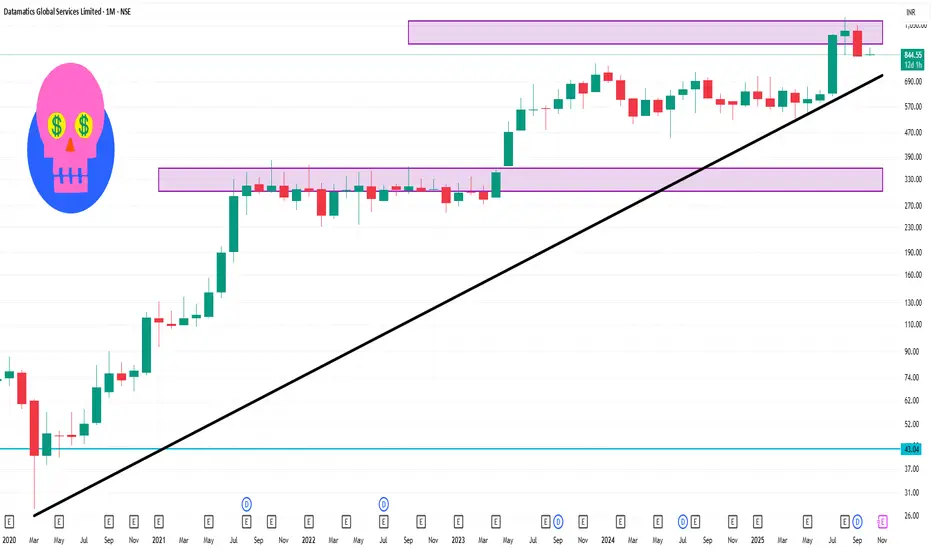
DATAMATICS 1 Month Time Frame 📉 1-Month Performance Summary
Current Price: ₹844.55
1-Month Return: Approximately -7.16% to -8.32%
52-Week Range: ₹515.05 – ₹1,120
Market Capitalization: ₹4,991 crore
P/E Ratio (TTM): 23.56
Dividend Yield: 0.59%
Beta: 1.15 (indicating moderate volatility)
📈 Longer-Term Performance
3-Month Return: Approximately +10.7% to +9.58%
1-Year Return: Approximately +41.12% to +42.79%
3-Year Return: Approximately +172.08%
5-Year Return: Approximately +1,065.7% to +1,084.5%
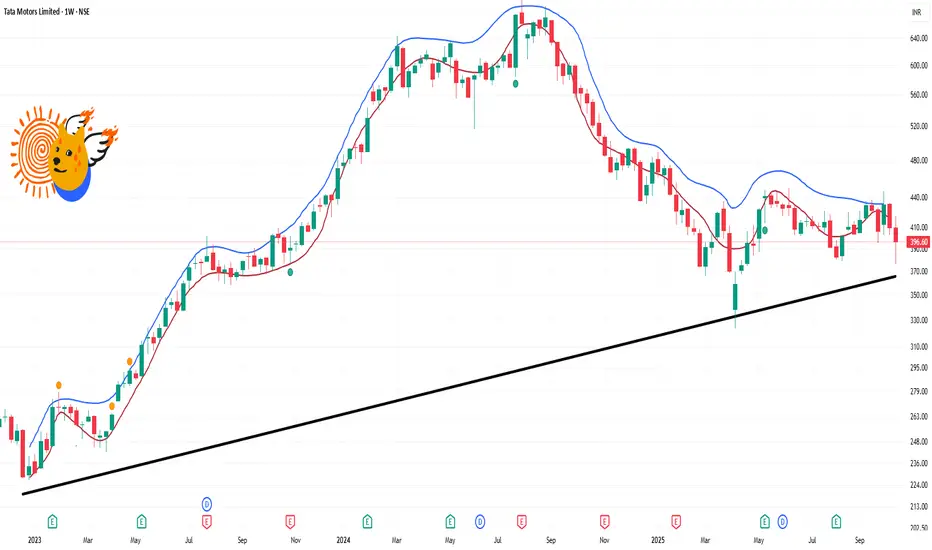
TATAMOTORS 1 Week Time Frame 📉 1-Week Price Movement
Current Price: ₹396.60
52-Week Range: ₹321.45 – ₹550.62
Recent Performance: The stock has experienced a significant decline of approximately 41.77% over the past week, largely due to the demerger of its commercial vehicle business.
📊 Technical Indicators (Weekly Overview)
Moving Averages: The stock is trading below key moving averages, indicating a bearish trend.
Relative Strength Index (RSI): The RSI is below 30, suggesting the stock is in oversold territory.
MACD: The MACD line is below the signal line, confirming a bearish momentum.
Stochastic Oscillator: The stochastic indicator is in the oversold zone, which may imply a potential reversal if buying interest returns.
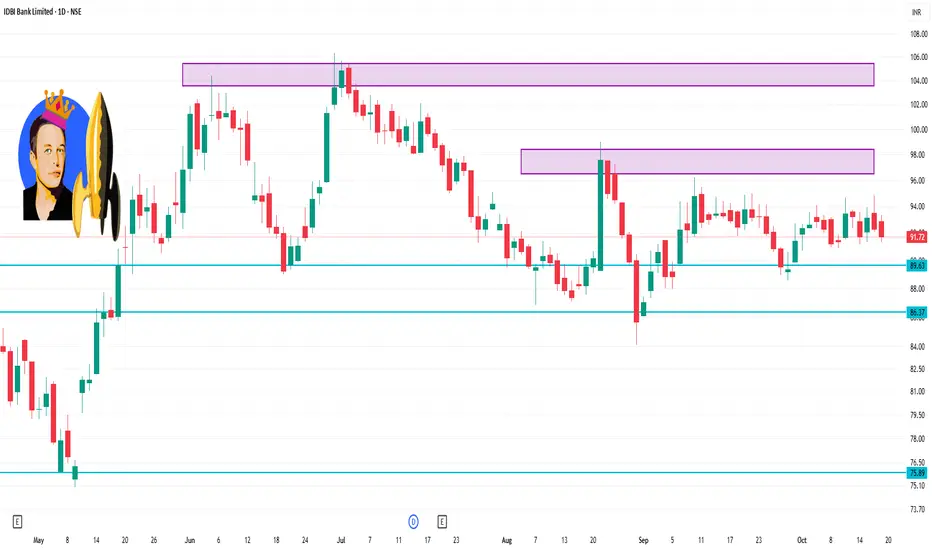
IDBI 1 Day Time Frame 📊 Daily Support & Resistance Levels
Support Levels:
S1: ₹91.43
S2: ₹90.93
S3: ₹90.14
S4: ₹88.93
Resistance Levels:
R1: ₹92.14
R2: ₹92.93
R3: ₹94.14
R4: ₹94.93
These levels are derived from standard pivot point calculations and serve as potential zones where price action may encounter support or resistance.
🔍 Current Price Action
Last Traded Price: ₹91.72 (as of October 17, 2025)
Recent Trend: The stock has been trading below the pivot point of ₹92.80, indicating a bearish short-term trend.
Key Levels to Watch:
Immediate Support: ₹91.69 (S1)
Immediate Resistance: ₹94.25 (R1)
Breakout Point: A move above ₹94.25 could signal a potential reversal to the upside.
Technical Analysis vs. Fundamental Analysis1. Introduction
Financial markets are complex ecosystems influenced by economic, political, social, and psychological factors. To navigate these markets effectively, traders and investors employ strategies that analyze price movements, market trends, company performance, and economic indicators. Technical analysis and fundamental analysis represent the two main schools of thought in this regard.
Technical analysis focuses on price and volume data to forecast future market behavior.
Fundamental analysis evaluates the intrinsic value of an asset based on economic, financial, and qualitative factors.
Both methods have unique merits and limitations. Their effectiveness often depends on the investor's time horizon, risk tolerance, and market context.
2. Understanding Technical Analysis
2.1 Definition
Technical analysis is a method of evaluating securities by analyzing statistical trends derived from trading activity, such as price movements, trading volume, and historical data. The core belief of technical analysts is that all relevant information is already reflected in the market price. Therefore, price patterns and trends provide valuable insights into future market behavior.
2.2 Key Principles of Technical Analysis
Price Discounts Everything: All known information—financial, political, or psychological—is already priced into the security.
Prices Move in Trends: Market prices rarely move randomly; they follow identifiable trends over time.
History Tends to Repeat Itself: Market psychology is relatively predictable, and historical price patterns often recur.
2.3 Tools and Techniques
Technical analysis employs various tools, including:
Charts: Line charts, bar charts, candlestick charts.
Indicators: Moving averages, Relative Strength Index (RSI), MACD (Moving Average Convergence Divergence), Bollinger Bands.
Patterns: Head and shoulders, triangles, double tops and bottoms.
Volume Analysis: Evaluates the strength of price movements through traded volumes.
2.4 Advantages
Short-term Trading: Ideal for day traders and swing traders who focus on price movements.
Quick Decision Making: Relies on real-time data, enabling rapid trading decisions.
Pattern Recognition: Helps identify entry and exit points based on historical trends.
2.5 Limitations
Ignores Intrinsic Value: Does not consider company fundamentals or economic factors.
Subjectivity: Interpretation of charts and indicators can vary among analysts.
False Signals: Market noise can generate misleading signals, leading to losses.
3. Understanding Fundamental Analysis
3.1 Definition
Fundamental analysis is a method of evaluating a security by analyzing economic indicators, financial statements, management quality, and industry conditions to determine its intrinsic value. The central premise is that a stock’s price may deviate from its true value in the short term, but it will eventually align with its fundamental worth.
3.2 Key Components
Economic Analysis: Examines macroeconomic indicators such as GDP growth, inflation, interest rates, and employment data to understand market conditions.
Industry Analysis: Evaluates sector-specific trends, competition, regulation, and growth potential.
Company Analysis: Focuses on financial health, including revenue, profits, earnings per share, debt levels, and cash flow.
Qualitative Factors: Includes management quality, brand strength, innovation, and corporate governance.
3.3 Tools and Techniques
Financial Ratios: Price-to-Earnings (P/E), Price-to-Book (P/B), Return on Equity (ROE), Debt-to-Equity ratio.
Discounted Cash Flow (DCF): Estimates the present value of expected future cash flows.
Comparative Analysis: Benchmarks a company against industry peers.
Economic Indicators: Inflation, unemployment rates, and central bank policies.
3.4 Advantages
Long-term Investment Strategy: Helps identify undervalued stocks for buy-and-hold investors.
Focus on Intrinsic Value: Reduces reliance on market sentiment and short-term fluctuations.
Comprehensive View: Evaluates both quantitative and qualitative factors.
3.5 Limitations
Time-Consuming: Requires extensive research and data analysis.
Market Timing Difficulty: Even undervalued stocks may take time to appreciate.
Limited Short-Term Usefulness: Less effective for day traders or short-term speculation.
4. Complementary Use of Both Analyses
Many investors and traders combine technical and fundamental analysis to improve their decision-making. This approach is known as a hybrid or integrated strategy.
4.1 Examples of Integration
Long-Term Investment with Tactical Timing: Fundamental analysis identifies undervalued stocks, while technical analysis determines optimal entry points.
Risk Management: Technical indicators like support and resistance levels help limit downside risk for fundamentally strong investments.
Market Sentiment Adjustment: Technical trends may provide clues about market sentiment, helping fundamental investors avoid short-term volatility.
5. Practical Applications in Different Markets
5.1 Stock Market
Technical Analysis: Used by day traders and swing traders to exploit short-term volatility.
Fundamental Analysis: Used by value investors, pension funds, and mutual funds for portfolio selection.
5.2 Forex Market
Technical analysis dominates due to the forex market’s liquidity and volatility.
Fundamental factors like interest rates and trade balances influence long-term currency trends.
5.3 Commodity Market
Technical patterns help traders predict price swings in commodities like gold, oil, and agricultural products.
Fundamental analysis considers supply-demand factors, geopolitical risks, and macroeconomic indicators.
6. Challenges in Choosing Between the Two
Investor Profile: Short-term traders may find technical analysis more relevant, while long-term investors benefit from fundamental insights.
Market Conditions: Technical analysis thrives in volatile markets; fundamental analysis is effective during stable economic conditions.
Data Availability: Access to accurate and timely financial data can influence the reliability of fundamental analysis.
Conclusion
Both technical and fundamental analysis offer valuable frameworks for making informed investment decisions. While technical analysis emphasizes price action and market trends, fundamental analysis seeks to uncover intrinsic value based on economic and financial data. The choice between the two approaches depends on investment goals, risk tolerance, time horizon, and market context.
For most successful investors, a balanced approach—leveraging fundamental analysis to select strong securities and technical analysis to optimize timing—provides a strategic advantage. Understanding the strengths and limitations of each method allows traders and investors to navigate markets more effectively, manage risks, and capitalize on opportunities.
Intraday Scalping Tips1. Understanding Intraday Scalping
Definition
Scalping is the practice of profiting from small price changes in a stock, commodity, or currency. Scalpers often aim for gains of just a few points per trade but compensate for the small size with a high volume of trades.
Characteristics of Scalping
Very short holding periods, usually minutes or seconds.
Requires liquid markets where orders can be executed quickly.
Relies heavily on technical indicators, charts, and patterns.
Emphasizes risk management because losses can accumulate quickly.
Scalping is not suitable for everyone. It demands intense focus, fast decision-making, and a temperament capable of handling frequent small losses.
2. Choosing the Right Market and Stocks
Market Selection
Scalping works best in markets that are:
Highly liquid, like major indices (Nifty 50, S&P 500) or high-volume stocks.
Have tight spreads, ensuring minimal slippage between buy and sell orders.
Experience consistent intraday volatility, providing opportunities to profit from small movements.
Stock Selection
For intraday scalping, consider:
High liquidity: Stocks that trade in large volumes are easier to enter and exit.
Low bid-ask spreads: Narrow spreads reduce trading costs.
Volatility: Moderate volatility is ideal; too little movement limits opportunities, while too much increases risk.
3. Technical Tools for Scalping
Scalpers rely heavily on technical tools rather than fundamental analysis. The most commonly used indicators include:
a) Moving Averages
Short-term moving averages (SMA, EMA) like 5-period or 15-period help identify trends and reversals.
Crossovers can signal quick entry or exit points.
b) Bollinger Bands
Measures volatility and can help scalpers spot overbought or oversold conditions.
Price touching the upper band may signal a potential sell, while the lower band may indicate a buy.
c) Relative Strength Index (RSI)
RSI helps detect momentum and potential trend reversals.
A value above 70 indicates overbought conditions, while below 30 suggests oversold conditions.
d) Volume Indicators
Volume confirms strength of a price move.
A sudden spike in volume can indicate a strong intraday trend, ideal for scalping.
4. Scalping Strategies
a) Momentum Scalping
Focuses on stocks showing strong momentum in one direction.
Scalpers enter quickly when a breakout occurs and exit when momentum weakens.
Works well with high-volume news-driven stocks.
b) Range Trading
Used when a stock is trading within a range.
Buy at support levels, sell at resistance.
Requires quick execution and constant monitoring.
c) Trend Following
Scalpers ride a short-term trend, entering on pullbacks and exiting before reversal.
Tools like moving averages and trendlines are crucial.
d) News-Based Scalping
Scalping stocks around news events like earnings announcements or economic data releases.
Requires high-speed execution and understanding of market sentiment.
5. Risk Management
Scalping is high-frequency, and small losses can add up quickly. Effective risk management is essential:
a) Stop-Loss Orders
Always set tight stop-losses, usually 0.2–0.5% of the stock price.
Avoid emotional decisions; strictly adhere to stops.
b) Position Sizing
Only risk a small portion of capital per trade (1–2% of trading capital).
Prevents a single loss from wiping out profits.
c) Avoid Overtrading
Stick to high-probability trades only.
Trading every small movement leads to losses due to slippage and fees.
6. Timing and Market Hours
Scalping is most effective during high volatility periods:
Market open (first 30–60 minutes).
Just before market close.
Avoid the midday session when markets are often quiet and range-bound.
7. Tools and Technology
Scalping demands speed and precision:
Broker with low latency execution.
Real-time charts and Level II market data.
Hotkeys for quick order execution.
Algorithmic or automated tools can help manage multiple trades efficiently.
8. Psychology of a Scalper
Patience and discipline: Wait for setups, don’t force trades.
Detachment: Avoid emotional attachment to positions.
Focus under pressure: Quick decisions without hesitation.
Learning from mistakes: Analyze trades to identify patterns of success or failure.
9. Common Mistakes to Avoid
Ignoring risk management.
Trading illiquid stocks or large spreads.
Overtrading due to impatience or boredom.
Chasing losses instead of cutting them.
Relying solely on indicators without considering price action.
10. Developing a Scalping Plan
A clear plan is essential for long-term success:
Define entry and exit rules.
Set profit targets and stop-loss levels.
Decide on maximum number of trades per day.
Record trades in a journal to refine strategy over time.
11. Conclusion
Intraday scalping can be highly rewarding but is not for the faint-hearted. Success requires a mix of technical expertise, discipline, and psychological resilience. By focusing on high-liquidity stocks, using technical tools effectively, and strictly managing risk, traders can make consistent profits in the fast-paced intraday market.
Remember: Scalping is a skill developed over time, and even small, disciplined gains can accumulate into significant profits when executed correctly.
Market Rotation Strategies1. Understanding Market Rotation
Market rotation refers to the periodic movement of capital from one sector, style, or asset class to another. It is based on the premise that financial markets are cyclical, and no single sector or investment style consistently outperforms over all market conditions. Investors or fund managers rotate capital to maximize returns by investing in sectors showing relative strength and exiting those likely to underperform.
The core drivers of market rotation include:
Economic cycles: Growth, expansion, slowdown, and recession phases influence sector performance.
Interest rates: Changes in rates affect interest-sensitive sectors like banking, utilities, and real estate.
Inflation trends: Inflationary pressures often shift capital toward commodities, energy, or inflation-hedged assets.
Investor sentiment: Market psychology drives rotation, often influenced by news, earnings, and macroeconomic indicators.
Valuation disparities: When one sector becomes overvalued relative to others, investors may rotate into undervalued sectors.
For instance, during economic expansion, cyclical sectors like technology, industrials, and consumer discretionary often outperform. Conversely, in a slowdown, defensive sectors such as healthcare, utilities, and consumer staples tend to attract more investment.
2. Types of Market Rotation Strategies
Market rotation strategies can be broadly categorized into sector rotation, style rotation, and geographical rotation. Each type targets a different aspect of market behavior.
2.1 Sector Rotation
Sector rotation is the most common type. It involves moving capital between sectors based on expected performance in the business cycle. Typical phases include:
Early expansion: Technology, consumer discretionary, and industrials tend to perform well.
Mid-cycle growth: Energy, materials, and financials may see higher returns.
Late-cycle/maturity: Utilities, consumer staples, and healthcare often outperform due to defensive characteristics.
Recession: Capital gravitates toward safe-haven sectors like utilities and healthcare, which maintain revenue despite weak economic conditions.
Example: A fund manager may reduce exposure to technology stocks during a rising interest rate phase (which hurts growth stocks) and rotate into financials or energy stocks that benefit from higher rates or inflation.
2.2 Style Rotation
Style rotation involves shifting between investment styles such as growth and value, or large-cap and small-cap stocks. Style rotation strategies are often correlated with interest rate changes, investor sentiment, and earnings trends.
Growth to value rotation: When interest rates rise, growth stocks (highly sensitive to discount rates) may underperform. Value stocks with strong fundamentals and dividends often become more attractive.
Size-based rotation: Small-cap stocks outperform during economic expansions due to higher earnings growth potential, while large-cap stocks provide stability in uncertain markets.
Example: In 2025, if inflation is high and interest rates rise, investors may rotate from speculative growth stocks to dividend-paying value stocks for stability and income.
2.3 Geographical Rotation
Geographical or regional rotation involves shifting capital across countries or regions based on macroeconomic conditions, monetary policies, and geopolitical developments.
Emerging markets: Attractive during global growth phases due to higher potential returns.
Developed markets: Preferred during global uncertainty due to stability and stronger corporate governance.
Example: Investors may rotate out of U.S. equities during economic slowdown and invest in Asian emerging markets experiencing higher growth momentum.
3. Indicators Used in Market Rotation
Successful market rotation relies on identifying sectors or assets likely to outperform. Investors often use a combination of technical, fundamental, and macroeconomic indicators.
3.1 Relative Strength Indicators
Relative strength compares the performance of one sector or stock against a benchmark index or another sector.
Sectors showing sustained relative strength are candidates for capital inflow.
Example: If the energy sector consistently outperforms the S&P 500 over three months, a rotation strategy may overweight energy stocks.
3.2 Economic Indicators
GDP growth: High growth phases favor cyclical sectors; slow growth favors defensives.
Inflation: Rising inflation benefits energy and commodity sectors, while hurting interest-sensitive sectors.
Interest rates: Higher rates favor financials, hurt growth stocks; lower rates favor growth and technology sectors.
3.3 Valuation Metrics
Price-to-earnings (P/E), price-to-book (P/B), and dividend yield comparisons help identify under- or overvalued sectors.
Investors rotate capital from overvalued to undervalued sectors to maximize returns.
3.4 Sentiment Indicators
Surveys, fund flow data, and market volatility indexes (e.g., VIX) indicate investor sentiment.
Excessive bullishness in one sector may signal an upcoming rotation to other sectors.
4. Implementation Approaches
Market rotation strategies can be implemented through active portfolio management, exchange-traded funds (ETFs), or algorithmic models.
4.1 Active Portfolio Management
Fund managers adjust sector weights dynamically based on economic forecasts, earnings reports, and valuation assessments.
Requires continuous monitoring and deep understanding of market cycles.
4.2 Exchange-Traded Funds (ETFs)
Sector ETFs allow investors to implement rotation strategies easily by buying and selling sector-specific ETFs.
Example: Rotating from technology ETF (XLK) to utilities ETF (XLU) based on macroeconomic conditions.
4.3 Quantitative and Algorithmic Rotation
Algorithms can analyze price trends, momentum, and macroeconomic data to automate rotation decisions.
Advantages: Removes emotional bias, executes faster than human managers, and identifies rotation opportunities in real-time.
Challenges: Model risk, overfitting, and sudden market shocks can impact performance.
5. Benefits of Market Rotation
Enhanced returns: Captures relative strength opportunities in outperforming sectors or styles.
Risk management: Reduces exposure to underperforming sectors, thereby lowering portfolio volatility.
Flexibility: Allows investors to adapt to changing economic conditions or market cycles.
Diversification: Rotation across sectors and regions spreads risk while improving potential returns.
Tactical advantage: Skilled investors can outperform passive index-tracking strategies during different market phases.
6. Risks and Challenges
Despite its advantages, market rotation carries inherent risks:
Timing risk: Incorrect timing of rotations can lead to underperformance.
Transaction costs: Frequent rotation increases trading fees and taxes, potentially reducing net returns.
Overreaction to signals: Excessive reliance on short-term indicators can lead to poor decisions.
Market anomalies: Unexpected geopolitical events, natural disasters, or policy changes can disrupt rotation strategies.
Sector concentration risk: Overweighting a sector based on rotation expectations can lead to significant losses if predictions fail.
7. Practical Examples of Market Rotation
Example 1: Economic Expansion Phase
Scenario: GDP growth accelerates, unemployment falls.
Rotation: Move capital into cyclical sectors such as consumer discretionary, industrials, and technology.
Rationale: These sectors benefit from rising consumer demand and business investments.
Example 2: Rising Inflation
Scenario: Inflation rises above central bank targets.
Rotation: Shift capital into energy, commodities, and real estate sectors while reducing exposure to growth stocks sensitive to interest rates.
Rationale: Commodities and real assets act as inflation hedges, preserving capital and generating returns.
Example 3: Recessionary Phase
Scenario: Economic slowdown, GDP contraction, high unemployment.
Rotation: Move capital into defensive sectors like healthcare, utilities, and consumer staples.
Rationale: Defensive sectors maintain stable revenue and dividends despite weak macroeconomic conditions.
8. Integrating Market Rotation with Portfolio Strategy
Market rotation should complement a broader investment strategy rather than operate in isolation. Key considerations include:
Strategic vs. tactical allocation: Core portfolio allocations should reflect long-term goals, while rotation strategies can adjust tactical weights based on market conditions.
Risk tolerance: Rotation intensity should align with investor risk appetite. Aggressive investors may rotate frequently, while conservative investors adopt gradual shifts.
Monitoring and evaluation: Continuous performance tracking ensures rotation decisions are validated by actual market outcomes.
Blending with other strategies: Combining rotation with dividend investing, value investing, or global diversification enhances portfolio robustness.
9. Technological Advances in Market Rotation
Modern market rotation strategies increasingly rely on technology:
AI and machine learning models: Detect patterns in historical sector performance and predict rotation opportunities.
Big data analytics: Evaluate macroeconomic, corporate, and market sentiment data in real-time.
Robo-advisors: Offer automated sector rotation strategies for retail investors with minimal manual intervention.
10. Conclusion
Market rotation strategies are a sophisticated approach to portfolio management, designed to capitalize on relative strength and sector performance shifts. By understanding economic cycles, valuation metrics, and investor sentiment, investors can systematically rotate capital to optimize returns and reduce risk.
However, successful rotation requires careful planning, disciplined execution, and ongoing monitoring. While it offers significant advantages over static buy-and-hold strategies, it also carries risks related to timing, transaction costs, and unexpected market shocks.
Ultimately, market rotation is about adapting to change, remaining nimble, and leveraging cyclical opportunities to achieve superior long-term investment outcomes. Investors who master the art and science of market rotation can navigate volatile markets more effectively and enhance portfolio resilience.

Market Swings, Interest Rates, and Inflation1. Market Swings: The Basics
Market swings are periods of significant upward or downward movement in asset prices. These movements can be gradual or abrupt, and they are influenced by multiple factors, including corporate earnings, geopolitical events, investor sentiment, and macroeconomic variables.
Volatility: Market swings are often measured by volatility indices, such as the VIX in the U.S., which reflect investor expectations of future market fluctuations.
Causes: While some market swings are triggered by company-specific news, broader swings are usually driven by macroeconomic changes, notably shifts in interest rates and inflation.
Impact on Investors: Sudden swings can create both opportunities and risks. Long-term investors may benefit from buying low during market dips, while short-term traders attempt to profit from rapid price movements.
2. Inflation: The Rising Tide of Prices
Inflation is the rate at which the general level of prices for goods and services rises, reducing the purchasing power of money. Central banks and governments monitor inflation closely, as both excessive and insufficient inflation can have adverse economic effects.
Types of Inflation:
Demand-pull inflation: Occurs when demand exceeds supply, leading to higher prices.
Cost-push inflation: Results from increased production costs, such as wages or raw materials, which businesses pass on to consumers.
Built-in inflation: Arises from adaptive expectations; as workers expect higher prices, they demand higher wages, which in turn increases costs.
Inflation and Market Swings:
Equities: Moderate inflation can be positive for stocks because companies may increase revenues as prices rise. However, high inflation erodes profit margins and can lead to market sell-offs.
Bonds: Rising inflation diminishes the real return on bonds, causing prices to fall and yields to rise.
Commodities: Typically, commodities like gold and oil perform well during inflationary periods as their prices often rise with general price levels.
3. Interest Rates: The Cost of Money
Interest rates represent the cost of borrowing money or the return for lending it. They are primarily determined by central banks through policy rates, which influence economic activity.
Role of Interest Rates in the Economy:
Monetary Policy Tool: Central banks adjust interest rates to control inflation and stabilize the economy.
Raising rates: Helps curb inflation by making borrowing expensive and reducing consumer spending.
Lowering rates: Stimulates the economy by making loans cheaper, encouraging spending and investment.
Influence on Investments:
Equities: Higher interest rates increase borrowing costs for companies, potentially reducing profits and causing stock prices to drop.
Bonds: Bond prices and yields move inversely. When rates rise, existing bond prices fall, as newer bonds offer higher yields.
Real Estate: Interest rate hikes make mortgages more expensive, often cooling housing markets.
4. The Interplay Between Inflation and Interest Rates
Interest rates and inflation are deeply intertwined. Central banks, like the Federal Reserve in the U.S. or the Reserve Bank of India, adjust interest rates primarily to manage inflation:
Rising Inflation → Higher Interest Rates: To control rising prices, central banks may increase rates to reduce money supply and borrowing.
Falling Inflation → Lower Interest Rates: To avoid deflation and stimulate growth, banks may lower rates to encourage spending.
This relationship directly impacts market swings:
Equity Markets: When interest rates rise sharply to combat inflation, stock markets may decline due to higher borrowing costs and lower consumer demand.
Bond Markets: Bonds are highly sensitive to interest rate changes. A sudden rate hike can trigger a sell-off, causing market volatility.
Currency Markets: Higher interest rates attract foreign investment, strengthening the local currency, while lower rates may weaken it, affecting imports, exports, and multinational profits.
5. How Market Swings Reflect Economic Sentiment
Market swings often act as a barometer for economic health:
Bull Markets: Characterized by rising asset prices, often occur during periods of moderate inflation and low-interest rates. Investors are optimistic about future growth.
Bear Markets: Defined by declining asset prices, often coincide with high inflation, rapid rate hikes, or economic uncertainty.
Short-Term Volatility: Day-to-day swings may result from news on inflation data releases, central bank meetings, or geopolitical tensions.
For example, if inflation data shows a sharp increase, investors may anticipate a rate hike, causing stocks and bonds to react immediately. Similarly, unexpected rate cuts during economic slowdown can trigger market rallies.
6. Real-World Examples
a) U.S. Federal Reserve and Inflation (2020–2023):
Post-pandemic, inflation surged globally due to supply chain disruptions and rising demand.
The Federal Reserve responded with a series of aggressive interest rate hikes.
Stock markets experienced high volatility, with sharp swings in technology and growth stocks particularly noticeable.
Bond markets reacted negatively, as yields rose in response to the rate hikes.
b) India’s Interest Rate Adjustments:
The Reserve Bank of India adjusts rates in response to inflation data like the Consumer Price Index (CPI) and Wholesale Price Index (WPI).
Rate hikes tend to slow economic growth and reduce market liquidity, while rate cuts can stimulate equity markets.
These moves often create swings in sectors like banking, real estate, and consumer goods.
7. Market Psychology and Inflation Expectations
Investor expectations about future inflation and interest rates play a crucial role in market swings:
Anticipatory Moves: Traders often price in expected rate hikes or inflation data before official announcements.
Behavioral Economics: Fear of rising inflation can lead to asset sell-offs, even if current inflation is moderate.
Safe Havens: During high inflation or economic uncertainty, investors flock to gold, government bonds, or stable currencies, influencing market prices.
8. Strategies to Navigate Market Swings Amid Inflation and Interest Rate Changes
Investors can adopt various approaches to mitigate risks and seize opportunities:
Diversification: Spreading investments across asset classes, sectors, and geographies reduces exposure to volatility.
Inflation-Protected Securities: Instruments like Treasury Inflation-Protected Securities (TIPS) offer protection against inflation.
Interest Rate-Sensitive Assets: Understanding which sectors benefit or suffer from rate changes can guide allocation decisions.
Active Monitoring: Regularly tracking central bank announcements, inflation reports, and macroeconomic indicators helps anticipate market swings.
Hedging: Using derivatives such as options or futures can protect portfolios against sudden market shifts.
9. Long-Term Implications
Persistent inflation or rapid interest rate changes can reshape market behavior:
Investment Patterns: Investors may shift from growth-oriented equities to dividend-paying or value stocks.
Borrowing Costs: Businesses may delay expansion due to higher loan rates, impacting stock valuations.
Global Capital Flows: Differences in interest rates across countries can lead to significant foreign investment movements, affecting currency and equity markets.
10. Conclusion
Market swings, interest rates, and inflation are deeply interconnected, forming the heartbeat of financial markets. Inflation influences purchasing power and corporate profitability, while interest rates serve as the central bank’s primary tool to maintain economic stability. Investors, traders, and policymakers must understand this interplay to navigate the uncertainty and capitalize on opportunities.
While market swings may seem unpredictable, they often reflect underlying economic realities. By analyzing interest rate trends, inflation data, and market psychology, participants can make informed decisions, balancing risk and reward in a constantly shifting financial landscape.
Ultimately, recognizing the symbiotic relationship between these elements not only helps in financial planning but also enhances comprehension of the broader economy—a vital skill in today’s complex, interconnected world.

Introduction to IPOs in IndiaIntroduction
An Initial Public Offering (IPO) represents the first sale of a company's shares to the public, allowing the firm to raise capital from a wide pool of investors. In India, IPOs are a crucial avenue for both corporate growth and investor participation. They allow private companies to transition into publicly listed entities, enhancing their credibility, visibility, and financial flexibility.
The Indian IPO market has seen substantial growth over the past few decades, driven by economic expansion, policy reforms, technological innovation, and increasing investor awareness. For investors, IPOs offer an opportunity to participate in the growth story of emerging companies. For the economy, they facilitate capital formation and resource allocation toward productive sectors.
Regulatory Framework Governing IPOs in India
The IPO process in India is strictly regulated to protect investor interests and ensure transparency. The key regulatory authorities are:
Securities and Exchange Board of India (SEBI): SEBI regulates the issuance of securities under the SEBI (Issue of Capital and Disclosure Requirements) Regulations, 2018. It ensures that companies disclose complete, accurate, and timely information about their financial health, business risks, and objectives of fund utilization.
Stock Exchanges: IPOs must be listed on recognized stock exchanges such as the National Stock Exchange (NSE) or Bombay Stock Exchange (BSE). Exchanges ensure compliance with listing requirements, including corporate governance norms.
RBI (Reserve Bank of India): While RBI is not directly involved in IPO approvals, it oversees foreign investments and ensures compliance with capital account regulations for Non-Resident Indians (NRIs) investing in IPOs.
Merchant Bankers/Lead Managers: Investment banks or merchant bankers facilitate the IPO process, from drafting the prospectus to managing investor subscriptions.
Registrar and Depositories: Registrars handle the allotment of shares, while depositories such as NSDL and CDSL maintain electronic records of shareholding.
The IPO Process in India
The IPO process in India is structured and multi-staged to ensure regulatory compliance and transparency:
1. Pre-IPO Preparation
Before going public, a company must strengthen its internal systems and governance structures. Steps include:
Corporate Restructuring: Streamlining operations, consolidating subsidiaries, and cleaning up financial statements.
Due Diligence: Legal, financial, and operational checks to ensure transparency.
Engaging Advisors: Hiring investment bankers, auditors, and legal advisors.
Board Approval: The company’s board must approve the IPO plan and submission to SEBI.
2. Filing Draft Prospectus with SEBI
The company submits a Draft Red Herring Prospectus (DRHP) to SEBI. The DRHP contains critical information including:
Business model and strategy
Financial statements and projections
Risks and uncertainties
Promoter details and shareholding pattern
Purpose of the IPO (capital utilization plans)
SEBI reviews the DRHP, suggesting modifications or clarifications to ensure investor protection. Once approved, the company can file its Red Herring Prospectus (RHP) with stock exchanges.
3. Pricing and Marketing
The company must decide the IPO pricing mechanism:
Fixed Price IPO: A predetermined price per share is set. Investors know the exact cost.
Book Building IPO: Investors bid within a price band, and the final price is determined based on demand.
During this stage, companies conduct roadshows to market their shares to institutional investors and create awareness. Institutional investors, including mutual funds and insurance companies, play a vital role in subscription and price discovery.
4. IPO Opening and Subscription
The IPO is opened for subscription to:
Retail Investors: Individuals with an investment limit under SEBI norms (usually ₹2 lakh per application).
Qualified Institutional Buyers (QIBs): Banks, mutual funds, insurance companies, and corporates.
Non-Institutional Investors (NIIs): High-net-worth individuals or entities investing above a specified limit.
Investors apply through banks, stockbrokers, or online trading platforms. In modern India, electronic IPO application (ASBA – Application Supported by Blocked Amount) is mandatory for retail and non-institutional investors to ensure a smooth and secure application process.
5. Allotment and Listing
Post-subscription, shares are allotted to investors based on demand. In case of oversubscription, shares are allotted proportionally through a lottery system. Once allotted, shares are credited to investors’ demat accounts.
Finally, shares are listed on NSE and BSE. The listing day is crucial as it sets the market benchmark for IPO performance. A successful listing often leads to a surge in share prices, commonly known as “listing gains.”
Types of IPOs in India
India has witnessed various types of IPO structures:
Initial Public Offering (IPO): Traditional method where shares are offered to the public for the first time.
Follow-on Public Offering (FPO): Additional shares issued by an already listed company.
Rights Issue: Shares offered to existing shareholders before offering to the general public.
Offer for Sale (OFS): Promoters or early investors sell their stake to the public, often seen in large-cap firms.
Book-Built IPOs vs Fixed-Price IPOs: As mentioned earlier, the pricing mechanism differs, with book-building being the more popular modern method.
Trends in the Indian IPO Market
The Indian IPO market has evolved dynamically over the last two decades. Some notable trends include:
Rising Retail Participation: With digital banking and dematerialized accounts, retail investors increasingly participate in IPOs, contributing significantly to subscriptions.
Tech and Start-up IPOs: Companies in the IT, fintech, and e-commerce sectors, such as Zomato, Paytm, and Nykaa, have created high investor excitement.
Large-Cap IPOs: Established companies continue to go public, providing investors with a blend of growth and relative safety.
Regulatory Reforms: SEBI introduced reforms like fast-track IPOs for smaller companies and enhanced disclosure requirements to boost investor confidence.
Global Investor Inflows: Foreign institutional investors (FIIs) actively participate in Indian IPOs, reflecting confidence in India’s growth story.
Advantages of IPOs in India
For companies:
Capital Raising: IPOs provide a large amount of capital without increasing debt.
Brand Visibility: Public listing enhances credibility and visibility.
Liquidity for Promoters: Founders and early investors can monetize part of their holdings.
Expansion Opportunities: Funds raised can be used for acquisitions, research, technology, and market expansion.
For investors:
High Growth Potential: Early investment in high-growth companies can yield significant returns.
Portfolio Diversification: IPOs provide access to new sectors and businesses.
Market Participation: Encourages a culture of investment and wealth creation among the general public.
Risks and Challenges
Despite the potential benefits, IPOs carry significant risks:
Market Volatility: Listing day prices can be highly volatile, influenced by demand-supply dynamics and macroeconomic factors.
Overvaluation: Hype-driven IPOs may trade below issue price post-listing if valuations are unrealistic.
Limited Information: Despite SEBI regulations, investors may not fully understand business risks.
Lock-in Period: Promoter shares often have a lock-in period, which may restrict liquidity in the short term.
Recent Developments in India’s IPO Market
The Indian IPO ecosystem is becoming more sophisticated:
Digital IPO Platforms: Integration with UPI, net banking, and trading apps has simplified subscription and payment processes.
Retail-Centric Approaches: SEBI mandates minimum 35% allocation to retail investors in most IPOs.
Emergence of Unicorn IPOs: Technology startups and fintech companies have gone public, attracting substantial attention from domestic and global investors.
ESOP Buybacks and Employee Incentives: Companies often offer shares to employees before listing, fostering employee wealth creation.
Conclusion
The IPO market in India is a vibrant component of the financial ecosystem, offering a symbiotic platform for companies to raise capital and investors to access early-stage growth opportunities. With robust regulatory oversight, digital infrastructure, and growing investor awareness, India’s IPO market continues to expand and evolve.
However, while IPOs provide opportunities for wealth creation, investors must exercise due diligence, evaluate fundamentals, and assess risks before participating. Understanding the IPO mechanism, market trends, and regulatory landscape is essential for both corporate leaders and investors to make informed decisions.
India’s IPO market not only strengthens individual companies but also contributes to overall economic growth by channeling resources efficiently, promoting transparency, and expanding capital markets. With innovation, technology-driven platforms, and increasing investor participation, India is poised to see more dynamic IPO activity in the years ahead.
Part 2 Ride The Big Moves Call and Put Options Explained
A Call Option gives the buyer the right to purchase an asset at a specific price (strike price) before or on the expiry date. Investors buy calls when they expect the asset’s price to rise. Conversely, a Put Option gives the buyer the right to sell the asset at the strike price, used when expecting a price fall. Sellers of options (writers) have obligations—call writers must sell, and put writers must buy if exercised. The interplay between call and put options allows for complex strategies, such as spreads and straddles. Understanding how both function is vital for predicting market direction and building profitable positions.

AI Analysis: The Inflation Nightmare ContinuesIntroduction
As we approach the end of 2025, the global economy remains entrenched in an inflationary crisis that shows no immediate signs of abating. From India to the United States, from emerging markets to developed nations, inflation continues to erode purchasing power, disrupt markets, and challenge policymakers. Artificial Intelligence (AI) has become an indispensable tool in analyzing this complex phenomenon, offering insights that blend data science, economics, and forecasting.
This analysis delves into the persistent inflationary trends of 2025, examining their causes, impacts, and the role of AI in understanding and addressing this economic challenge.
Understanding the Inflationary Surge
1. Global Supply Chain Disruptions
The aftermath of the COVID-19 pandemic, coupled with geopolitical tensions, has led to significant disruptions in global supply chains. These disruptions have resulted in shortages of essential goods, driving up prices. AI models have been instrumental in tracking these supply chain bottlenecks, using real-time data to predict potential shortages and price hikes.
2. Energy Prices and Commodity Inflation
The surge in energy prices, particularly oil and natural gas, has had a cascading effect on the prices of other commodities. AI-driven analytics have shown a direct correlation between energy costs and the prices of goods, as transportation and production costs rise. These insights are crucial for policymakers to understand the broader implications of energy price fluctuations.
3. Labor Market Dynamics
In many regions, labor markets have tightened, leading to wage inflation. AI tools have analyzed employment data to identify trends in wage growth and its impact on overall inflation. These analyses help in understanding the balance between wage increases and productivity gains, which is essential for assessing the sustainability of inflationary pressures.
The Role of AI in Inflation Analysis
Artificial Intelligence has revolutionized the way economists and policymakers analyze inflation. By processing vast amounts of economic data, AI can identify patterns and correlations that might be overlooked by traditional methods. Some key applications include:
Predictive Modeling: AI algorithms can forecast inflation trends by analyzing historical data and identifying leading indicators.
Sentiment Analysis: AI tools can analyze news articles, social media, and financial reports to gauge public sentiment and its potential impact on inflation expectations.
Supply Chain Optimization: AI can identify inefficiencies in supply chains, suggesting areas where improvements can be made to reduce costs and mitigate inflationary pressures.
The Impact on Consumers and Businesses
1. Erosion of Purchasing Power
Consumers are feeling the pinch as their incomes fail to keep pace with rising prices. AI-driven consumer behavior models indicate a shift towards more budget-conscious spending, with increased demand for discount retailers and private-label products.
2. Business Adaptation Strategies
Businesses are employing AI to optimize pricing strategies, manage inventory, and streamline operations to cope with inflation. Machine learning algorithms help in dynamic pricing, adjusting prices in real-time based on market conditions and competitor actions.
Policy Responses and Challenges
Governments and central banks have implemented various measures to combat inflation, including interest rate hikes and fiscal stimulus packages. However, AI analyses suggest that these measures have had limited success in the current environment due to factors such as global supply chain issues and geopolitical uncertainties.
Conclusion
The inflationary crisis of 2025 presents a multifaceted challenge that requires a nuanced understanding and a coordinated response. AI has proven to be an invaluable tool in analyzing and addressing this issue, offering insights that are critical for informed decision-making. As we move forward, the integration of AI into economic analysis will be essential in navigating the complexities of the global economy and mitigating the impacts of inflation.
High-Frequency Trading in the Indian MarketIntroduction
High-Frequency Trading (HFT) has emerged as one of the most sophisticated trading strategies in modern financial markets. It leverages advanced technology, high-speed networks, and complex algorithms to execute large volumes of trades in fractions of a second. Globally, markets such as the U.S., Europe, and Japan have witnessed a significant presence of HFT, impacting market liquidity, volatility, and trading costs. India, with its growing stock markets and increasing adoption of technology-driven trading, has also seen the rise of high-frequency trading. However, the Indian context presents unique regulatory, technological, and market-structure characteristics that distinguish it from developed markets.
What is High-Frequency Trading?
High-Frequency Trading is a type of algorithmic trading that focuses on executing trades at extremely high speeds, often measured in microseconds or milliseconds. The main characteristics of HFT include:
Speed: HFT relies on ultra-low-latency systems to execute trades faster than human traders or standard algorithmic strategies.
Algorithmic Decision-Making: Proprietary algorithms analyze market data, detect patterns, and automatically make trading decisions.
High Volume: HFT firms typically place a large number of trades with small profit margins per trade, relying on volume to generate significant returns.
Short Holding Periods: Positions are held for very brief periods, sometimes milliseconds, minimizing exposure to market risk.
Market Microstructure Exploitation: HFT strategies often exploit inefficiencies in market pricing, liquidity, and order execution.
HFT strategies can be broadly classified into the following types:
Market Making: Providing liquidity by continuously quoting buy and sell prices and profiting from the bid-ask spread.
Statistical Arbitrage: Exploiting statistical discrepancies between correlated instruments.
Event-Driven Trading: Reacting to news, earnings announcements, or macroeconomic events faster than competitors.
Latency Arbitrage: Exploiting differences in the speed of market information between exchanges.
Evolution of HFT in India
High-frequency trading in India is a relatively recent phenomenon compared to Western markets. The introduction of electronic trading in Indian stock exchanges in the late 1990s, followed by rapid adoption of technology and algorithmic trading in the 2000s, set the stage for HFT. Key milestones include:
Electronic Trading and NSE Launch (1994): The National Stock Exchange (NSE) introduced fully electronic trading, replacing open outcry systems, which facilitated faster trade execution.
Introduction of Algorithmic Trading (2008): SEBI allowed algorithmic trading with strict guidelines, enabling institutional investors and proprietary traders to implement HFT strategies.
Co-Location Services (2012): Exchanges such as NSE and BSE introduced co-location facilities, allowing HFT firms to place their servers physically close to exchange servers, reducing latency and execution time.
Growth in Market Participation: Over the last decade, HFT participation in India has grown steadily, accounting for a significant share of overall trading volumes in equities, derivatives, and currency markets.
Regulatory Framework Governing HFT in India
The Securities and Exchange Board of India (SEBI) regulates high-frequency trading to maintain market integrity, protect investors, and prevent market abuse. Key regulatory provisions include:
Algorithmic Trading Guidelines:
Traders must obtain prior approval from stock exchanges before using algorithms.
Exchanges monitor algorithms for market abuse, including manipulative strategies.
Co-Location Regulations:
Traders are allowed to place servers in proximity to exchange servers.
SEBI has mandated fair access policies, ensuring equal opportunity for all market participants.
Transparency requirements include real-time order monitoring and periodic audits.
Risk Management and Order Controls:
Exchanges require pre-trade risk checks to prevent erroneous orders.
Limits on order-to-trade ratios help control excessive messaging that can strain the market.
Market Surveillance:
SEBI employs sophisticated monitoring tools to detect potential manipulative practices like quote stuffing, layering, and spoofing.
While SEBI has created a framework for safe HFT, it remains cautious, emphasizing investor protection and market stability over unrestricted technological advancement.
Technological Infrastructure for HFT in India
High-frequency trading relies heavily on technological infrastructure, and India’s growing IT ecosystem has played a vital role. Critical components include:
Low-Latency Networks: HFT requires ultra-fast communication between trading firms and exchanges. Co-location, fiber-optic connectivity, and microwave links are used to minimize delays.
High-Performance Servers: Trading firms deploy powerful servers with advanced processors to handle massive data streams and execute algorithms rapidly.
Data Feeds: Real-time market data, order books, and news feeds are essential. Indian exchanges provide proprietary data feeds like NSE’s “NEAT” and BSE’s “BOLT” for HFT purposes.
Algorithm Development: Machine learning, statistical modeling, and predictive analytics are increasingly used to develop smarter algorithms capable of adapting to changing market conditions.
Impact of HFT on the Indian Market
The presence of high-frequency trading in India has both positive and negative implications:
Positive Impacts:
Enhanced Liquidity: HFT firms act as market makers, reducing bid-ask spreads and facilitating smoother trading for all participants.
Price Discovery: Rapid trading ensures that prices reflect new information almost instantly, improving market efficiency.
Reduced Transaction Costs: Tight bid-ask spreads and high competition among HFTs lead to lower trading costs for regular investors.
Negative Impacts:
Market Volatility: Ultra-fast trading can exacerbate price swings during periods of stress, as seen in flash crashes.
Unfair Advantage: Traders with superior technology and co-location access may dominate, creating a perception of inequality.
Potential Manipulation: Strategies like layering, spoofing, and quote stuffing can distort prices and harm genuine investors.
Despite these concerns, SEBI’s vigilant monitoring and risk management frameworks have minimized systemic risks, making India’s HFT ecosystem more controlled compared to less-regulated markets.
HFT Strategies Used in India
Some commonly observed HFT strategies in India include:
Market Making: Many HFT firms act as liquidity providers in NSE and BSE equities and derivatives markets, continuously posting bid and ask prices to profit from spreads.
Statistical Arbitrage: Arbitrage opportunities exist between futures and underlying stocks or between correlated securities. HFT algorithms detect these discrepancies and execute trades at lightning speed.
Index Arbitrage: Futures and index components sometimes have misaligned prices, which HFTs exploit for instant profits.
Latency Arbitrage: Traders exploit slight delays in price updates between exchanges or data feeds, gaining microsecond-level advantages.
Event-Based Strategies: Reactions to corporate announcements, macroeconomic data releases, or global market movements allow HFTs to anticipate price changes faster than traditional traders.
Challenges for HFT in India
Despite technological and regulatory progress, HFT faces unique challenges in India:
Infrastructure Constraints: Although exchanges offer co-location, latency can still be higher than global standards, limiting the competitiveness of Indian HFT firms internationally.
Regulatory Restrictions: Strict SEBI regulations on order-to-trade ratios, pre-trade risk checks, and algorithm approvals require continuous compliance efforts.
Market Depth: While liquidity has improved, some Indian stocks still have shallow markets, making HFT strategies less effective.
Competition from Global Players: International HFT firms entering India can outcompete domestic players due to superior technology and experience.
Ethical Concerns: HFT is often criticized for favoring speed over fundamentals, raising questions about market fairness.
Future of High-Frequency Trading in India
The future of HFT in India looks promising, driven by technological advances, increasing digital adoption, and regulatory evolution. Key trends include:
Artificial Intelligence and Machine Learning: Next-generation algorithms will leverage AI to detect patterns and adapt dynamically to market conditions.
Expansion into Derivatives and Currency Markets: As Indian derivatives and currency markets mature, HFT participation is expected to increase, offering better liquidity and efficiency.
Global Integration: Indian HFT firms may collaborate with global players, adopting international best practices while contributing to domestic market sophistication.
Regulatory Evolution: SEBI may further refine co-location and algorithmic trading norms to balance innovation with investor protection.
Technological Innovation: Investments in ultra-low-latency infrastructure, quantum computing, and advanced analytics will redefine competitiveness in HFT.
Conclusion
High-frequency trading has become an integral part of the Indian financial markets, enhancing liquidity, improving price discovery, and reducing transaction costs. At the same time, it presents challenges such as increased volatility, regulatory oversight, and ethical concerns. The Indian market, with its robust regulatory framework and growing technological infrastructure, is uniquely positioned to adopt HFT responsibly.
With continuous innovation, effective regulation, and market evolution, HFT in India is likely to grow further, playing a critical role in shaping the future of electronic trading. For investors, policymakers, and trading firms, understanding HFT is crucial, as it represents both an opportunity and a challenge in India’s rapidly modernizing capital markets.

Cross-Market ArbitrageIntroduction
In the world of finance and trading, arbitrage represents a powerful strategy for exploiting price inefficiencies across markets. Simply put, arbitrage involves buying an asset in one market at a lower price and simultaneously selling it in another market at a higher price, thereby earning a risk-free profit. Among various types of arbitrage, cross-market arbitrage is particularly significant because it leverages discrepancies in pricing between two or more markets, often in different locations, trading platforms, or financial instruments.
Cross-market arbitrage plays a critical role in ensuring market efficiency, stabilizing prices, and providing liquidity to the financial system. With globalization, the interconnectedness of markets, and the rise of electronic trading platforms, this type of arbitrage has become more prevalent, sophisticated, and competitive.
Definition of Cross-Market Arbitrage
Cross-market arbitrage can be defined as the practice of simultaneously buying and selling the same or equivalent financial instruments in different markets to profit from price differences. The key characteristics include:
Two or More Markets: Arbitrage opportunities arise when an asset is traded across multiple markets—this could be geographically separated stock exchanges, commodities exchanges, or derivatives platforms.
Price Discrepancy: The underlying principle is that the same asset may trade at slightly different prices in different markets due to differences in supply, demand, liquidity, transaction costs, or market inefficiencies.
Simultaneous Execution: To minimize risk, the arbitrage transactions are executed almost simultaneously, locking in a risk-free profit.
Example: If a share of a multinational company trades at $100 on the New York Stock Exchange (NYSE) but is available at $101 on the London Stock Exchange (LSE), a trader could theoretically buy the stock in New York and sell it in London, capturing the $1 price difference, adjusted for transaction costs and currency conversion.
Types of Cross-Market Arbitrage
Cross-market arbitrage can be classified into several types depending on the nature of the instruments and the markets involved:
Equity Cross-Market Arbitrage:
Involves stocks listed on multiple exchanges.
Example: A company listed on both the NYSE and the LSE may have temporary price differences due to market hours, liquidity differences, or currency fluctuations.
Currency Arbitrage:
Also called foreign exchange (FX) arbitrage, it involves exploiting discrepancies in currency exchange rates between markets.
Example: Triangular arbitrage in forex markets involves trading three currencies to exploit mismatches in cross-exchange rates.
Commodity Arbitrage:
Occurs in physical commodities or futures contracts traded across different exchanges.
Example: Gold trading on COMEX versus the London Metal Exchange (LME). Differences in demand, storage costs, and shipping can create arbitrage opportunities.
Derivatives Arbitrage:
Involves futures, options, or other derivatives on the same underlying asset traded in different markets.
Example: Index futures on the S&P 500 traded in Chicago versus equivalent derivatives traded offshore.
Mechanisms and Execution
The success of cross-market arbitrage depends on efficient execution and analysis. The steps typically include:
Identifying Price Discrepancies:
Traders use advanced software, real-time market data, and algorithms to detect differences in pricing across markets.
Calculating Transaction Costs:
Arbitrage profits must exceed the sum of transaction costs, including brokerage fees, taxes, currency conversion costs, and potential settlement delays.
Executing Simultaneous Trades:
Speed is critical because price discrepancies are often short-lived. High-frequency trading (HFT) systems are commonly used to perform trades within milliseconds.
Hedging Risk:
Even though arbitrage is considered "risk-free," operational, settlement, or currency risks exist. Traders may use hedging techniques to neutralize potential exposures.
Factors Influencing Cross-Market Arbitrage
Several factors determine the feasibility and profitability of cross-market arbitrage:
Market Efficiency:
In highly efficient markets, price discrepancies are minimal and short-lived, making arbitrage challenging.
Liquidity:
Markets with higher liquidity allow faster execution and larger trades, enhancing arbitrage opportunities.
Transaction Costs:
High fees, taxes, or currency conversion costs can erode profits, making some arbitrage opportunities non-viable.
Regulatory Environment:
Cross-border arbitrage may be affected by capital controls, restrictions on foreign investment, or differences in trading regulations.
Market Hours:
Differences in trading hours across global exchanges create temporary opportunities, especially when one market reacts to news before another opens.
Technological Infrastructure:
Advanced trading platforms, direct market access, and high-speed connectivity are critical to capturing fleeting arbitrage opportunities.
Examples in Practice
1. Equity Arbitrage Example:
Consider a company listed on both the NYSE and LSE. Due to market inefficiencies, its shares trade at $100 in New York and £80 in London. With a current exchange rate of $1.25/£:
London price in USD = 80 × 1.25 = $100
If due to demand fluctuations, London price rises to £82 ($102.5 USD), a trader could buy in NY at $100 and sell in London at $102.5, making a $2.5 profit per share.
2. Forex Arbitrage Example:
Triangular arbitrage occurs when three currency exchange rates are mismatched:
USD/EUR = 0.95
EUR/GBP = 0.88
USD/GBP = 0.83
A trader may convert USD to EUR, EUR to GBP, and GBP back to USD to exploit the inconsistency in exchange rates.
3. Commodity Arbitrage Example:
Gold trades at $1,900 per ounce on COMEX and €1,820 per ounce in Europe. If the USD/EUR rate is 1.05:
European price in USD = 1,820 × 1.05 = $1,911
Buying gold in COMEX at $1,900 and selling in Europe at $1,911 yields an $11 profit per ounce, minus costs.
Advantages of Cross-Market Arbitrage
Profitability:
Provides risk-free or low-risk profit opportunities by exploiting temporary inefficiencies.
Market Efficiency:
Arbitrage helps reduce price discrepancies across markets, contributing to price convergence and stability.
Liquidity Enhancement:
Arbitrageurs provide liquidity to both buying and selling markets, facilitating smoother transactions.
Diversification Opportunities:
By engaging across multiple markets and instruments, traders can diversify risk and return sources.
Challenges and Risks
Despite its theoretical risk-free nature, cross-market arbitrage involves certain challenges:
Execution Risk:
Delay in simultaneous execution can turn a profitable arbitrage into a loss.
Settlement Risk:
Especially in international markets, differences in settlement cycles may expose traders to counterparty risk.
Market Volatility:
Sudden price swings can eliminate arbitrage opportunities before trades are completed.
High Competition:
With widespread algorithmic trading, arbitrage opportunities are quickly exploited, requiring speed and technological edge.
Regulatory Constraints:
Cross-border transactions may be subject to capital controls, taxes, or trading restrictions.
Currency Risk:
For cross-border arbitrage, currency fluctuations can affect the net profit.
Technological Impact
In modern finance, technology has revolutionized cross-market arbitrage:
High-Frequency Trading (HFT):
HFT firms use complex algorithms to detect and execute arbitrage trades in microseconds.
Real-Time Market Data:
Access to live data feeds across global exchanges allows traders to react instantaneously to price discrepancies.
Automated Risk Management:
Algorithms continuously calculate transaction costs, slippage, and exposure, optimizing profitability.
Global Connectivity:
Advanced communication networks allow simultaneous trading across continents, making arbitrage more efficient.
Regulatory and Ethical Considerations
Cross-market arbitrage, while legal, must comply with regulations in each jurisdiction:
Insider Trading and Market Manipulation:
Traders must avoid using non-public information to gain an unfair advantage.
Exchange Rules:
Some exchanges restrict certain arbitrage practices or require disclosure of large trades.
Cross-Border Compliance:
International arbitrage must follow anti-money laundering (AML) laws, tax regulations, and trading restrictions.
Ethically, arbitrage contributes to market efficiency, benefiting all participants by reducing unfair price deviations.
Conclusion
Cross-market arbitrage is a cornerstone of modern trading and financial theory. By exploiting temporary price inefficiencies across markets, arbitrageurs play a critical role in ensuring market efficiency, providing liquidity, and stabilizing asset prices. While the practice offers significant opportunities for profit, it also demands speed, precision, and advanced technological infrastructure, especially in the era of high-frequency trading and globalized financial markets.
Moreover, successful arbitrage requires a deep understanding of market dynamics, transaction costs, regulatory frameworks, and risk management. As financial markets continue to evolve, cross-market arbitrage will remain a vital tool for traders, institutions, and regulators aiming to maintain efficient, fair, and liquid markets.
In a world where milliseconds can determine profit or loss, cross-market arbitrage exemplifies the interplay between strategy, technology, and market forces, highlighting both the ingenuity and challenges inherent in global finance.
Part 1 Ride The Big Moves Understanding the Concept of Options
Option trading involves financial contracts that give buyers the right, but not the obligation, to buy or sell an underlying asset—like a stock, index, or commodity—at a predetermined price within a specific period. The two main types are Call Options (buy rights) and Put Options (sell rights). Unlike owning shares directly, options let traders speculate on price movements with limited capital. The right to buy or sell comes at a cost known as the premium. Options are widely used for hedging, speculation, and income generation. Their value is influenced by factors such as volatility, time decay, and market sentiment. Understanding these dynamics helps traders manage risk and seize market opportunities efficiently.

Part 11 Trading Master ClassOptions in the Indian Market Context
In India, options trading primarily occurs on the NSE (National Stock Exchange) and BSE (Bombay Stock Exchange), with indices like Nifty and Bank Nifty being the most traded. Contracts have standardized expiry dates—usually the last Thursday of every month. SEBI regulates the derivatives market to ensure transparency and investor protection. Retail participation has surged due to increased awareness and technology-driven platforms. However, many new traders underestimate risks, leading to losses. Understanding margin requirements, taxation rules, and market psychology is essential for long-term success in the Indian derivatives landscape.

Part 12 Trading Master ClassBenefits and Risks of Option Trading
Option trading offers numerous benefits—flexibility, hedging ability, leverage, and strategic variety. Traders can profit in any market direction or even from sideways movements. Yet, risks are equally significant. Buyers risk losing the entire premium, while option sellers face unlimited potential losses if markets move sharply against them. Time decay, volatility shifts, and poor execution can quickly erode profits. Hence, knowledge, discipline, and strategy are key. Traders must use options not just for gambling but as instruments of structured risk management and profit optimization, aligning every trade with a clear plan and market understanding.

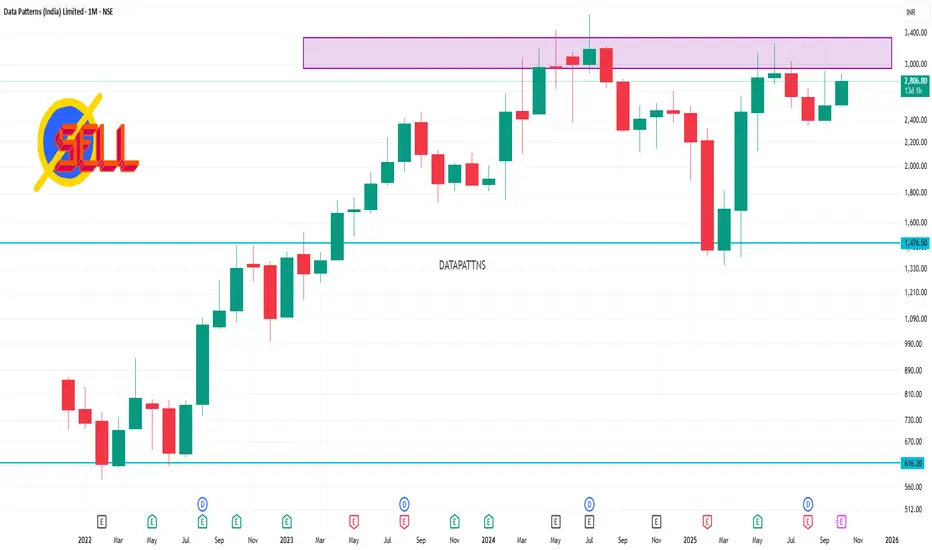
DATAPATTNS 1 Month Time Frame 📈 Current Stock Price
Price: ₹2,806.80
Day Range: ₹2,725.00 – ₹2,890.00
52-Week Range: ₹1,351.15 – ₹3,268.80
Market Cap: ₹15,714 crore
P/E Ratio (TTM): 73.2
Dividend Yield: 0.28%
ROE: 15.2%
ROCE: 21.0%
Debt-to-Equity: 0.00%
🔍 Technical Indicators (1-Month Time Frame)
RSI (14): 59.67 – Indicates neutral momentum.
MACD: 18.4 – Suggests bullish momentum.
Stochastic Oscillator: 64.93 – Indicates bullish trend.
CCI (14): 71.77 – Suggests bullish momentum.
ADX (14): 37.85 – Indicates strong trend strength.
Pivot Points (Classic):
R1: ₹2,837.36
R2: ₹2,848.03
R3: ₹2,857.16
S1: ₹2,808.43
S2: ₹2,797.76
S3: ₹2,797.76
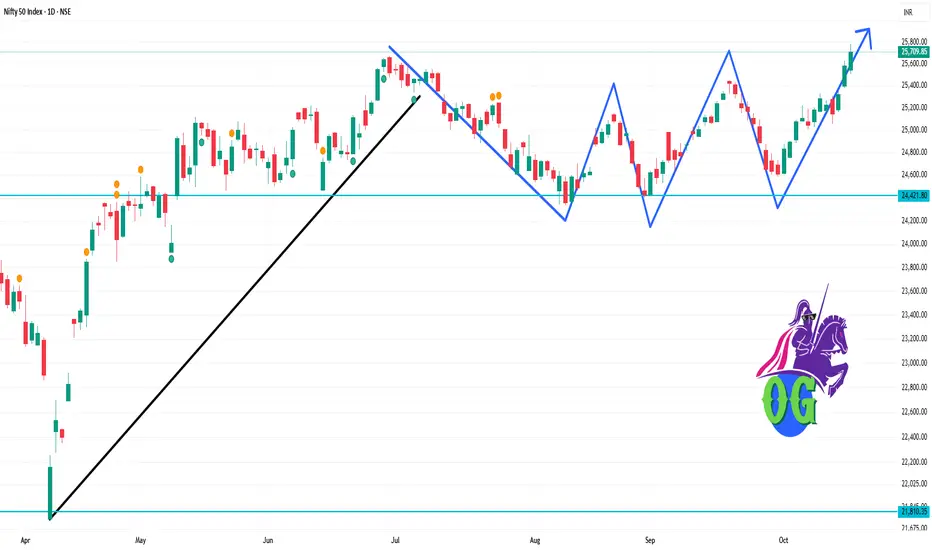
Nifty 50 1 Day Time Frame 📊 Key Technical Levels (1-Day Time Frame)
Support Levels: 25,508.60 – 25,350 INR
Resistance Levels: 25,700 – 25,781.50 INR
Pivot Level: Approximately 25,600 INR
🔍 Market Sentiment
The Nifty 50 Index is exhibiting a bullish trend, trading above the critical 25,000 INR level. However, investors should monitor for any signs of reversal or consolidation in the coming sessions.
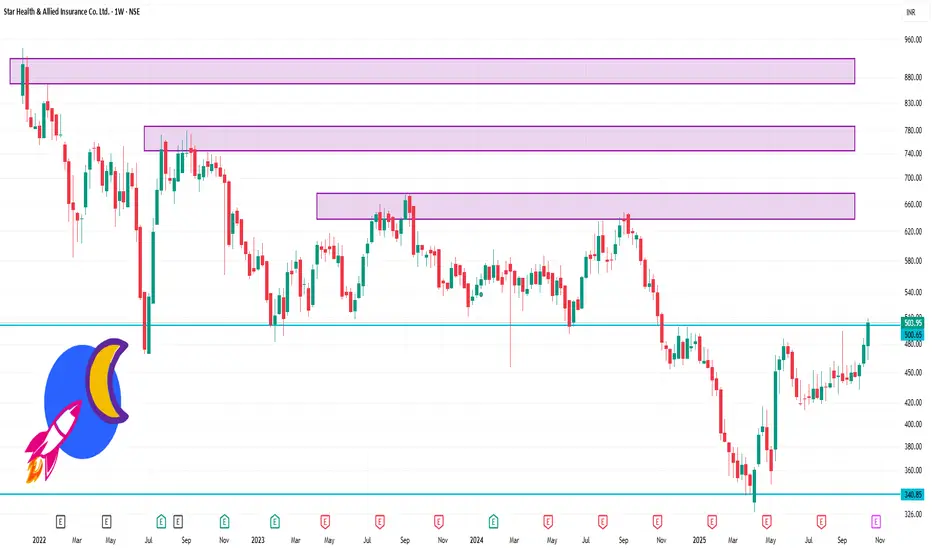
STARHEALTH 1 Week Time Frame 📈 1-Week Price Performance
Opening Price (Oct 10, 2025): ₹478.75
Closing Price (Oct 17, 2025): ₹503.95
Price Change: +₹25.20
Percentage Change: +5.26%
📊 Weekly Trading Range
Highest Price: ₹508.60 (Oct 17)
Lowest Price: ₹463.10 (Oct 14)
Average Price: Approximately ₹490.00
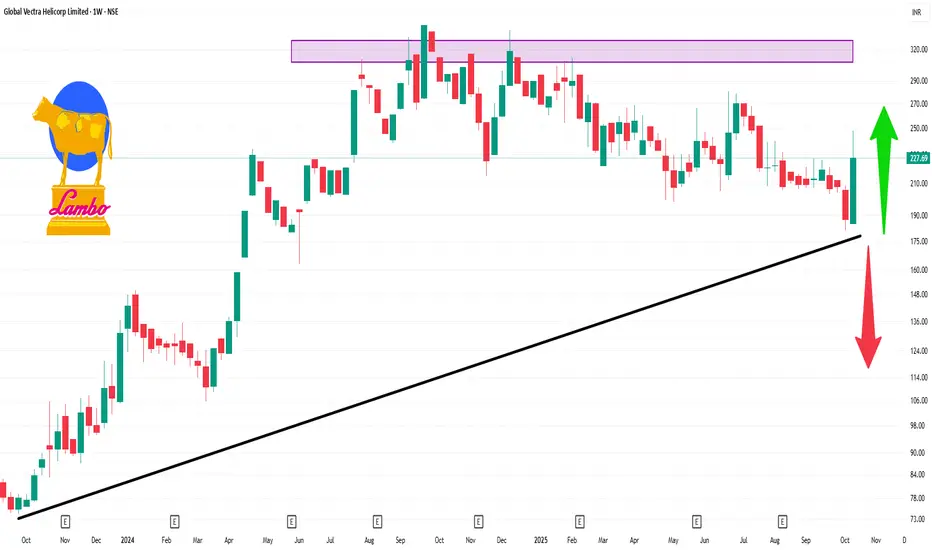
GLOBALVECT 1 Week Time Frame 📈 1-Week Price Movement
Current Price: ₹227.69 (as of October 17, 2025)
Weekly Range: ₹225.21 – ₹248.00
Weekly Change: +21.34%
🔍 Technical Indicators (Weekly Timeframe)
RSI (14): 58.97 – Indicates a neutral to slightly bullish trend.
MACD: 8.09 – Suggests bullish momentum.
Stochastic Oscillator: 46.76 – Neutral, neither overbought nor oversold.
Bollinger Bands: Upper Band: ₹262.49; Lower Band: ₹184.92; 20-day SMA: ₹223.70 – Indicates potential for further price movement within this range.
Moving Averages: Short-term averages are in an "outperform" zone, suggesting a bullish trend.
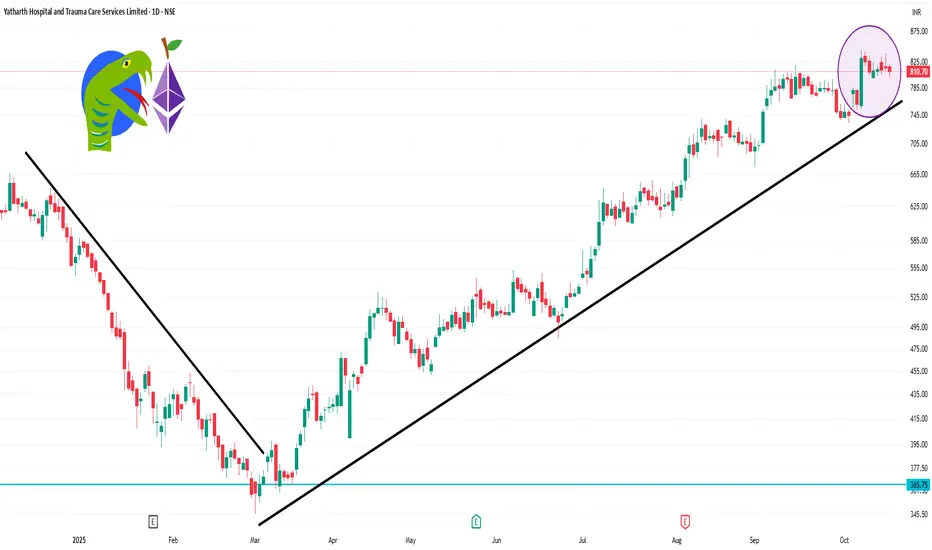
YATHARTH 1 Day Time Frame 📊 Intraday Performance (October 17, 2025)
Opening Price: ₹818.15
Day's Range: ₹802.05 – ₹821.70
Closing Price: ₹810.70
Volume: Approximately 3.32 lakh shares traded
VWAP (Volume-Weighted Average Price): ₹811.36
📈 Key Metrics
Market Capitalization: ₹7,811 crore
P/E Ratio (TTM): 54.93
EPS (TTM): ₹14.76
Book Value: ₹169.91
Dividend Yield: 0.00%
52-Week Range: ₹345.60 – ₹843.70
All-Time High: ₹839.00 (August 2025)
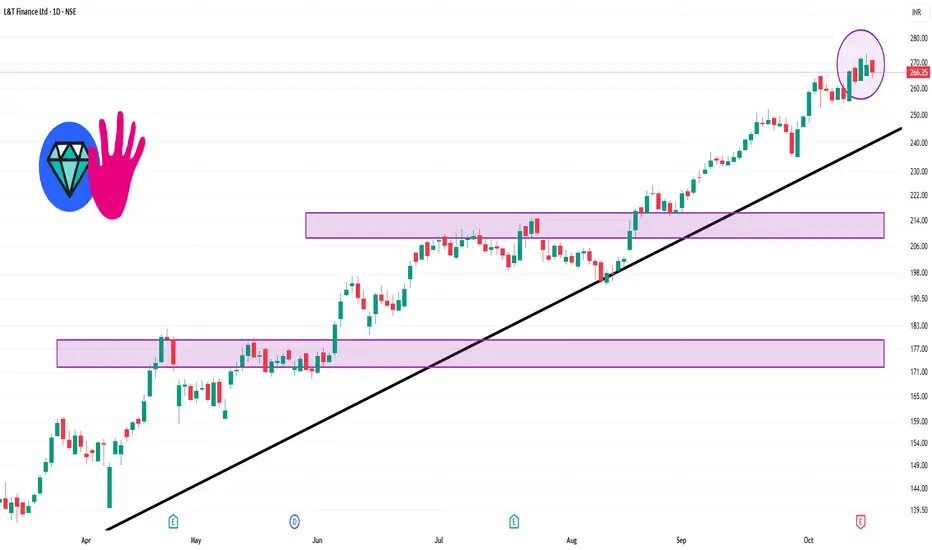
LTF 1 Day Time Frame 📊 Intraday Support and Resistance Levels
Immediate Support: ₹263.19
First Resistance: ₹270.14
Second Resistance: ₹274.02
Third Resistance: ₹277.09
These levels are derived from pivot point calculations and are commonly used by traders to identify potential entry and exit points.
📈 Technical Indicators
Relative Strength Index (RSI): 63.91, indicating that the stock is approaching overbought territory.
Money Flow Index (MFI): 78.20, suggesting strong buying interest.
MACD: The MACD line is at 9.28, with the signal line at 9.06, showing a bullish crossover.
Average True Range (ATR): ₹7.16, reflecting moderate volatility.
Average Directional Index (ADX): 38.39, indicating a strong trend.