Part 12 Trading Master Class With Experts Importance of Knowledge and Timing:
Successful option trading depends heavily on market knowledge, timing, and strategy selection. Understanding concepts like intrinsic value, time decay (theta), volatility (vega), and interest rate effects (rho) is essential. Mistimed trades or poorly chosen strategies can lead to total loss of the premium. Additionally, options are time-sensitive assets, meaning the value erodes as expiration approaches. Traders must monitor market conditions and adjust positions accordingly. While options can offer high returns, they also carry significant risk, and disciplined analysis, research, and risk management are crucial to navigate the complexity of option markets effectively.
Tradingideas

Part 11 Trading Master Class With Experts Market Participation and Flexibility:
Option trading allows investors to participate in markets with diverse strategies without directly owning the underlying assets. Traders can speculate on upward, downward, or even sideways movements of the asset, using strategies like covered calls, straddles, or iron condors. This flexibility makes options suitable for different market conditions and investor goals. Unlike stocks, options can generate income through premium collection, or be used to adjust existing positions dynamically. By choosing strike prices, expiration dates, and contract sizes, traders can customize risk-reward profiles to align with their market outlook, making options highly versatile instruments.

PCR Trading StrategiesPricing and Premiums:
The price of an option, called the premium, is influenced by several factors: the underlying asset’s price, the strike price, time until expiration, volatility, and interest rates. Options with a longer duration or higher volatility generally have higher premiums. The premium is essentially the cost of controlling the asset without owning it outright. For buyers, the premium is the maximum potential loss, while sellers (writers) collect it as income but take on potentially unlimited risk. Understanding how premiums change with market conditions is crucial for traders to time entries and exits effectively.

Part 2 Intraday TradingStrategies and Benefits:
Option trading allows a wide range of strategies, from basic buying and selling to complex combinations like spreads, straddles, and collars. Investors can protect their portfolio from adverse market moves (hedging) or profit from volatility without owning the underlying asset. Options also provide flexibility—traders can tailor risk and reward according to market expectations. While the potential for higher returns exists, understanding time decay, volatility, and strike prices is crucial. Proper knowledge and strategy help manage risk, making options a powerful tool for both conservative and speculative investors.

Part 1 Intraday Trading Definition and Mechanism:
Option trading is a financial contract that gives the buyer the right, but not the obligation, to buy or sell an underlying asset (like stocks, indices, or commodities) at a predetermined price within a specified period. There are two types: Call options (right to buy) and Put options (right to sell). Traders use options to hedge risks or speculate on price movements. Unlike direct stock trading, options allow leverage, meaning a small investment can control a larger position. However, the risk of losing the entire premium exists if the option expires worthless.

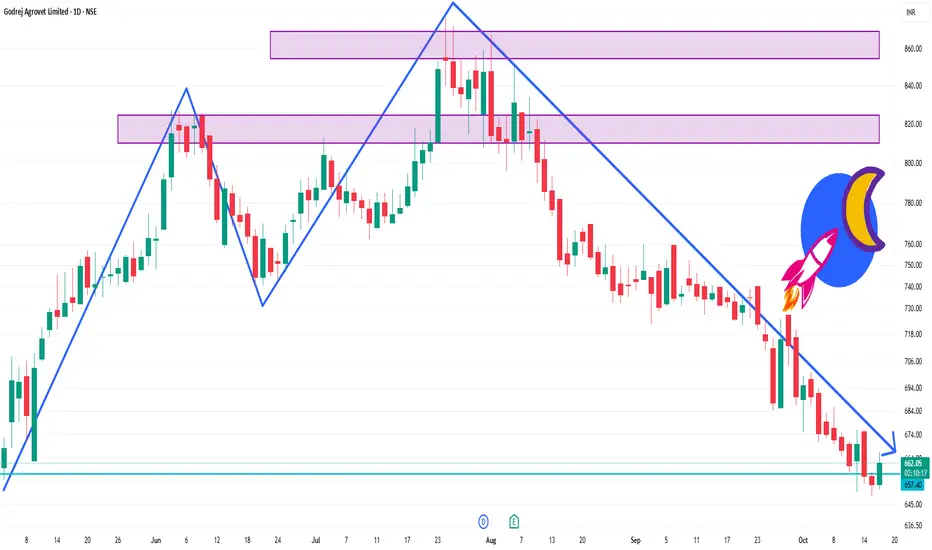
GODREJAGRO 1 Day Time Frame 📈 Intraday Support & Resistance Levels
Support Levels:
₹642.98 (S1)
₹647.97 (S2)
₹653.18 (S3)
₹637.77 (S4)
Resistance Levels:
₹658.17 (R1)
₹663.38 (R2)
₹668.37 (R3)
₹672.60 (R4)
These levels are based on standard pivot point calculations and are valid for intraday trading.
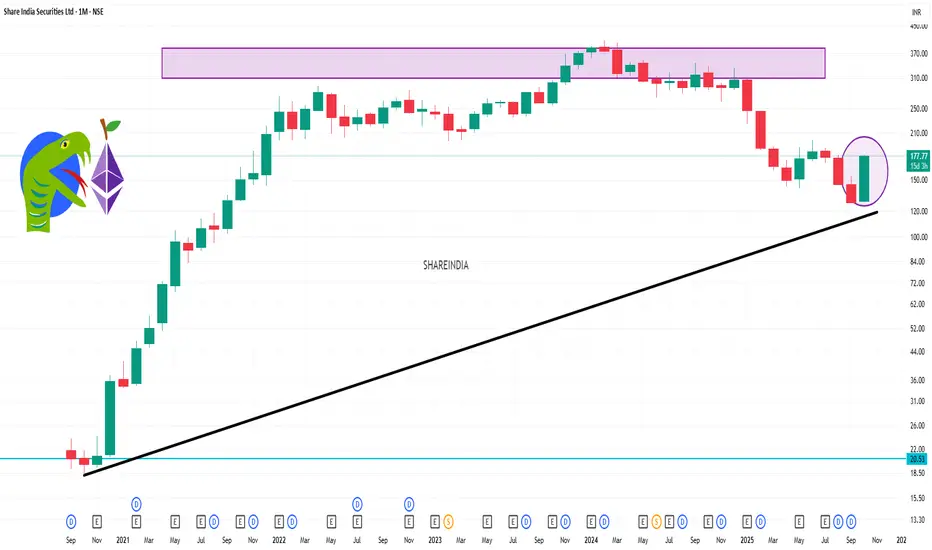
SHAREINDIA 1 Month Time frame 1-month technical outlook for Share India Securities Ltd indicates a bearish trend, with the stock trading at ₹178.65.
📉 1-Month Technical Overview
Price Change: The stock has declined by approximately 2.95% over the past month.
Technical Indicators: According to TradingView's technical analysis, the 1-month rating indicates a "sell" signal, suggesting a prevailing downtrend.
Market Sentiment: On Moneycontrol, 100% of user sentiments recommend selling, reflecting a bearish outlook among retail investors.
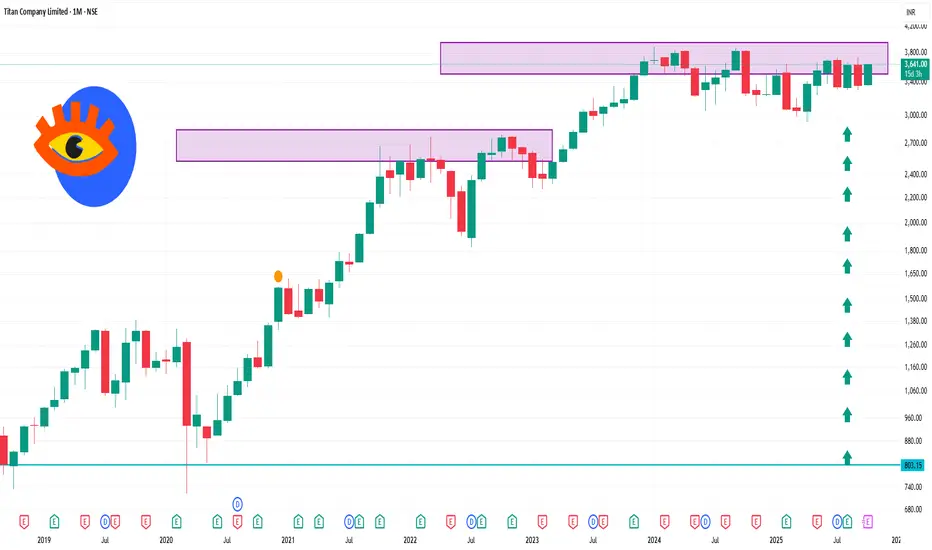
TITAN 1 Month Time Frame Titan Company Ltd is trading near ₹3,636.50, approaching its 52-week high of ₹3,740.
📊 1-Month Technical Overview
Price Performance: The stock has seen a modest decline of approximately 0.20% over the past month.
Technical Indicators:
Relative Strength Index (RSI): The RSI is currently in the neutral zone, indicating balanced buying and selling pressures.
Moving Averages: The stock is trading above its short-term moving averages, suggesting a positive short-term trend.
Stochastic Oscillator: The stochastic indicator is in the bullish zone, indicating potential upward momentum.
Commodity Channel Index (CCI): The CCI is above zero, signaling a bullish trend.
Rate of Change (ROC): The ROC is positive, further confirming bullish momentum.
Money Flow Index (MFI): The MFI is above 50, indicating healthy buying activity.
Support and Resistance Levels:
Support: ₹3,189.25
Resistance: ₹3,559.25
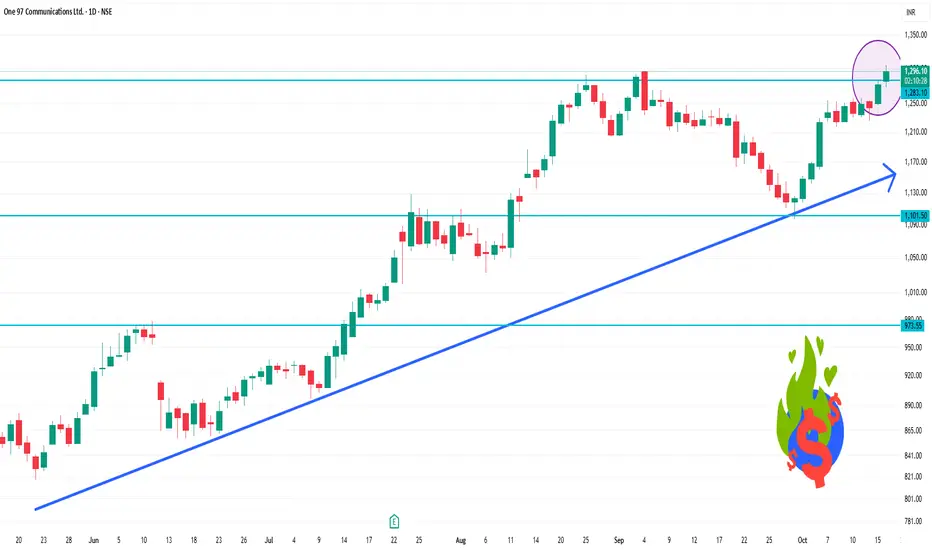
PAYTM 1 Day Time Frame 📊 Current Price Data
Last Traded Price: ₹1,301.70 (+1.91%)
Day’s Range: ₹1,273.00 – ₹1,304.90
52-Week Range: ₹651.50 – ₹1,304.90
Volume: 2,701,923 shares traded
Market Cap: ₹81,633 crore
P/E Ratio (TTM): 272.93
P/B Ratio: 5.43
Dividend Yield: 0.00%
🧠 Sentiment & Outlook
Short-Term: Neutral trend; awaiting confirmation of breakout or breakdown.
Mid-Term: Bullish; potential for upward movement if resistance levels are broken.
Long-Term: Bullish; strong support at lower levels suggests potential for sustained growth.
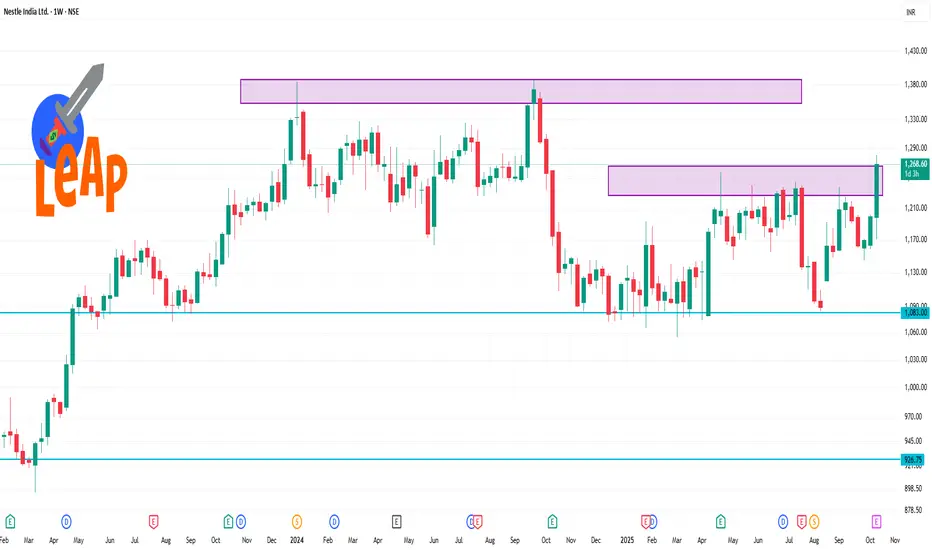
NESTLEIND 1 Week Time Frame📊 1-Week Performance Snapshot
Current Price: ₹1,264.90
1-Week Change: +6.5%
52-Week Range: ₹1,055.00 – ₹1,281.20
Day’s Range: ₹1,216.50 – ₹1,275.60
Volume: 1.61 million shares
📈 Technical Indicators
Relative Strength Index (RSI): Approximately 70.37, nearing overbought territory
Moving Average Convergence Divergence (MACD): Around +9.76, indicating bullish momentum
Support Level: ₹1,216.50 (recent low)
Resistance Level: ₹1,275.60 (recent high)
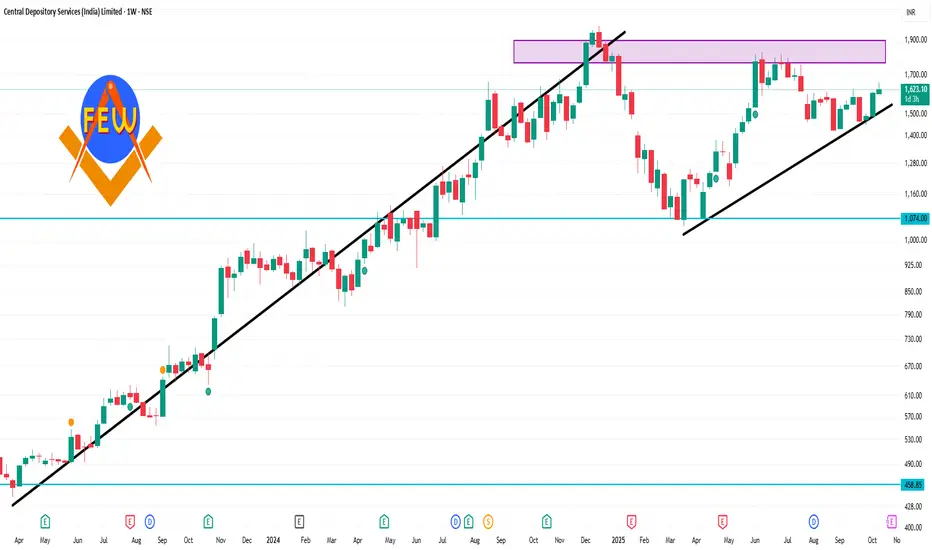
CDSL 1 Week Time Frame 📈 Current Stock Price
NSE Price: ₹1,627.00
Previous Close: ₹1,622.00
Daily Change: +0.31%
📊 Key Metrics
Market Capitalization: ₹34,010.57 crore
52-Week Range: ₹1,047.45 – ₹1,989.80
P/E Ratio (TTM): 68.51
P/B Ratio: 18.79
Dividend Yield: 0.77%
Book Value: ₹84.23
Face Value: ₹10
📅 Recent Performance
1-Week Change: +4.39%
6-Month Change: +32.04%
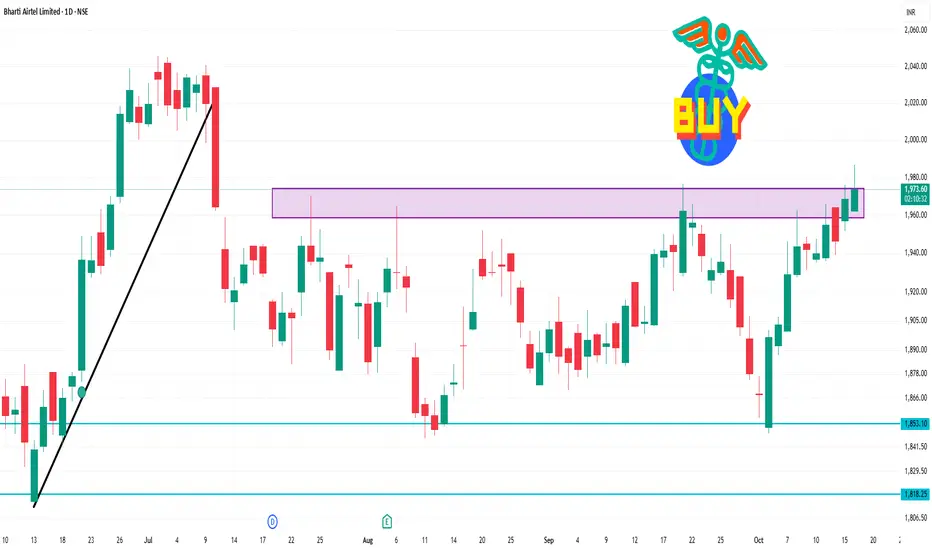
BHARTIARTL 1 Day Time Frame Bharti Airtel Limited is trading at ₹1,973.50, reflecting a 0.31% increase from the previous close.
Technical Analysis Overview (1-Day Time Frame):
Trend: Neutral to mildly bullish
Support Levels: ₹1,900 – ₹1,895
Resistance Levels: ₹1,920 – ₹1,925 and ₹1,950 – ₹1,960
Key Technical Indicators:
Moving Averages: All major moving averages (20-day, 50-day, 200-day) are bullish, indicating upward momentum.
Relative Strength Index (RSI): At 55.9, suggesting a neutral stance, neither overbought nor oversold.
Commodity Channel Index (CCI): At -214.32, indicating a bullish condition.
Momentum Oscillator: Positive, reinforcing the bullish outlook.
Average Directional Index (ADX): At 20.28, suggesting a neutral trend strength.
Part 9 Trading Master ClassOption Expiry and Settlement
Every option contract has a fixed expiry date, after which it becomes invalid. In India, for example, index options like NIFTY and BANKNIFTY expire weekly or monthly, while stock options usually have monthly expiries.
There are two types of settlements:
Cash Settlement: The difference between the strike and market price is credited or debited in cash (used in index options).
Physical Settlement: The actual delivery of stocks occurs (used in stock options in India).
Understanding expiry cycles is crucial, as price movements near expiry can become highly volatile due to time decay and traders closing positions.

Part 8 Trading Master ClassOption Greeks – The Key Metrics
Option pricing is influenced by several mathematical variables known as Option Greeks:
Delta: Measures how much the option price moves for every ₹1 change in the underlying asset.
Theta: Measures time decay — how much the option loses value daily as expiry nears.
Vega: Measures sensitivity to volatility; higher volatility increases premium.
Gamma: Tracks how much delta changes when the underlying price moves.
Rho: Measures sensitivity to interest rate changes.
Professional traders rely on these Greeks to manage risk and adjust positions according to market conditions.

Part 7 Trading Master Class Understanding Option Premium and Its Factors
The option premium is the price a trader pays to buy an option. It consists of two parts — intrinsic value and time value.
Intrinsic Value is the difference between the current price of the underlying asset and the strike price. For example, if a stock trades at ₹110 and the call strike is ₹100, the intrinsic value is ₹10.
Time Value reflects the potential for the option to gain more value before expiry. The longer the time to expiry and the higher the volatility, the greater the time value.
As expiry nears, time value decreases — a phenomenon known as time decay (theta). Understanding how premium behaves helps traders make better entry and exit decisions.

Part 6 Institutional Trading enefits and Risks of Option Trading
Benefits:
Limited risk for buyers (only the premium is at risk).
High leverage with a small capital requirement.
Can be used for hedging against stock price movements.
Risks:
Option sellers face unlimited risk if the market moves against them.
Time decay reduces option value as expiry approaches.
Requires good understanding of volatility and market trends.

Part 3 Institutional Trading How Option Trading Works
Option trading involves two participants — the buyer and the seller (writer).
A buyer pays a premium to gain the right to trade.
A seller receives the premium but must fulfill the obligation if the buyer exercises the option.
For example, if you buy a Call Option for a stock at ₹100 with a premium of ₹5, and the stock rises to ₹120, you can buy it at ₹100 and make a profit (₹15 net after premium). If the stock stays below ₹100, you simply let the option expire, losing only the ₹5 premium.

Part 2 Ride The Big Moves Key Components of Option Contracts
Every option has specific terms that determine its value and use:
Underlying Asset: The stock, index, or commodity the option is based on.
Strike Price: The pre-decided price at which the buyer can buy or sell the asset.
Premium: The price paid to purchase the option.
Expiry Date: The date when the option contract ends.
Lot Size: The number of shares per contract (e.g., 50 shares for NIFTY options).
The value of an option depends on factors such as the market price of the asset, time left to expiry, and volatility. These factors influence whether the option is in-the-money (ITM), at-the-money (ATM), or out-of-the-money (OTM).

Part 1 Ride The Big Moves What is Option Trading?
Option trading is a type of derivatives trading where the value of the contract is based on an underlying asset, such as a stock, index, or commodity. An option gives the trader the right, but not the obligation, to buy or sell the underlying asset at a fixed price (called the strike price) before or on a specific date (called the expiry date). There are two main types of options — Call Options and Put Options.
A Call Option gives the right to buy the asset.
A Put Option gives the right to sell the asset.
Traders use options for hedging risks, speculating on price movements, or earning income through premiums.

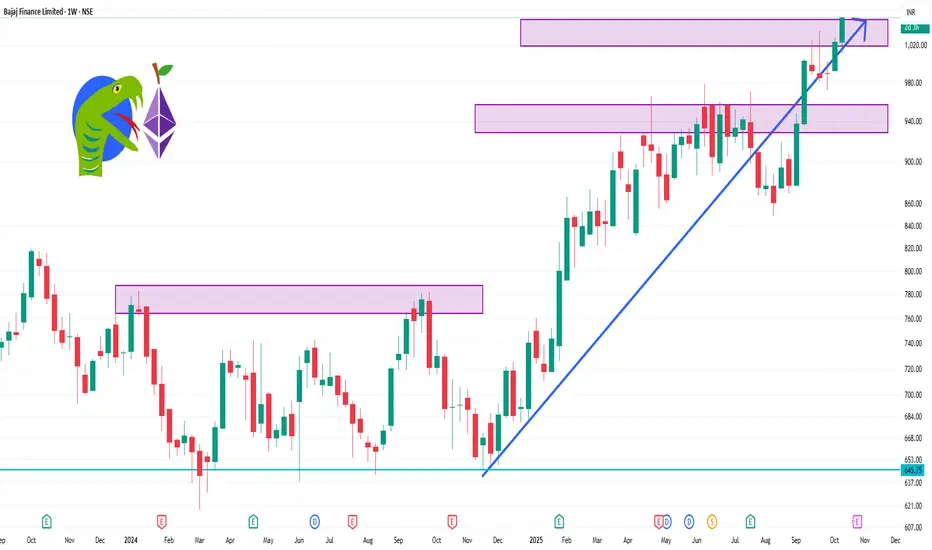
BAJFINANCE 1 Week Time Frame 📈 Weekly Technical Levels
Resistance Levels: ₹1,036.75 (short-term), ₹1,023.85 (mid-term)
Support Levels: ₹1,009.85 (short-term), ₹938 (mid-term), ₹816.86 (long-term)
These levels suggest that the stock is trading above its key support zones, indicating a potential continuation of the uptrend.
🔧 Key Technical Indicators
RSI (14): 66.57 — approaching overbought territory, but still room for upward movement.
MACD: 20.92 — indicates bullish momentum.
ADX (14): 31.50 — suggests a strong trend.
Supertrend: ₹973.61 — currently bullish.
Parabolic SAR: ₹982.79 — supports the bullish trend.
Stochastic Oscillator: 84.34 — near overbought levels, indicating potential for a pullback.
Commodity Channel Index (CCI): +131.56 — suggests the stock is overbought.
These indicators collectively point towards a strong bullish trend, though caution is advised as some indicators approach overbought conditions.
COALINDIA 1 Day Time Frame 📊 Intraday Support & Resistance Levels
Immediate Support: ₹383.05 – ₹383.35
Immediate Resistance: ₹384.03 – ₹387.12
Pivot Point: ₹384.03
📈 Technical Indicators
Relative Strength Index (RSI): Approximately 45–55, indicating a neutral to slightly bullish trend.
Moving Average Convergence Divergence (MACD): Currently showing a bearish crossover, suggesting a potential downward momentum.
50-Day Simple Moving Average (SMA): ₹385.10
200-Day SMA: ₹385.70
🔍 Market Context
The Indian stock market opened higher on Wednesday, October 15, 2025, snapping a two-day losing streak. The Sensex and Nifty tracked gains in global markets, with PSU banks and realty stocks leading the rally.

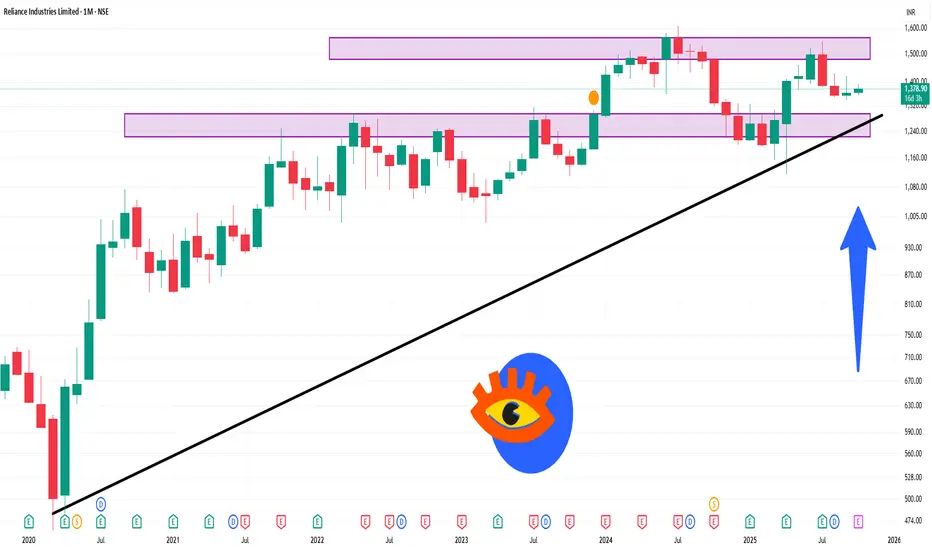
RELIANCE 1 Month Time Frame📊 Monthly Pivot Levels (October 2025)
Based on monthly pivot point analysis, key technical levels are as follows:
Pivot Point: ₹1,375.53
Resistance Levels: ₹1,410.47 (R1), ₹1,456.93 (R2), ₹1,491.87 (R3)
Support Levels: ₹1,329.07 (S1), ₹1,294.13 (S2), ₹1,247.67 (S3)
The pivot point of ₹1,375.53 indicates a neutral sentiment. Trading above this level may suggest bullish momentum, while trading below it could indicate bearish pressure.
📈 Technical Indicators Summary
RSI (14-day): Approximately 50.55, indicating a neutral market condition.
MACD: 0.190, suggesting a mild bullish trend.
Moving Averages: Neutral outlook with equal buy and sell signals across various timeframes.
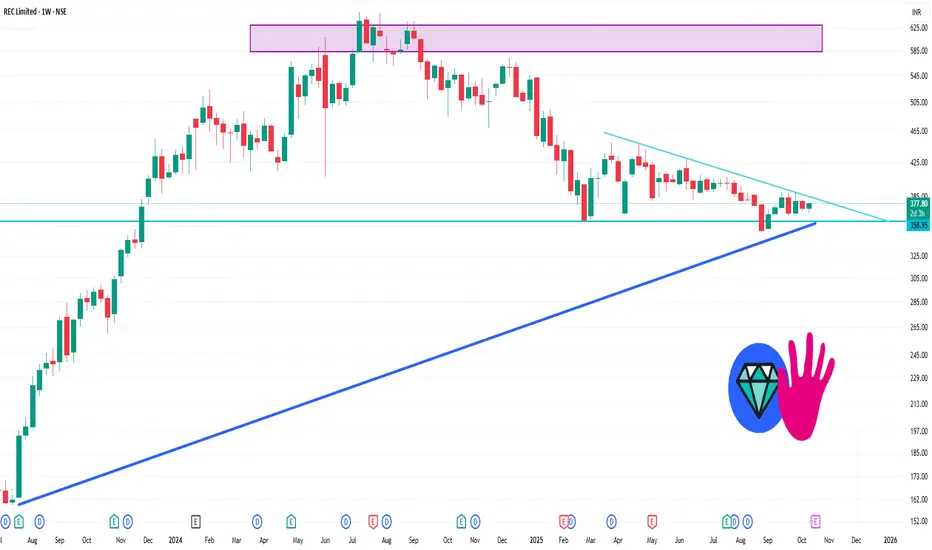
RECLTD 1 Week Time Frame 📊 Weekly Support & Resistance Levels
Immediate Support: ₹367.92
Key Support: ₹362.88
Immediate Resistance: ₹379.97
Key Resistance: ₹386.98
Weekly Trading Range: ₹355.87 – ₹392.02
🔍 Technical Indicators
RSI (14-day): 50.58 — Indicates a neutral momentum
MACD: -1.16 — Suggests a bearish trend
ADX: 15.79 — Indicates a weak trend
Stochastic RSI: 27.40 — Indicates an oversold condition
Moving Averages: Both short-term and long-term moving averages are neutral, with no clear buy or sell signals.
📈 Trend Analysis
Short-Term Trend: Neutral
Mid-Term Trend: Bearish
Long-Term Trend: Bearish
Resistance Levels: ₹386.7 (short-term), ₹391.55 (mid-term), ₹446.25 (long-term)
Support Levels: ₹364.3 (short-term), ₹350 (mid-term), ₹350 (long-term)