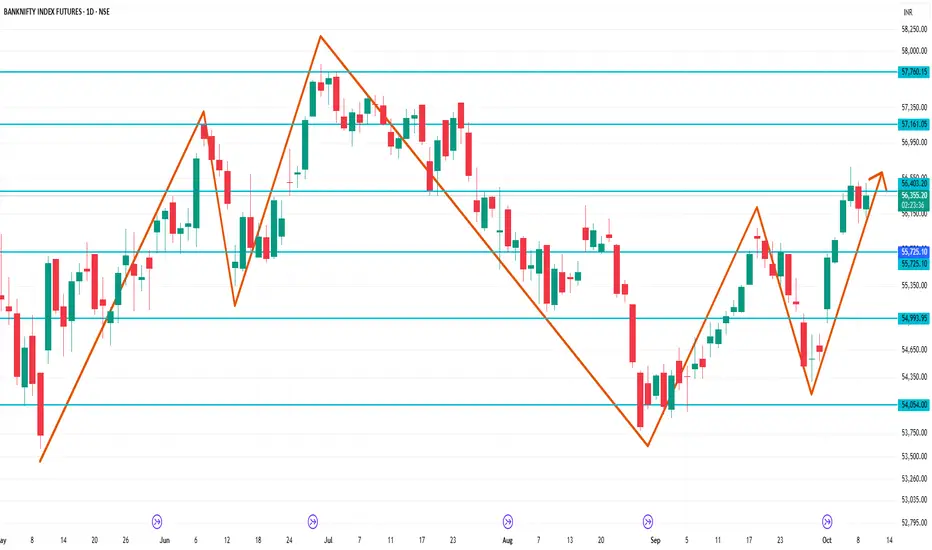
BankNifty 1 Day Time Frame 📊 1-Day Timeframe Technical Analysis
Current Price: ₹56,204.60
Day's Range: ₹55,843.90 – ₹56,286.25
52-Week Range: ₹47,702.90 – ₹57,628.40
Year-to-Date Return: +10.39%
1-Month Return: +3.56%
🔧 Technical Indicators
Trend: Neutral
Resistance Levels: ₹56,230 (immediate), ₹56,600 (stronger)
Support Levels: ₹55,843
Technical Rating: Neutral
📈 Market Outlook
The Bank Nifty Futures are currently trading within a rising wedge pattern, indicating consolidation with potential for reversal. Immediate resistance is observed around ₹56,230, which may act as a strong supply zone leading to potential selling pressure. A decisive breakout above ₹56,600 would turn the outlook bullish.
Tradingpatterns
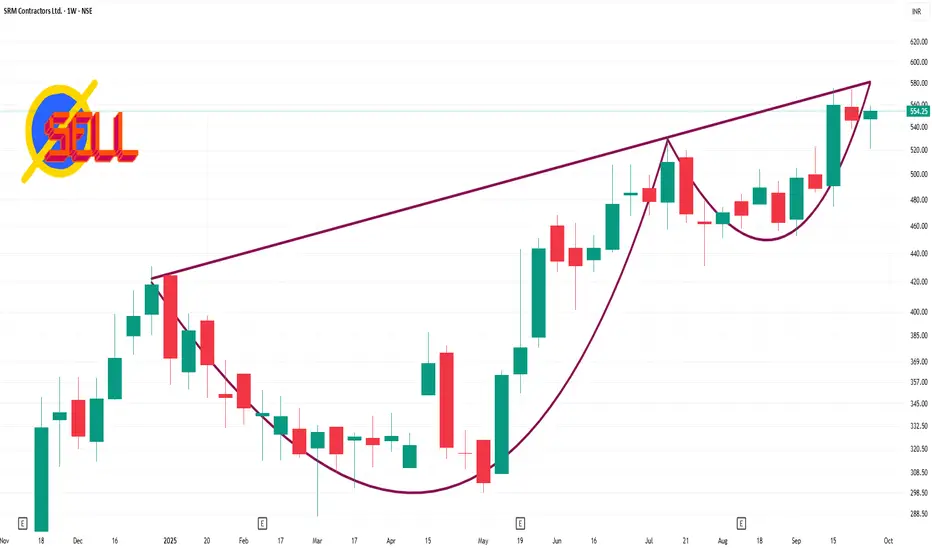
SRM 1 Week Time Frame📈 1-Week Performance
Over the past week, the stock has appreciated by 1.51%
📊 Key Metrics
52-Week High: ₹575.20
52-Week Low: ₹246.00
Market Cap: Approximately ₹1,272 crore
P/E Ratio: 19.63
P/B Ratio: 4.5
The stock is currently trading above its 50-day and 200-day Simple Moving Averages, indicating a bullish trend.
🔍 Technical Outlook
The stock's current price above both the 50-day and 200-day SMAs indicates a bullish trend. The RSI suggests that the stock is in a neutral zone, neither overbought nor oversold, which could imply room for further upside. However, investors should monitor for any signs of overbought conditions or significant resistance levels near the 52-week high of ₹575.20.
Option Chain Terms – Comprehensive Explanation1. Strike Price
The strike price (also called exercise price) is the fixed price at which the buyer of an option can buy (call option) or sell (put option) the underlying asset upon expiry.
For call options, it is the price at which the underlying asset can be purchased.
For put options, it is the price at which the underlying can be sold.
Example:
If a stock trades at ₹5,000 and the call option has a strike price of ₹5,100:
Buying the call allows you to buy the stock at ₹5,100, regardless of the market price.
Buying the put allows you to sell the stock at ₹5,100, even if the market falls to ₹4,800.
Strike prices are usually set at regular intervals, known as strike intervals, e.g., ₹50, ₹100, ₹500 depending on the underlying asset.
2. Expiry Date
The expiry date is the date on which the option contract ceases to exist. Options in India typically expire on the last Thursday of the contract month.
European-style options can only be exercised on the expiry date.
American-style options can be exercised any time before or on the expiry date.
Expiry influences option premiums:
Longer expiries usually have higher premiums due to increased time value.
Short-dated options experience faster time decay (theta).
3. Option Type (Call / Put)
Options are classified into Call Options and Put Options:
Call Option: Right to buy the underlying at the strike price. Traders buy calls when expecting price increase.
Put Option: Right to sell the underlying at the strike price. Traders buy puts when expecting price decline.
The option chain displays both call and put options for each strike price side by side for easy comparison.
4. Premium / Last Traded Price (LTP)
The premium is the price paid by the buyer to purchase the option. On an option chain, this is displayed as the Last Traded Price (LTP).
Premium consists of Intrinsic Value (IV) and Time Value (TV):
Intrinsic Value: The difference between current underlying price and strike price (only if in-the-money).
Call Option: Current Price - Strike Price (if positive)
Put Option: Strike Price - Current Price (if positive)
Time Value: Extra value due to remaining time till expiry and volatility.
Options closer to expiry have lower time value.
Premium is highly influenced by volatility, time decay, and demand-supply.
5. Open Interest (OI)
Open Interest is the total number of outstanding contracts that have not been squared off (closed) or exercised.
High OI indicates liquidity and potential support/resistance levels at that strike.
Increasing OI along with rising prices may indicate bullish sentiment; decreasing OI may indicate weak trend.
Example:
If 5,000 call option contracts at strike ₹5,000 are outstanding, it means traders have taken positions worth 5,000 contracts, reflecting market interest in that price point.
6. Volume
Volume indicates the number of contracts traded during a particular session.
High volume reflects active trading and market participation.
Comparing volume with open interest helps gauge whether new positions are being initiated or closed.
Interpretation:
Rising price + rising volume = Strong bullish trend
Falling price + rising volume = Strong bearish trend
7. Implied Volatility (IV)
Implied Volatility (IV) is the market’s expectation of future volatility of the underlying asset.
Higher IV leads to higher premiums.
Lower IV means cheaper options, reflecting market stability.
IV is crucial for traders using strategies like straddles, strangles, and spreads because these depend on expected volatility movements.
Example:
If stock X has IV of 25%, traders expect the stock price to move significantly; if IV is 10%, minimal movement is anticipated.
8. Greeks (Delta, Gamma, Theta, Vega, Rho)
Greeks quantify risk and sensitivity of option prices to various factors:
Delta (Δ) – Measures change in option price per ₹1 change in underlying.
Call Delta ranges 0–1; Put Delta ranges 0 to -1.
Gamma (Γ) – Measures rate of change of delta.
Higher gamma = option more sensitive to price changes.
Theta (Θ) – Measures time decay; negative for long options.
Vega (V) – Measures sensitivity to implied volatility.
Rho (ρ) – Measures sensitivity to interest rates.
Greeks allow traders to hedge risks and plan multi-leg strategies effectively.
9. Bid and Ask
Bid Price: Price buyers are willing to pay for an option.
Ask Price (Offer Price): Price sellers are asking.
Bid-Ask Spread: Difference between bid and ask, reflecting liquidity.
A tight spread indicates active trading, while a wide spread indicates illiquid options.
10. In-The-Money (ITM), At-The-Money (ATM), Out-Of-The-Money (OTM)
ITM: Option has intrinsic value.
Call: Strike < Underlying Price
Put: Strike > Underlying Price
ATM: Strike price ≈ Underlying Price
OTM: Option has no intrinsic value.
Call: Strike > Underlying Price
Put: Strike < Underlying Price
These classifications help traders choose options based on risk appetite and strategy (speculation vs hedging).
Conclusion
An option chain is more than just numbers; it is a market sentiment map showing where traders are positioning themselves, potential support/resistance zones, and volatility expectations. Understanding terms like strike price, premium, open interest, volume, IV, Greeks, bid/ask, and moneyness enables traders to make informed decisions, structure strategies, and manage risk effectively.
By combining quantitative data (LTP, OI, volume) with qualitative interpretation (IV, Greeks), an option chain becomes an indispensable tool for both speculative and hedging strategies in the financial markets.
PCR Trading StrategiesPart 1: Introduction to Options
Options are a type of derivative instrument that derive their value from an underlying asset like stocks, indices, commodities, or currencies. Unlike buying the asset itself, options give you the right—but not the obligation—to buy or sell the asset at a predetermined price (strike price) before or on a specific date (expiration).
Key Points:
Options are contracts between two parties: the buyer (who has the right) and the seller/writer (who has the obligation).
They are flexible instruments used for hedging, speculation, and income generation.
Options can be American style (exercisable any time before expiry) or European style (exercisable only at expiry).
Why options are popular:
Leverage: Small investment can control large positions.
Risk Management: Can hedge existing positions.
Versatility: Can profit in bullish, bearish, or sideways markets.
Part 2: Types of Options
There are two primary types of options:
1. Call Option
Gives the buyer the right to buy an underlying asset at the strike price.
Buyers of calls profit when the asset price rises above the strike price plus premium paid.
Example: If a stock is at ₹100, and you buy a call with strike ₹105 for a premium of ₹5, you make money if stock > ₹110 (105 + 5) at expiry.
2. Put Option
Gives the buyer the right to sell an underlying asset at the strike price.
Buyers of puts profit when the asset price falls below the strike price minus premium paid.
Example: If a stock is at ₹100, and you buy a put with strike ₹95 for a premium of ₹3, you profit if stock < ₹92 (95 – 3) at expiry.
Part 3: Option Terminology
Understanding the language of options is crucial:
Strike Price (Exercise Price): Price at which the option can be exercised.
Premium: Price paid to buy the option.
Expiration Date: Date on which the option expires.
In-the-Money (ITM): Call: Stock > Strike, Put: Stock < Strike.
Out-of-the-Money (OTM): Call: Stock < Strike, Put: Stock > Strike.
At-the-Money (ATM): Stock ≈ Strike Price.
Intrinsic Value: Difference between current stock price and strike price (if profitable).
Time Value: Extra value reflecting remaining time until expiry.
Note: Premium = Intrinsic Value + Time Value
Part 4: How Options Work
Option trading revolves around buying and selling contracts. Let’s break down the process:
Buying a Call:
Expectation: Stock price will rise.
Profit: Stock price > Strike + Premium.
Loss: Limited to premium paid.
Buying a Put:
Expectation: Stock price will fall.
Profit: Stock price < Strike – Premium.
Loss: Limited to premium paid.
Writing (Selling) Options:
Involves taking obligation to buy/sell if the buyer exercises.
Generates premium income but comes with unlimited risk (especially for uncovered calls).
Exercise and Assignment:
Exercising: Buyer uses the right to buy/sell.
Assignment: Seller is notified they must fulfill the contract.

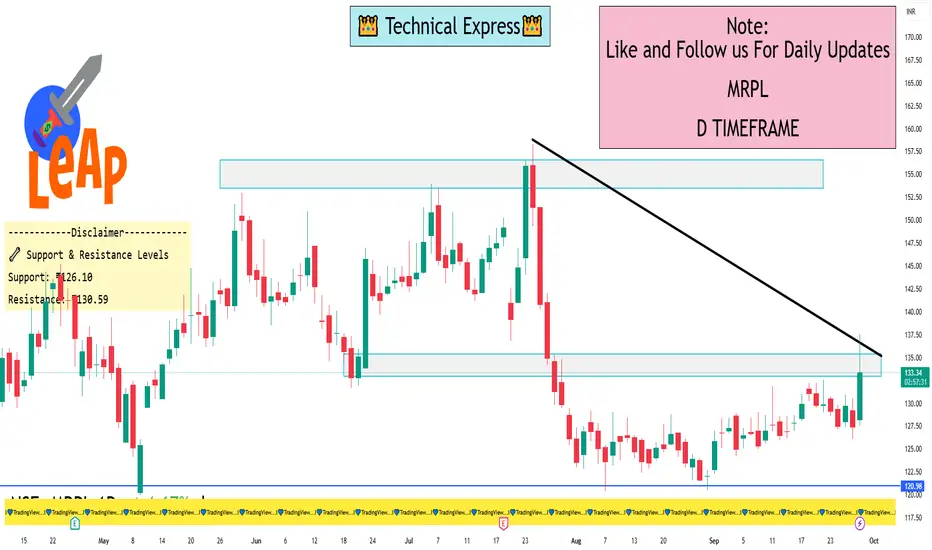
MRPL 1 Day View📊 MRPL 1-Day Technical Snapshot
Current Price: ₹133.83
Day Range: ₹127.56 – ₹137.60
Previous Close: ₹127.39
Volume: 9.3 million shares
VWAP: ₹134.30
Market Cap: ₹23,455 crore
52-Week Range: ₹98.92 – ₹186.45
All-Time High: ₹289.25
P/E Ratio: Not applicable (negative earnings)
ROE: 0.45%
📈 Technical Indicators
RSI (14-day): 44 — Neutral zone, indicating balanced buying and selling pressure.
EMA (200-day): Approximately ₹150 — The stock is trading below this long-term average, suggesting a bearish trend.
Support Levels: ₹127.50, ₹120.00
Resistance Levels: ₹137.60, ₹145.00
🔍 Chart Patterns & Sentiment
Consolidation Phase: The stock is currently in a consolidation phase between ₹127 and ₹137, forming a potential ascending triangle pattern.
Volume Analysis: Increased trading volume today indicates heightened investor interest, possibly due to upcoming earnings expectations or
Part 4 Institutional Trading1. Introduction to Option Trading
Options trading is one of the most fascinating, flexible, and powerful segments of the financial markets. Unlike traditional stock trading where investors directly buy or sell shares, options provide the right (but not the obligation) to buy or sell an underlying asset at a predetermined price within a certain time frame. This right gives traders immense flexibility to speculate, hedge risks, or generate consistent income.
At its core, option trading is about managing probabilities and timing. Stocks may only move up or down, but with options, traders can structure positions that benefit from multiple scenarios—rising prices, falling prices, or even a stagnant market. This is what makes options such a versatile tool for professional traders, institutions, and increasingly retail investors.
The roots of options trading go back centuries, even to ancient Greece where contracts were used for olive harvests. But the modern options market took off in 1973 when the Chicago Board Options Exchange (CBOE) was launched. Today, options are traded globally on exchanges like NSE (India), CBOE (US), and Eurex (Europe), covering not just equities but also indices, currencies, and commodities.
Why are options popular? Three main reasons: leverage, hedging, and strategy flexibility. Leverage allows traders to control a large position with a relatively small premium. Hedging allows investors to protect portfolios against adverse market moves. And strategy flexibility lets traders design trades that fit their market view precisely—something simple buying or selling of stocks can’t achieve.
In essence, options trading is about trading opportunities rather than assets. Instead of owning the stock itself, you trade its potential movement, giving you multiple ways to profit. But with this opportunity comes complexity and risk, which is why a deep understanding is crucial before jumping in.
2. Types of Options: Call & Put
The foundation of option trading rests on two types of contracts: Call Options and Put Options.
Call Option: Gives the buyer the right (not obligation) to buy the underlying asset at a specified price (strike price) before or on expiry. Traders buy calls when they expect the underlying to rise. Example: If Reliance stock is ₹2,500, a trader may buy a call option with a strike price of ₹2,600. If the stock rallies to ₹2,800, the call buyer profits from the difference minus the premium paid.
Put Option: Gives the buyer the right (not obligation) to sell the underlying asset at a specified strike price. Traders buy puts when they expect the underlying to fall. Example: If Nifty is at 20,000, and a trader buys a 19,800 put option, they benefit if Nifty drops to 19,000 or lower.
Both calls and puts involve buyers and sellers (writers). Buyers pay a premium and enjoy unlimited profit potential but limited loss (only the premium). Sellers, on the other hand, receive the premium upfront but carry unlimited risk depending on market moves. This dynamic creates the foundation for strategic option plays.
Another key distinction is European vs American options. European options can only be exercised on expiry, while American options can be exercised anytime before expiry. Indian index options are European style, while stock options used to be American before shifting to European for standardization.
Ultimately, every complex option strategy—iron condors, butterflies, straddles—derives from some combination of buying and selling calls and puts. Understanding these two instruments is therefore the first step in mastering option trading.
3. Key Terminologies in Options
To trade options effectively, one must master the essential language of this domain:
Strike Price: The fixed price at which the option buyer can buy (call) or sell (put) the underlying.
Premium: The cost paid by the option buyer to the seller.
Expiry Date: The date when the option contract ceases to exist. Options can be weekly, monthly, or even long-dated.
In the Money (ITM): When exercising the option is profitable. Example: Nifty at 20,200 makes a 20,000 call ITM.
Out of the Money (OTM): When exercising leads to no profit. Example: Nifty at 20,200 makes a 21,000 call OTM.
At the Money (ATM): When the underlying price is equal or very close to the strike.
Intrinsic Value: The real economic value if exercised today.
Time Value: The extra premium based on time left until expiry.
Greeks: Key risk measures (Delta, Gamma, Theta, Vega, Rho) that tell traders how option prices react to changes in market factors.
Understanding these terms is non-negotiable for any trader. For example, a beginner may get excited about buying a low-cost OTM option, but without realizing the impact of time decay (Theta), they may lose the entire premium even if the market slightly favors them. Professional traders carefully balance these variables before entering trades.
4. How Option Trading Works
An option contract is essentially a derivative, meaning its value depends on the price of an underlying asset (stock, index, commodity, currency). Every option trade involves four possible participants:
Buyer of a call
Seller (writer) of a call
Buyer of a put
Seller (writer) of a put
When an option is traded, the exchange ensures transparency, margin requirements, and settlement. Unlike stocks, most options are not exercised but are squared off (closed) before expiry.
For instance, suppose a trader buys a Nifty 20,000 call at ₹200. If Nifty rises to 20,300, the premium may shoot up to ₹400. The trader can sell the option at ₹400, booking a ₹200 profit per unit (lot size decides total profit). If Nifty remains stagnant, however, time decay will reduce the premium, causing losses.
In India, index options like Nifty and Bank Nifty weekly options dominate volumes, offering traders fast-moving opportunities. Stock options, meanwhile, are monthly and useful for longer-term strategies. Settlement is cash-based for indices, and physical delivery for stocks since 2018 (meaning if held till expiry ITM, shares are delivered).
The mechanics of margin requirements also matter. While option buyers only pay premiums upfront, option writers must keep margins since their potential losses can be unlimited. This ensures systemic safety.
Option trading, therefore, is not just about direction (up or down), but also timing and volatility. A stock can move in the expected direction, but if it does so too late or with too little volatility, an option trade can still fail. This is what makes it intellectually challenging but rewarding for disciplined traders.

Key Trading Terminology Every Pro Should Know1. Market Basics
1.1 Asset Classes
Understanding asset classes is fundamental. These include:
Equities/Stocks: Ownership shares in a company.
Bonds: Debt instruments representing a loan made by an investor to a borrower.
Commodities: Physical goods like gold, oil, and wheat traded on exchanges.
Forex: Currency pairs traded in the global foreign exchange market.
Derivatives: Financial instruments whose value derives from an underlying asset, including options and futures.
1.2 Market Participants
Key players in markets include:
Retail Traders: Individual investors trading with personal capital.
Institutional Traders: Organizations such as mutual funds, hedge funds, and banks.
Market Makers: Entities that provide liquidity by quoting buy and sell prices.
Brokers: Intermediaries facilitating trading for clients.
HFT Firms: High-frequency traders using algorithms for rapid trades.
1.3 Market Orders
Orders are instructions to buy or sell an asset:
Market Order: Executed immediately at the current market price.
Limit Order: Executed only at a specified price or better.
Stop Order: Becomes a market order once a specific price is reached.
Stop-Limit Order: Combines stop and limit orders for precise execution.
2. Trading Styles and Strategies
2.1 Day Trading
Buying and selling within the same trading day to capitalize on intraday price movements.
2.2 Swing Trading
Holding positions for several days to weeks to profit from medium-term price swings.
2.3 Position Trading
Longer-term trades based on trends over weeks or months.
2.4 Scalping
Ultra-short-term trading, often seconds to minutes, targeting small profits.
2.5 Algorithmic Trading
Using automated programs to execute trades based on predefined strategies.
3. Technical Analysis Terminology
3.1 Candlestick Patterns
Visual representations of price movements:
Doji: Indicates market indecision.
Hammer: Potential bullish reversal signal.
Shooting Star: Possible bearish reversal.
3.2 Support and Resistance
Support: Price level where buying pressure prevents further decline.
Resistance: Price level where selling pressure prevents further rise.
3.3 Trend and Trendlines
Uptrend: Series of higher highs and higher lows.
Downtrend: Series of lower highs and lower lows.
Trendline: Straight line connecting significant price points to identify direction.
3.4 Indicators and Oscillators
Moving Averages: Smooth price data to identify trends (SMA, EMA).
RSI (Relative Strength Index): Measures overbought or oversold conditions.
MACD (Moving Average Convergence Divergence): Trend-following momentum indicator.
Bollinger Bands: Volatility-based price envelopes.
4. Fundamental Analysis Terminology
4.1 Key Financial Ratios
P/E Ratio: Price-to-earnings ratio indicating valuation.
P/B Ratio: Price-to-book ratio reflecting company worth relative to book value.
ROE (Return on Equity): Profitability relative to shareholder equity.
Debt-to-Equity Ratio: Financial leverage indicator.
4.2 Earnings and Revenue
EPS (Earnings Per Share): Profit allocated per outstanding share.
Revenue Growth: Increase in sales over time.
Profit Margin: Percentage of revenue converted to profit.
4.3 Macroeconomic Indicators
GDP Growth: Economic expansion rate.
Inflation (CPI/WPI): Changes in price levels.
Interest Rates: Cost of borrowing money.
5. Risk Management Terminology
5.1 Position Sizing
Determining the size of each trade relative to portfolio capital.
5.2 Stop Loss and Take Profit
Stop Loss: Limits losses if the market moves against you.
Take Profit: Automatically closes a trade when a target profit is reached.
5.3 Risk-to-Reward Ratio
Ratio of potential loss to potential gain; crucial for evaluating trade viability.
5.4 Diversification
Spreading investments across multiple assets to reduce risk exposure.
6. Derivatives and Options Terminology
6.1 Futures
Contracts to buy/sell an asset at a predetermined price and date.
6.2 Options
Contracts giving the right but not obligation to buy (call) or sell (put) an asset.
6.3 Greeks
Measure sensitivity to various factors:
Delta: Price change relative to underlying asset.
Gamma: Rate of change of delta.
Theta: Time decay of option value.
Vega: Sensitivity to volatility changes.
6.4 Leverage
Using borrowed funds to amplify trading exposure; increases potential gains and losses.
7. Market Conditions and Events
7.1 Bull and Bear Markets
Bull Market: Rising prices and investor optimism.
Bear Market: Falling prices and investor pessimism.
7.2 Volatility
Degree of price fluctuations; often measured by VIX for equities.
7.3 Liquidity
Ability to buy/sell assets quickly without affecting price significantly.
7.4 Gap
Difference between closing and opening prices across trading sessions.
7.5 Market Sentiment
Overall attitude of investors toward a market or asset.
8. Order Types and Execution Terms
Fill: Execution of an order.
Partial Fill: Only part of the order is executed.
Slippage: Difference between expected price and execution price.
Spread: Difference between bid and ask prices.
Bid/Ask: Highest price buyers are willing to pay vs lowest sellers accept.
9. Advanced Trading Terminology
9.1 Arbitrage
Exploiting price differences between markets to earn risk-free profits.
9.2 Hedging
Using instruments to offset potential losses in another investment.
9.3 Short Selling
Selling borrowed shares anticipating a price decline to buy back at lower prices.
9.4 Margin
Borrowed funds to increase position size.
9.5 Carry Trade
Borrowing at a low interest rate to invest in higher-yielding assets.
9.6 Position vs Exposure
Position: Current holdings in an asset.
Exposure: Potential risk from current positions.
10. Psychological and Behavioral Terms
FOMO (Fear of Missing Out): Emotional bias leading to impulsive trades.
Fear and Greed Index: Measures market sentiment extremes.
Overtrading: Excessive trades driven by emotions rather than strategy.
Confirmation Bias: Seeking information that supports pre-existing views.
Loss Aversion: Tendency to fear losses more than value gains.
11. Key Metrics and Reporting Terms
Volume: Number of shares/contracts traded.
Open Interest: Total outstanding derivative contracts.
Volatility Index (VIX): Market’s expectation of future volatility.
Market Capitalization: Total value of a company’s shares.
Index: Measurement of market performance (e.g., Nifty 50, S&P 500).
12. Global Market Terms
ADR/GDR: Instruments for trading foreign shares in domestic markets.
Forex Pairs: Currency combinations like EUR/USD or USD/JPY.
Emerging Markets: Developing economies with growth potential but higher risk.
Commodities Exchange: Platforms like MCX, NYMEX for commodity trading.
13. Regulatory and Compliance Terms
SEBI/NSE/BSE Regulations: Regulatory frameworks governing trading in India.
FATCA/AML: Compliance rules for taxation and anti-money laundering.
Circuit Breaker: Market mechanism to halt trading during extreme volatility.
14. Conclusion: Why Terminology Matters
Mastering trading terminology is crucial for professional success. Knowledge of terms enhances decision-making, improves risk management, and fosters confidence when interpreting market conditions. Professional traders are not just skilled in execution—they understand the language of the market. From basic orders to complex derivatives, every term is a tool to decode price movements, optimize strategy, and ultimately, achieve consistent profitability.
Intraday Scalping Tips: A Comprehensive Guide for Traders1. Understanding Intraday Scalping
Intraday scalping is a high-frequency trading strategy where traders aim to exploit minor price movements in highly liquid stocks, indices, or commodities. Scalpers typically hold positions for a few seconds to a few minutes, rarely longer than an hour, focusing on micro-trends.
Key Characteristics of Scalping:
Frequency: Multiple trades per day, often 20-50 or more.
Profit per trade: Small, usually 0.1% to 0.5% of the asset price.
Timeframe: Very short, typically 1-minute, 5-minute, or tick charts.
Tools: Technical indicators, Level 2 data, order books, and high-speed trading platforms.
Scalping is favored by traders who thrive on fast decision-making and have the discipline to follow strict risk management rules.
2. Choosing the Right Market and Instruments
Not all markets are suitable for scalping. The ideal instruments share characteristics like liquidity, volatility, and tight bid-ask spreads.
A. Liquidity
Highly liquid instruments allow traders to enter and exit positions quickly without significant slippage. Examples include:
Stocks: Large-cap equities such as Apple, Microsoft, or Reliance Industries.
Indices: Nifty 50, S&P 500, or Dow Jones futures.
Forex pairs: EUR/USD, GBP/USD, USD/JPY.
Commodities: Gold, crude oil futures.
B. Volatility
Scalpers thrive on small price fluctuations. Moderate volatility ensures there are enough trading opportunities without excessive risk. Instruments with too low volatility may not provide sufficient profit potential, while highly volatile ones can lead to rapid losses.
C. Spreads
Tighter bid-ask spreads reduce trading costs. Scalpers often trade instruments with minimal spreads to maximize net gains.
3. Technical Analysis for Scalping
Technical analysis is the backbone of scalping. Traders rely on charts, indicators, and patterns to make rapid decisions.
A. Timeframes
Scalpers primarily use:
1-Minute Charts: Ideal for ultra-short-term trades.
5-Minute Charts: Better for slightly larger moves and trend confirmation.
Tick Charts: Track each transaction for highly active markets.
B. Indicators
Common indicators for scalping include:
Moving Averages (MA):
Use short-term MAs (5, 10, 20 periods) to identify micro-trends.
Crossovers signal potential entry/exit points.
Relative Strength Index (RSI):
Helps spot overbought or oversold conditions.
RSI above 70 indicates overbought, below 30 indicates oversold.
Bollinger Bands:
Show volatility and potential reversal zones.
Price touching the upper or lower band may indicate a short-term reversal.
Volume Analysis:
Confirms the strength of price movements.
Increasing volume with price momentum strengthens trade signals.
C. Price Action Patterns
Scalpers also rely on candlestick patterns:
Pin Bars: Indicate quick reversals.
Doji: Signal market indecision.
Engulfing Patterns: Show strong directional shifts.
4. Scalping Strategies
A. Momentum Scalping
Momentum scalping involves entering trades in the direction of strong price movements. Traders look for:
Breakouts from consolidation zones.
High volume spikes confirming the trend.
Fast execution to ride the momentum.
Example: A stock breaking above a resistance level with heavy volume may provide a 1-2% intraday profit if timed correctly.
B. Range Trading
Some instruments trade within a defined price range during the day. Scalpers can:
Buy at support and sell at resistance.
Use tight stop-losses to minimize risk.
Confirm trades with oscillators like RSI or Stochastic.
C. News-Based Scalping
Economic reports, corporate announcements, or geopolitical news can trigger rapid price movements. Scalpers exploit this by:
Monitoring economic calendars.
Reacting quickly to breaking news.
Using platforms with low latency execution.
Caution: News-based scalping is high-risk due to unpredictable price swings.
D. Spread Scalping
This strategy is common in Forex or highly liquid markets:
Traders exploit tiny differences in bid-ask spreads.
Requires sophisticated software or a broker offering minimal latency.
5. Risk Management in Scalping
Effective risk management is non-negotiable in scalping. High trade frequency increases exposure, making small losses potentially catastrophic.
A. Position Sizing
Use small position sizes relative to your total capital.
Limit risk to 0.5%-1% per trade.
B. Stop-Loss and Take-Profit
Set tight stop-losses to avoid large losses.
Use risk-reward ratios around 1:1 or 1:1.5 due to the small profit target per trade.
C. Avoid Overtrading
Stick to your strategy, even if tempted to chase small gains.
Overtrading can erode profits and increase emotional stress.
D. Monitor Transaction Costs
Frequent trades mean higher brokerage and fees.
Opt for brokers with low commissions and tight spreads.
6. Common Mistakes to Avoid
Overleveraging: Increases risk of large losses.
Ignoring Transaction Costs: High fees can nullify gains.
Chasing the Market: Jumping into trades without setup leads to losses.
Neglecting Stop-Losses: Can transform small losses into significant drawdowns.
Emotional Trading: Fear and greed are the biggest enemies of scalpers.
Conclusion
Intraday scalping is a high-speed, high-discipline trading strategy that can yield consistent profits if executed correctly. The key to success lies in:
Choosing the right instruments.
Mastering technical analysis and chart patterns.
Implementing strict risk management.
Maintaining emotional control and mental focus.
Leveraging technology to improve speed and efficiency.
Scalping is not for everyone. It requires patience, precision, and resilience. However, for traders willing to invest time in learning and practicing, it can be a highly rewarding strategy in the world of financial markets.
Part 9 Trading Master ClassHow Options Work in Practice
Option buyers have limited risk (premium paid) but unlimited profit potential (in calls if stock rises, in puts if stock falls).
Option sellers have limited profit (premium received) but potentially unlimited risk.
This asymmetric payoff structure creates a market where traders, hedgers, and institutions interact.
Key Concepts
Intrinsic Value: Real profit if exercised immediately.
Time Value: Premium paid for potential future movement.
In-the-Money (ITM): Option already profitable if exercised.
Out-of-the-Money (OTM): Option has no intrinsic value, only time value.
At-the-Money (ATM): Strike = current market price.
Why Traders Use Options
Hedging – Protect portfolio against price swings.
Speculation – Bet on future price movements with smaller capital.
Income Generation – Sell options and earn premiums.
Arbitrage – Exploit mispricing between spot and derivatives.
Options Pricing Models
Two main models:
Black-Scholes Model: Uses volatility, strike, expiry, and interest rates to price options.
Binomial Model: Breaks time into steps, considering probability of price moves.
Factors affecting option prices:
Spot price of underlying
Strike price
Time to expiry
Volatility
Interest rates
Dividends

Part 2 Ride The Big MovesBasic Option Strategies
For Beginners
Long Call – Buy call, profit if price rises.
Long Put – Buy put, profit if price falls.
Covered Call – Own stock and sell call, earn premium.
Protective Put – Own stock and buy put to protect against downside.
Intermediate Strategies
Straddle – Buy call + put at same strike, profit from volatility.
Strangle – Buy OTM call + put, cheaper than straddle.
Bull Call Spread – Buy lower strike call, sell higher strike call.
Bear Put Spread – Buy higher strike put, sell lower strike put.
Advanced Strategies
Iron Condor, Butterfly Spread, Calendar Spread – mainly for experienced traders looking for defined risk/reward.
Advantages of Option Trading
Leverage: Small investment controls large position.
Hedging: Protect stock portfolios.
Flexibility: Profit in rising, falling, or sideways markets.
Limited Loss: Buyers lose only the premium paid.
Risks in Option Trading
Premium Loss: 100% loss if option expires worthless.
Time Decay: OTM options lose value fast near expiry.
Complexity: Advanced strategies require precise planning.
Unlimited Risk: Selling naked calls can be disastrous.

Institutional Trading Strategies1. Understanding Institutional Trading
Institutional trading refers to trading executed by large organizations, which can move millions or billions of dollars in assets. Unlike retail traders, institutions face unique challenges:
Liquidity impact: Large trades can move markets significantly.
Market timing: Buying or selling at the wrong time can trigger price slippage.
Regulatory considerations: Compliance with SEC or SEBI regulations, insider trading rules, and disclosure requirements.
Information asymmetry: Institutions often have access to research and proprietary data unavailable to retail traders.
Because of these factors, institutions adopt strategies designed to minimize risk and market impact while maximizing returns.
2. Core Institutional Trading Strategies
A. Algorithmic & Quantitative Strategies
Institutions often use advanced algorithms to automate trading and exploit tiny inefficiencies.
VWAP (Volume Weighted Average Price)
Objective: Buy or sell close to the day’s average price.
Mechanics: Break large orders into smaller chunks executed over time.
Benefit: Minimizes market impact and slippage.
TWAP (Time Weighted Average Price)
Objective: Spread trades evenly over a set time.
Ideal for: Illiquid stocks or executing predictable, steady flows.
Liquidity-Seeking Algorithms
Scan multiple venues for the best prices.
Avoids pushing prices against themselves when trading large volumes.
Statistical Arbitrage
Exploits small price discrepancies between correlated securities.
Typically high-frequency, requires strong computing power.
B. Execution-Based Strategies
Focus on how to enter and exit positions efficiently without alerting the market.
Iceberg Orders
Only a small portion of the total order is visible.
Reduces market reaction while enabling execution of large trades.
Dark Pool Trading
Off-exchange venues where large trades can happen anonymously.
Reduces market impact but may have slightly less favorable pricing.
Block Trades
Very large trades negotiated privately.
Often used for institutional rebalancing, mergers, or index adjustments.
C. Directional / Market Bias Strategies
These involve taking a view on price direction but with institutional tools.
Momentum Trading
Buy assets trending up, sell assets trending down.
Often combined with quant signals to detect strong, persistent moves.
Mean Reversion
Exploit temporary price swings away from average value.
Requires sophisticated risk management for stop-losses.
Pairs Trading
Go long on one stock and short a correlated one.
Goal: Profit from relative moves while minimizing market exposure.
D. Fundamental & Event-Driven Strategies
Institutions often trade based on macro, company-specific, or event-driven catalysts.
Merger Arbitrage
Buy target stock and sell acquirer’s stock in announced mergers.
Profits from narrowing spread between deal price and market price.
Earnings Plays
Long/short positions around earnings announcements.
Often uses options for asymmetric risk-reward.
Macro Strategies
Trade based on interest rates, currency movements, commodities, or geopolitical events.
Hedge funds excel here, often using derivatives to leverage insights.
E. Index and ETF Strategies
Institutions moving large money often track or hedge index exposure.
Index Arbitrage
Exploit differences between index futures and underlying stocks.
Requires precise timing and low-latency systems.
ETF Creation/Redemption
Institutions can create or redeem ETF shares to capitalize on pricing inefficiencies.
Minimizes market exposure while arbitraging between ETF price and underlying assets.
F. Portfolio Rebalancing
Large institutions must rebalance periodically:
Quarterly/annual adjustments to match benchmarks.
Use program trading to spread trades over multiple sessions.
Incorporate risk management rules to avoid unwanted exposure.
3. Risk Management in Institutional Trading
Institutions manage risk carefully because a single trade can move millions in losses:
Position Sizing: Limit exposure per trade relative to portfolio.
Stop-Loss & Hedging: Use options, futures, or inverse ETFs.
Diversification: Across sectors, geographies, and instruments.
Liquidity Risk Control: Avoid positions that can’t be exited quickly.
4. Advantages of Institutional Trading
Access to capital for bulk trades.
Information edge through research teams.
Reduced transaction costs via negotiated fees and algorithmic efficiency.
Ability to influence market structure for advantageous execution.
5. Key Challenges
Slippage and Market Impact: Large trades can shift prices.
Regulatory Scrutiny: Must comply with reporting and trading rules.
Technology Dependency: Relies heavily on algorithms and low-latency infrastructure.
Competition: Other institutions using similar strategies can reduce alpha.
6. Examples of Institutional Trading in Practice
Mutual Funds:
Execute index rebalancing using VWAP/TWAP algorithms.
Hedge Funds:
Exploit statistical arbitrage, pairs trading, and macro events.
Investment Banks:
Facilitate block trades and ETF arbitrage for clients.
Pension Funds:
Focus on long-term rebalancing and risk-controlled investments.
In summary: Institutional trading is about strategically moving large amounts of capital while controlling risk, minimizing market impact, and exploiting both structural and event-driven opportunities. Their success lies in technology, research, execution discipline, and risk management rather than guessing market direction.
Inflation Nightmare ContinuesHistorical Background of Inflation Crises
To understand why current inflation feels like a nightmare, it is important to examine historical episodes where inflation destroyed economies and societies:
Weimar Germany (1920s) – After World War I, Germany printed money to pay reparations and fund government expenses. Prices doubled every few days, bread became unaffordable, and savings were wiped out. This hyperinflation destroyed the middle class and sowed political instability, eventually contributing to the rise of extremism.
Latin America (1980s–90s) – Countries like Argentina, Brazil, and Peru faced chronic inflation and hyperinflation due to poor fiscal discipline, currency devaluations, and external debt crises. Entire generations learned to spend salaries within hours of being paid, knowing that prices would rise dramatically by the next day.
Zimbabwe (2000s) – Perhaps one of the most extreme cases of hyperinflation, Zimbabwe experienced annual inflation in the billions of percent. Currency became worthless, and barter trade replaced the monetary system.
Global Stagflation (1970s) – Triggered by oil shocks and loose monetary policy, the developed world faced both high inflation and high unemployment. It was a nightmare scenario for policymakers, since raising interest rates to curb inflation also deepened unemployment, while stimulating growth further fueled inflation.
These examples highlight a crucial point: inflation is not simply about rising prices; it is about the breakdown of trust in money itself. Once the population loses confidence that their currency holds value, the entire economic and social order comes under threat.
Causes of the Current Inflation Nightmare
The ongoing global inflation wave is different from past episodes in its complexity. It is not caused by a single factor, but rather a convergence of multiple structural issues:
1. Post-Pandemic Demand Surge
When COVID-19 restrictions were lifted, pent-up demand for goods, travel, housing, and entertainment surged. Households that had saved during lockdowns spent aggressively. The sudden imbalance between strong demand and limited supply triggered price spikes.
2. Supply Chain Disruptions
Even though demand came back quickly, global supply chains took years to recover. Shipping costs skyrocketed, raw material shortages became common, and semiconductor shortages crippled industries from automobiles to electronics.
3. Energy Price Shocks
Geopolitical tensions, including the Russia–Ukraine war, severely disrupted oil and natural gas supplies. Europe in particular faced skyrocketing energy bills, which filtered into the cost of everything from heating to fertilizer.
4. Food Inflation
Climate change events such as droughts, floods, and heatwaves reduced agricultural productivity. Coupled with disrupted fertilizer supply chains, global food prices surged, creating a humanitarian as well as an economic crisis.
5. Loose Monetary Policy Legacy
For over a decade, central banks in the U.S., Europe, Japan, and other advanced economies pursued ultra-low interest rates and quantitative easing to stimulate growth. This cheap money created asset bubbles and an expectation of endless liquidity. When inflation surged, central banks had to pivot sharply, but the lag effect meant prices had already spiraled.
6. Labor Market Shifts
In many countries, post-pandemic labor shortages emerged due to early retirements, changes in work preferences, or immigration restrictions. Employers raised wages to attract workers, fueling wage-price spirals.
7. Geopolitical Fragmentation
The shift toward deglobalization, reshoring, and protectionism has added to costs. When supply chains are localized for security reasons, they often become less efficient and more expensive, driving structural inflation.
How Inflation Impacts Households
For ordinary families, inflation is not an abstract economic term—it is felt in daily struggles.
Erosion of Purchasing Power: Salaries often do not keep pace with rising prices, meaning households can afford less with the same income. Groceries, fuel, school fees, and healthcare eat up larger portions of budgets.
Savings Destruction: Fixed deposits and bank savings accounts yield little compared to inflation. A 6% annual return is meaningless when inflation is 8%. This pushes households into riskier investments.
Housing Stress: Rising interest rates make mortgages costlier. Rent also rises as landlords pass on higher costs.
Psychological Toll: The constant stress of managing finances in an inflationary environment reduces consumer confidence and long-term planning. Families delay weddings, education, and retirement investments.
Impact on Businesses
Rising Input Costs: Raw materials, energy, and transportation become more expensive, squeezing margins.
Unstable Pricing: Companies face difficulties in setting long-term contracts when costs are volatile.
Debt Burden: Higher interest rates increase borrowing costs, particularly painful for small businesses.
Investment Delays: Businesses often delay expansion projects due to uncertain demand and financing conditions.
Wage Pressures: To retain talent, companies must raise wages, further driving costs upward.
This environment often results in a vicious cycle where businesses either pass on costs to consumers, fueling further inflation, or cut back on production, worsening economic stagnation.
Policy Dilemmas
Central banks and governments face a unique challenge: how to curb inflation without destroying growth.
Central Bank Tightening – Raising interest rates helps reduce demand, but also risks triggering recessions.
Fiscal Policy – Governments can subsidize food, fuel, or housing, but that adds to fiscal deficits and sometimes worsens inflation.
Supply-Side Reforms – Long-term solutions like improving infrastructure, energy independence, or agricultural productivity take time.
Communication Crisis – Policymakers struggle to maintain credibility. If the public believes central banks cannot control inflation, expectations of rising prices become self-fulfilling.
This is the nightmare scenario: monetary tools are blunt, fiscal tools are politically constrained, and structural reforms are slow.
Global Perspective
United States: Persistent wage inflation, strong consumer demand, and housing shortages make it difficult for the Federal Reserve to achieve its 2% inflation target.
Europe: Energy dependence and fragmented fiscal policies complicate the European Central Bank’s task.
Emerging Markets: Countries like India and Brazil face imported inflation through higher oil and food prices. Weaker currencies exacerbate the problem.
Developing Nations: Many African and South Asian countries face “stagflation” – high inflation with weak growth, often worsened by debt crises.
Social and Political Fallout
Inflation is not just an economic issue; it destabilizes societies:
Rising Inequality: Wealthier households with assets like real estate or equities can hedge against inflation, while the poor, who spend most income on essentials, suffer disproportionately.
Erosion of Trust in Institutions: When inflation persists, people lose faith in central banks, governments, and financial systems.
Political Populism: Inflation often fuels populist movements promising subsidies, wage increases, or price controls—measures that may worsen long-term stability.
Unrest and Protests: History shows that food and fuel inflation often sparks protests, riots, and even revolutions.
The Nightmare if Inflation Persists
If the inflation nightmare continues unchecked, the world could face:
Currency Crises in weaker economies.
Debt Defaults by heavily indebted nations unable to finance rising borrowing costs.
Global Recession triggered by aggressive rate hikes.
Social Instability as unemployment and inequality rise.
Shift in Global Power – countries that manage inflation better may emerge as new economic leaders, while others fall behind.
Possible Pathways Out
While the nightmare seems relentless, there are strategies to stabilize the situation:
Technology and Productivity Growth: Innovation can reduce costs, offsetting inflationary pressures.
Energy Transition: Moving toward renewable energy reduces vulnerability to oil and gas shocks.
Global Cooperation: Trade agreements and supply chain resilience can bring stability.
Credible Monetary Policy: Central banks must maintain independence and act decisively to anchor expectations.
Targeted Fiscal Support: Protecting vulnerable households while maintaining overall fiscal discipline.
Conclusion
Inflation is more than rising prices—it is an erosion of stability, trust, and prosperity. When it becomes entrenched, it threatens not just economies but the very fabric of societies. Today’s inflationary pressures are unique in their complexity, fueled by supply shocks, geopolitical tensions, and structural economic changes. The nightmare continues because solutions are neither simple nor immediate.
Yet, history also shows that inflationary crises can be overcome with credible policies, innovation, and resilience. The real challenge lies in balancing short-term sacrifices with long-term stability. If policymakers and societies fail to rise to this challenge, the inflation nightmare will not just continue—it may define the economic future of an entire generation.
Derivatives & Hedging Strategies1. Understanding Derivatives
1.1 Definition
A derivative is a financial contract whose value is derived from the performance of an underlying asset, index, interest rate, or event.
The underlying could be:
Equities (stocks, indices)
Commodities (oil, gold, wheat)
Currencies (USD, EUR, INR, etc.)
Interest rates (LIBOR, SOFR, government bond yields)
Credit events (default risk of a borrower)
The derivative itself has no independent value—it gains or loses value depending on the changes in the underlying.
1.2 History of Derivatives
Derivatives are not new. Ancient civilizations used forward contracts for trade. For example:
Mesopotamia (2000 BC): Farmers and traders agreed on grain delivery at future dates.
Japan (17th century): The Dojima Rice Exchange traded rice futures.
Chicago Board of Trade (1848): Standardized futures contracts began.
Modern derivatives markets exploded in the late 20th century with the development of financial futures, options, and swaps, especially after the collapse of the Bretton Woods system in the 1970s, which led to currency and interest rate volatility.
1.3 Types of Derivatives
Forwards
Customized contracts between two parties.
Agreement to buy/sell an asset at a fixed price in the future.
Traded over-the-counter (OTC), not standardized.
Futures
Standardized forward contracts traded on exchanges.
Require margin and daily settlement (mark-to-market).
Highly liquid and regulated.
Options
Provide the right, but not obligation to buy (call) or sell (put) the underlying at a specific price.
Buyer pays a premium.
Offer asymmetry: limited downside, unlimited upside.
Swaps
Agreements to exchange cash flows.
Examples:
Interest Rate Swaps (IRS): Fixed vs floating rate.
Currency Swaps: Principal and interest in different currencies.
Commodity Swaps: Exchange of fixed for floating commodity prices.
Exotic Derivatives
More complex structures like barrier options, credit default swaps (CDS), weather derivatives, etc.
1.4 Why Derivatives Matter
Risk management (hedging): Protect against adverse price movements.
Price discovery: Futures and options reflect market expectations.
Liquidity & efficiency: Provide easier entry and exit in markets.
Speculation & arbitrage: Opportunities for traders to profit.
2. Risks in Financial Markets
Before moving to hedging strategies, it’s important to understand the risks that derivatives are used to manage:
Market Risk: Price fluctuations in stocks, commodities, interest rates, or currencies.
Credit Risk: Risk of counterparty default.
Liquidity Risk: Inability to exit a position quickly.
Operational Risk: Failures in systems, processes, or human errors.
Systemic Risk: Risk that spreads across the financial system (e.g., 2008 crisis).
Derivatives don’t eliminate risk; they transfer it from one participant to another. Hedgers reduce their exposure, while speculators take on risk for potential reward.
3. Hedging with Derivatives
3.1 What is Hedging?
Hedging is like insurance—it reduces potential losses from adverse movements. A hedger gives up some potential profit in exchange for predictability and stability.
For example:
A farmer fears falling wheat prices → hedges using wheat futures.
An airline fears rising fuel costs → hedges using oil futures.
An exporter fears a weak USD → hedges using currency forwards.
3.2 Hedging vs. Speculation
Hedger: Uses derivatives to reduce risk (not to make a profit).
Speculator: Uses derivatives to bet on market direction (aims for profit).
Arbitrageur: Exploits price inefficiencies between markets.
4. Hedging Strategies with Derivatives
4.1 Hedging with Futures
Long Hedge: Used by consumers to protect against rising prices.
Example: An airline buys crude oil futures to lock in fuel costs.
Short Hedge: Used by producers to protect against falling prices.
Example: A farmer sells wheat futures to secure current prices.
4.2 Hedging with Options
Options are more flexible than futures.
Protective Put:
Buy a put option to protect against downside risk.
Example: An investor holding Reliance shares buys put options to protect against a price fall.
Covered Call:
Hold a stock and sell a call option.
Generates income but caps upside.
Collar Strategy:
Buy a put and sell a call.
Creates a range of outcomes, limiting both upside and downside.
Straddles & Strangles (for volatility hedging):
Buy both call & put when expecting high volatility.
4.3 Hedging with Swaps
Interest Rate Swap:
A company with floating-rate debt fears rising rates → swaps floating for fixed.
Currency Swap:
A US firm with Euro debt can swap payments with a European firm holding USD debt.
Commodity Swap:
An airline fixes jet fuel costs via commodity swaps.
4.4 Hedging in Different Markets
Equity Markets:
Portfolio hedging with index futures.
Example: Mutual funds hedge exposure to Nifty 50 via index options.
Commodity Markets:
Farmers, miners, oil producers hedge production.
Consumers (airlines, food companies) hedge input costs.
Currency Markets:
Exporters hedge against foreign exchange depreciation.
Importers hedge against appreciation.
Interest Rate Markets:
Banks, borrowers, and bond issuers hedge against rate fluctuations.
5. Case Studies in Hedging
5.1 Airlines and Fuel Hedging
Airlines face volatile jet fuel prices. Many hedge by buying oil futures or swaps.
Example: Southwest Airlines successfully hedged oil prices in the early 2000s, saving billions when crude prices surged.
5.2 Agricultural Producers
Farmers lock in prices using commodity futures.
For example, a soybean farmer may short soybean futures at planting season to secure revenue at harvest.
5.3 Exporters and Importers
An Indian IT company expecting USD revenues hedges via currency forwards.
An importer of machinery from Germany hedges by buying EUR futures.
5.4 Corporate Debt Management
Companies with large loans hedge interest rate exposure through interest rate swaps—converting floating liabilities into fixed ones.
6. Risks & Limitations of Hedging
While hedging reduces risk, it is not foolproof.
Cost of Hedging:
Options premiums reduce profits.
Futures may require margin and daily mark-to-market losses.
Imperfect Hedge:
Hedge may not fully cover exposure (basis risk).
Example: Using Brent futures while actual exposure is to WTI oil.
Opportunity Cost:
Hedging limits upside potential.
For instance, selling a covered call caps maximum gains.
Liquidity Risks:
Some derivatives (especially OTC) may be illiquid.
Counterparty Risks:
OTC contracts depend on the financial strength of the counterparty.
7. Advanced Hedging Techniques
7.1 Delta Hedging
Used in options trading to remain neutral to small price movements by adjusting positions.
7.2 Cross-Hedging
Using a related but not identical asset.
Example: Hedging jet fuel exposure using crude oil futures.
7.3 Dynamic Hedging
Continuously adjusting hedge positions as market conditions change.
7.4 Portfolio Hedging
Using index derivatives to hedge an entire portfolio instead of individual stocks.
8. Regulatory & Accounting Aspects
Regulation:
Derivatives markets are heavily regulated to avoid systemic risks.
In India: SEBI regulates equity & commodity derivatives.
Globally: CFTC (US), ESMA (Europe).
Accounting:
IFRS & GAAP have detailed rules for hedge accounting.
Mark-to-market and disclosure requirements are strict.
9. Role of Derivatives in Financial Crises
While derivatives are powerful, misuse can be dangerous.
2008 Crisis: Credit Default Swaps (CDS) amplified risks in mortgage markets.
Barings Bank Collapse (1995): Unauthorized futures trading led to bankruptcy.
These highlight that derivatives are double-edged swords—powerful risk tools but potentially destructive if misused.
10. The Future of Derivatives & Hedging
Technology & AI: Algorithmic trading and AI models are improving risk management.
Crypto Derivatives: Bitcoin futures, Ethereum options are gaining traction.
ESG & Climate Hedging: Weather derivatives and carbon credit futures are emerging.
Retail Participation: Platforms now allow smaller investors to access hedging tools.
Conclusion
Derivatives and hedging strategies form the risk management backbone of global finance. They allow businesses to stabilize revenues, protect against uncertainty, and make long-term planning feasible. From farmers to airlines, from exporters to banks, hedging is indispensable.
However, hedging is not about eliminating risk completely—it’s about managing risk intelligently. When used properly, derivatives act as shock absorbers in volatile markets, ensuring stability and growth. But when misused, they can magnify risks and create systemic failures.
Thus, successful use of derivatives requires:
A clear understanding of exposures.
Appropriate choice of instruments.
Discipline in execution.
Continuous monitoring and adjustment.
In short, derivatives and hedging strategies embody the balance between risk and reward, and mastering them is essential for anyone engaged in the modern financial world.
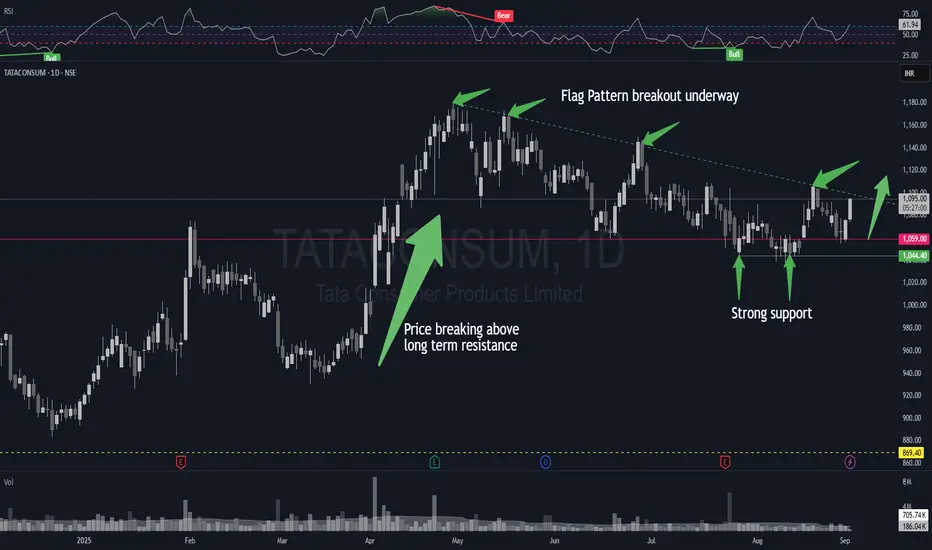
NSE:TATACONSUM - Flag Pattern breakout on cardsAfter breaking above a long-term resistance level near 1050 in April, the price consolidated above 1050 and formed a Flag Pattern. Bouncing from the support, showing positive momentum on RSI, and a bullish trend on MACD confirms the bullish view. After the breakout is complete, any pullback towards 9EMA or 21EMA may be used for entry, while keeping SL at 1030 on a daily closing basis.
Disclaimer: This idea is for educational and learning purposes only and not to be construed as a suggestion/advice to buy or sell any instrument. Please consult your investment advisor before making an investment. All the investments are subject to market risks.
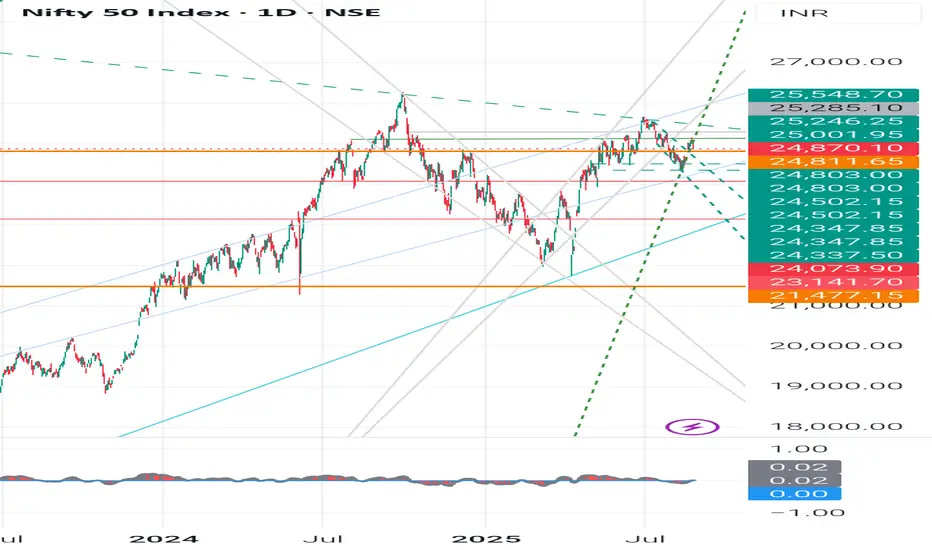
Nifty 50 - Technical Chart Pattern Analysis, With LevelsNifty 50 - Technical Chart Analysis (as per Daily chart)
Current Price (CMP): 25,070
Trend: Sideways consolidation between 24,500 - 25,500 levels.
Chart Pattern:
Multiple tests of 25,500 - strong resistance.
Multiple supports around 24,500 - 24,800 - strong demand zone.
The broad pattern looks like a Rectangle / Range-bound movement.
Swing Analysis:
Higher swing lows visible after 24,000 - bullish undertone.
Lower swing highs at 25,500 - supply pressure.
Key Levels
- Immediate Resistance: 25,250 - 25,550 - 26,000
- Immediate Support: 24,800 - 24,500 - 24,073
Major Support: 23,141 - 21,477 (long-term trend support)
👉Candlestick Learnings (Recent Pattern)
Recent candles show long wicks both sides - market indecision (buyers & sellers fighting).
A strong green bullish engulfing candle near 24,500 support - sign of buyers stepping in.
Current candles forming inside bars - breakout move expected soon (either above 25,500 or below 24,500).
✍️Student Learning Point:
When candles show long wicks near support - it signals accumulation.
When candles cluster near resistance - expect breakout/reversal.
Always confirm with volume before taking position.
Fundamental Comparison - Nifty Competitors (Index Peers)
Since Nifty 50 is an index, let’s compare with other global indices (macro investing perspective):
Index P/E Ratio Dividend Yield 5Y CAGR Returns Volatility
Nifty 50 -22-23 -1.2% -13% Moderate
Sensex -24 -1.1% -12% Moderate
Dow Jones -21 -1.7% -9% Lower
Nasdaq 100 -28 -0.9% -15% High
Shanghai Comp -17 -2.0% -5% Moderate
Learnings:
Nifty has a healthy P/E (not cheap, not too expensive).
Growth rate is higher than global averages - India is attractive long-term.
Volatility is moderate, making Nifty good for SIP investors & long-term compounding.
Investment Learnings for Students
1. Candlestick Patterns: Learn basics like Doji, Engulfing, Hammer, Shooting Star - they often show reversal/continuation.
2. Swing Analysis: Markets move in swings (higher highs/lows in uptrend, lower highs/lows in downtrend). Recognizing them helps in entry/exit.
3. Support & Resistance: Always mark key levels before trading/investing.
4. Fundamentals: Don’t just look at charts - check P/E, dividend yield, EPS growth, sector weightage.
5. Risk Management: Use stop-loss in trading. For investing, use SIP & diversify.
⚠️ Disclaimer
This analysis is for educational purposes only. Not a SEBI-registered advisory. Students & investors should do their own research or consult a financial advisor before making decisions.
#Nifty50 #StockMarketIndia #TechnicalAnalysis #InvestingForBeginners #CandlestickPatterns #SwingTrading #SupportAndResistance #StockMarketEducation #MarketLearning
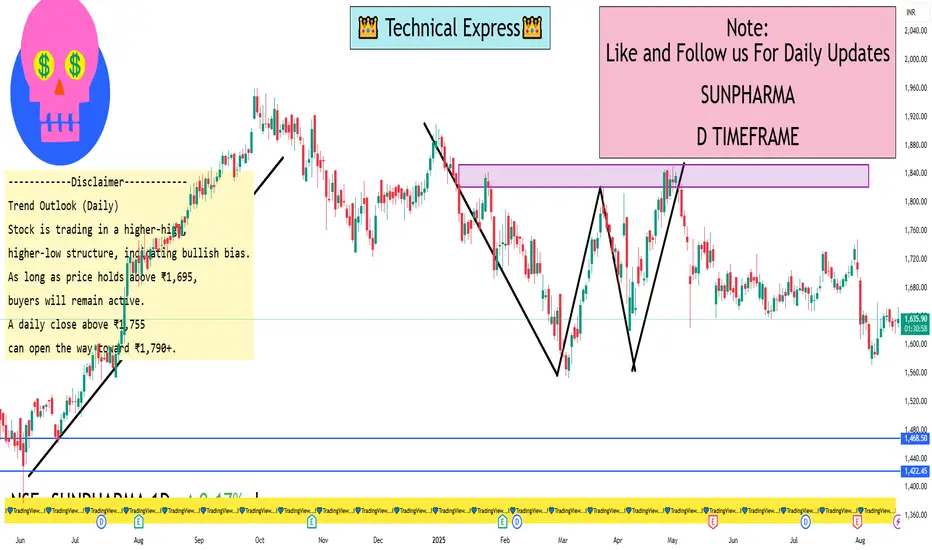
Sunpharma 1 day ViewSun Pharma – Daily Chart Levels
Immediate Resistance: ₹1,745 – ₹1,755
Major Resistance Zone: ₹1,790 – ₹1,810 (breakout zone for further rally)
Immediate Support: ₹1,705 – ₹1,695
Strong Support Zone: ₹1,660 – ₹1,650
Trend Outlook (Daily)
Stock is trading in a higher-high, higher-low structure, indicating bullish bias.
As long as price holds above ₹1,695, buyers will remain active.
A daily close above ₹1,755 can open the way toward ₹1,790+.
A break below ₹1,695 may bring downside toward ₹1,660.
Trading Discipline with Biofeedback1. Introduction: Why Trading Discipline is Hard
In the world of financial markets, traders are constantly balancing analysis with emotion. Charts and data may look purely rational, but the human brain does not operate like a spreadsheet. Instead, traders face fear, greed, overconfidence, hesitation, and impulse — all in rapid cycles during market hours.
Trading discipline is the ability to execute a trading plan consistently, without being swayed by emotional impulses or external noise. It’s what separates a professional who survives years in the market from someone who burns out after a few months.
The challenge? Even the best-prepared trader can watch their discipline crumble in moments of market stress. This is where biofeedback comes in — a method for measuring and controlling physiological responses to improve self-control and decision-making under pressure.
2. What is Biofeedback in the Context of Trading?
Biofeedback is a technique where you use electronic monitoring devices to measure physiological functions — like heart rate, breathing rate, muscle tension, skin conductance, and brainwave activity — and then use that real-time data to learn how to control them.
In trading, biofeedback can help you:
Recognize early signs of stress before they impact your judgment.
Maintain an optimal arousal level for peak performance.
Train your nervous system to remain calm in volatile situations.
Develop habits that strengthen mental resilience over time.
Example:
A trader using a heart rate variability (HRV) monitor might notice their HRV drops significantly before a losing trade — a sign of rising stress. With practice, they can use breathing techniques to restore calm and prevent impulsive decisions.
3. The Science Behind Biofeedback for Traders
3.1. The Stress-Performance Curve
This is based on the Yerkes–Dodson Law, which shows that performance improves with physiological arousal — but only up to a point. Too little arousal (low alertness) leads to sluggish reactions; too much (high anxiety) causes poor judgment.
Biofeedback helps traders stay in the optimal performance zone — alert but calm.
3.2. Physiological Markers in Trading
When you place a trade or watch a volatile market, your body activates the sympathetic nervous system ("fight-or-flight" mode):
Heart rate increases → decision-making becomes reactive.
Breathing shortens → oxygen supply to the brain decreases.
Skin conductance rises → higher sweat response from stress.
Muscle tension increases → physical discomfort, fatigue.
Brainwaves shift → from alpha/theta (calm focus) to high beta (stress).
This physiological shift can override logic. Biofeedback helps you detect these changes before they hijack your behavior.
3.3. Neuroplasticity and Habit Formation
Biofeedback training taps into neuroplasticity — the brain’s ability to rewire itself through repeated experience. By pairing specific mental states (calm focus) with trading activities, you strengthen neural pathways that make discipline more automatic.
4. Why Discipline Breaks in Trading
Even with a perfect trading plan, discipline often fails because:
Emotional Hijacking — The amygdala overrides rational thought under stress.
Overtrading — Dopamine-driven urge to "chase" trades after wins or losses.
Loss Aversion — The tendency to avoid losses at all costs, leading to holding losers too long.
Confirmation Bias — Seeking only information that supports your existing trade.
Fatigue — Poor sleep or extended screen time reduces impulse control.
Biofeedback directly addresses points 1 and 5, and indirectly helps with the rest by improving awareness and emotional regulation.
5. Types of Biofeedback Tools for Traders
5.1. Heart Rate Variability (HRV) Monitors
Function: Measures beat-to-beat variations in heart rate.
Why it’s useful: Higher HRV = greater resilience and adaptability to stress.
Popular devices: Polar H10, Whoop, Elite HRV, Oura Ring.
5.2. Electroencephalography (EEG) Headsets
Function: Measures brainwave activity (alpha, beta, theta, gamma).
Why it’s useful: Identifies mental states — e.g., focus, relaxation, distraction.
Popular devices: Muse, Emotiv Insight.
5.3. Skin Conductance Sensors
Function: Measures electrical conductance of skin (linked to sweat response).
Why it’s useful: Early indicator of stress before conscious awareness.
Popular devices: Empatica E4, GSR2.
5.4. Breathing Feedback Devices
Function: Tracks breathing rate and depth.
Why it’s useful: Calm, diaphragmatic breathing maintains optimal arousal levels.
Popular devices: Spire Stone, Breathbelt.
5.5. Multi-Sensor Platforms
Combine HRV, skin conductance, temperature, movement, and EEG for a full picture.
Often integrated with mobile apps that guide breathing, meditation, or cognitive training.
6. The Biofeedback-Discipline Loop for Traders
Here’s how biofeedback fits into a trader’s workflow:
Baseline Measurement
Monitor your physiological state during calm, non-trading hours.
Establish "normal" HRV, heart rate, and brainwave patterns.
Stress Mapping
Record your physiological data during live trading.
Identify patterns before, during, and after trades — especially losing streaks.
Intervention Training
Use breathing, mindfulness, or focus exercises to restore optimal state.
Repeat until the intervention becomes automatic.
Real-Time Application
Wear biofeedback devices during trading.
Take action the moment stress markers exceed thresholds.
Review and Adjust
Analyze post-trade logs for emotional triggers and physiological patterns.
Update your discipline strategy accordingly.
7. Biofeedback Training Protocol for Traders
Phase 1: Awareness (2–3 Weeks)
Goal: Understand your physiological reactions to market events.
Action Steps:
Wear HRV and skin conductance sensors during trading.
Log market conditions and emotional states alongside data.
Identify recurring "stress spikes" and the situations causing them.
Phase 2: Regulation (3–4 Weeks)
Goal: Learn to control physiological stress responses.
Techniques:
Coherent Breathing: Inhale for 5.5 seconds, exhale for 5.5 seconds.
Progressive Muscle Relaxation: Tense and release muscles from head to toe.
Alpha Wave Training: Use EEG feedback to enter calm, focused states.
Phase 3: Integration (Ongoing)
Goal: Make emotional regulation part of your trading routine.
Action Steps:
Pre-market: 5 minutes of HRV breathing.
During trading: Monitor stress markers, take breaks if needed.
Post-market: Review biofeedback logs and trade journal together.
8. Case Studies
Case Study 1: The Impulsive Scalper
Problem: A day trader entered trades too quickly after losses, leading to overtrading.
Biofeedback Insight: HRV dropped sharply after losing trades; breathing became shallow.
Solution: Implemented 3-minute breathing reset after each loss. Over 6 weeks, reduced revenge trades by 70%.
Case Study 2: The Swing Trader with Exit Anxiety
Problem: Took profits too early due to fear of reversals.
Biofeedback Insight: EEG showed increased beta waves when price approached target.
Solution: Practiced alpha-wave breathing before exit decisions. Result: Average holding time increased by 15%, boosting profits.
Case Study 3: The New Trader with Market Open Stress
Problem: Felt overwhelmed at the opening bell, making erratic trades.
Biofeedback Insight: Skin conductance spiked dramatically at market open.
Solution: Added 10 minutes of pre-market meditation and HRV training. Result: 40% fewer impulsive trades in the first 30 minutes.
9. Advantages of Biofeedback for Trading Discipline
Objective self-awareness: Replaces guesswork with measurable data.
Prevents emotional spirals: Stops small mistakes from snowballing.
Speeds up learning: Accelerates habit formation for calm decision-making.
Customizable: Can be adapted to each trader’s unique stress patterns.
Integrates with trading journal: Creates a full picture of both mental and market performance.
10. Limitations and Considerations
Cost: High-quality devices can be expensive.
Learning curve: Requires time to interpret data and apply techniques.
Over-reliance: Biofeedback should enhance, not replace, psychological skill-building.
Privacy: Data storage should be secure, especially with cloud-based apps.
Conclusion
Trading discipline is not just a mental skill — it’s a mind-body skill. Biofeedback bridges the gap between the psychological and physiological sides of trading performance. By learning to recognize and control your body’s stress responses, you can keep your decision-making sharp, your execution consistent, and your emotions balanced even in high-pressure market environments.
Over time, biofeedback training rewires your nervous system for resilience, turning discipline from a constant battle into a natural, automatic state. And in the competitive world of trading, that could be the difference between long-term success and early burnout.
RALLIS - Ready for Momentum BurstNSE:RALLIS
Technical Analysis
⦿ Its moving in a good uptrend with stair pattern in a Wide channel.
⦿ On 15th of July company posted good results but since than - the stock is just consolidating now its been 1 month, Now it will be time to capitalize on that good earning.
⦿ The current base is clean and a static resistance is formed @386
⦿ Price is Approaching for 3rd time and from last 3 days upmove volume has surged.
⦿ Planning a trade above resistance and keeping a simple 2% stoploss to capture 10% Move.
🟢Entry - 386
♦️Stop - 375
🎯Tgt - 400,425+
The above information is for educational purposes only.
Before acting on any investment idea please do your own analysis and follow proper risk-to-reward, position sizing rules
⦿ If you found this idea Useful, please like and comment 👍💬
Keep Learning,
Happy Trading 🤞**

Part3 learn Institutional Trading Options Trading in India
In India, options are primarily traded on the National Stock Exchange (NSE). Some key features:
Lot Size: Options are traded in fixed lot sizes (e.g., Nifty = 50 units).
Settlement: Cash-settled (no delivery of underlying).
Expiry: Weekly (Thursday) and Monthly (last Thursday).
Margins: Sellers must maintain margin with their broker.
Popular contracts include:
Nifty 50 Options
Bank Nifty Options
Fin Nifty Options
Stock Options (e.g., Reliance, HDFC, TCS)
Tools & Platforms
Successful options trading often relies on good tools:
Broker Platforms: Zerodha, Upstox, Angel One, ICICI Direct.
Charting Tools: TradingView, ChartInk, Fyers.
Option Analysis Tools:
Sensibull
Opstra DefineEdge
QuantsApp
NSE Option Chain
These tools help visualize OI (Open Interest), build strategies, and simulate outcomes.

AT&T Inc BREAKOUTAT&T Inc Share has broken its previous pattern after a strong bullish move. It increased by 100% in two years, from 14 to 27, and now it’s breaking out with a big bullish monthly candle. Due to this strong upward momentum over the past few years, the stock might consolidate for a while before moving higher. This means the upward move could take some time or even a year, so we should keep that in mind when swing trading or investing.
The target and stoploss levels depend on each person’s risk appetite. A minimum risk-reward ratio of 1:1 is always good for swing trades. For example, if our target is around 32 or 33, we could set the stoploss below 25, like at 24.5. This would give a risk-reward ratio of approximately 1.77.
This is just an analysis based on the chart pattern. We can't always expect the share to move exactly as we want. That's why we always put a stoploss. Because many different people are trading based on their own thoughts and decisions. So, never feel bad if a share doesn’t move the way you expect. There’s always an opportunity somewhere else to grab.

3MINDIA at Breakout Crossroads📅 Chart Type: Daily
📉 Structure Observed: Downtrend Channel → Breakout Attempt → Symmetrical Triangle
📌 Current Price: ₹29,620
🔍 Chart Analysis Summary:
3M India has been under a prolonged downtrend since mid-2023, clearly respecting the falling channel (highlighted in blue). However, since March 2025, a base seems to be forming, and price action has converged into a symmetrical triangle pattern (yellow lines), signaling a potential breakout.
💥 Trade Ideas
✅ Long Trade (High Risk, High Reward):
If price decisively breaks out above the triangle resistance (~₹30,000+), it could be the first real sign of trend reversal after months of weakness. Potential targets could be:
₹31,200 (resistance zone)
₹33,500+ (previous swing highs)
Stop-loss: Below ₹28,800 (lower triangle boundary)
Risk: Moderate-High (False breakout possibility due to low volume)
⚠️ Risky Trade:
Given the triangle formation at the end of a downtrend, this could also be a bearish continuation pattern. A fake breakout followed by rejection could trap bulls.
💡 Avoid trading until confirmation (volume spike + close above resistance or breakdown)
📉 Short Trade:
If price breaks below ₹28,800 with volume, the stock could revisit:
₹27,000 (March support)
₹25,000 (channel support retest)
Stop-loss: ₹30,100 (triangle resistance)
Risk: Medium
Reward: High if channel resumes downward
🔁 Swing Trade Perspective:
This setup is ideal for swing traders who thrive on breakouts or breakdowns from tight consolidations.
📈 Breakout Swing: Enter above ₹30,000 with target ₹33,500
📉 Breakdown Swing: Enter below ₹28,800 with target ₹25,000
🧠 Wait for confirmation candle (daily close + volume) before entry.
📌 Key Zones to Watch:
Resistance: ₹30,000 – ₹31,200
Support: ₹28,800, ₹27,000
Volume Spike: Needed to confirm move direction
🧠 Final Thoughts:
This is a make-or-break level for 3M India. Traders should be cautious but alert. Whether you're bullish or bearish, this consolidation is unlikely to last much longer — and a sharp move is imminent.
"In the market, the biggest profits often come from waiting for the right setup. This might be one."
📉💰 Trade responsibly. Always manage your risk.
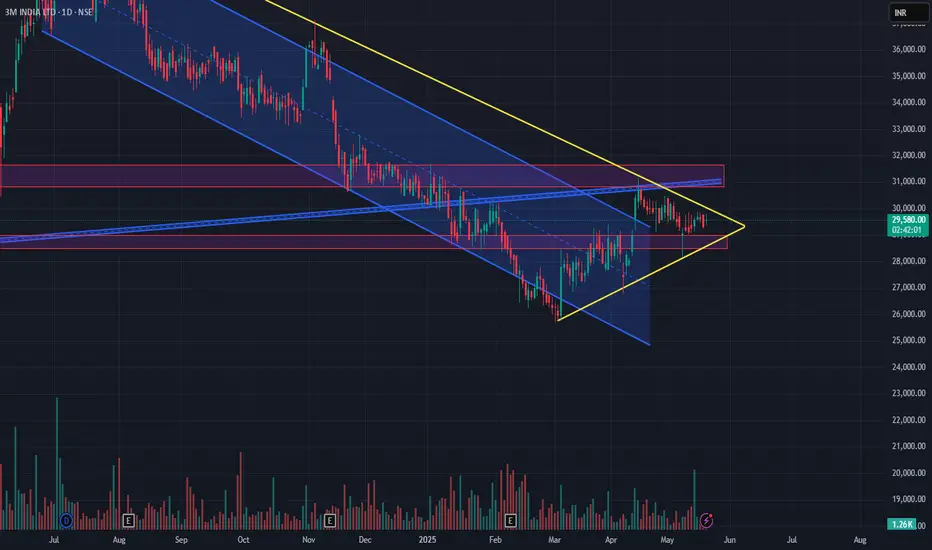
USD/JPY 15-Minute Chart AnalysisKey Observations:
1. Trendline Break:
- A potential break below the upward trendline indicates bearish momentum.
2. Supply Zone:
- The price is trading within a highlighted supply zone.
3. Short Trade Setup:
- A short position will be active after breakdown, with the following targets and stop-loss:
- Stop-Loss: Above 157.440
- Target 1: 156.76
- Target 2: 156.493
- Target 3: 156.100
---
Trading Scenarios:
1. Bearish Continuation:
- If the price sustains below 157.030, bearish momentum is likely to accelerate toward 156.100.
2. Invalidation of Bearish Setup:
- A move above 157.6 would invalidate this bearish setup, signaling a potential bullish reversal.
---
Trading Plan:
- Entry (Sell): Below 157.030, targeting 156.810, 156.500, and 156.090.
- **Stop-Loss**: Above **157.436**.
---
This trade setup is in line with bearish market structure, but closely monitor price action around support levels and trailing stop-loss adjustments as the trade progresses.
Disclaimer:
This analysis is for informational purposes only and does not constitute financial advice. Trading involves substantial risk, and past performance is not indicative of future results. Always conduct your own research and consult a financial advisor before making investment decisions. Trade responsibly.

Expleo SolutionsTechnical Analysis of Expleo Solutions:
Expleo Solutions' price has been range-bound for over two years, specifically 847 days. The peak it reached between May 2023 and August 2023 is considered an outlier, as the stock has since reverted to its prior trading range.
Despite this, the stock has experienced a notable 55% increase in trading volume, from 6.2 million shares to 9.6 million over the last 470 days. This increase is significant when compared to the previous 470-day period. The MACD also suggests a decline in seller interest, indicating potential shifts in momentum that could lead to a more positive outlook.
Two key support and resistance levels have been identified, which will be pivotal in determining future price movements.
Potential Risk:
The primary risk to the stock's upward trajectory is the possibility of a broader market correction, particularly influenced by uncertainty in the Index and geopolitical tensions.
Disclaimer:
This analysis is intended for educational purposes and is not a purchase recommendation. It is important to learn how to recognize and understand patterns in stock movements.
