AI Analysis: The Inflation Nightmare ContinuesIntroduction
As we approach the end of 2025, the global economy remains entrenched in an inflationary crisis that shows no immediate signs of abating. From India to the United States, from emerging markets to developed nations, inflation continues to erode purchasing power, disrupt markets, and challenge policymakers. Artificial Intelligence (AI) has become an indispensable tool in analyzing this complex phenomenon, offering insights that blend data science, economics, and forecasting.
This analysis delves into the persistent inflationary trends of 2025, examining their causes, impacts, and the role of AI in understanding and addressing this economic challenge.
Understanding the Inflationary Surge
1. Global Supply Chain Disruptions
The aftermath of the COVID-19 pandemic, coupled with geopolitical tensions, has led to significant disruptions in global supply chains. These disruptions have resulted in shortages of essential goods, driving up prices. AI models have been instrumental in tracking these supply chain bottlenecks, using real-time data to predict potential shortages and price hikes.
2. Energy Prices and Commodity Inflation
The surge in energy prices, particularly oil and natural gas, has had a cascading effect on the prices of other commodities. AI-driven analytics have shown a direct correlation between energy costs and the prices of goods, as transportation and production costs rise. These insights are crucial for policymakers to understand the broader implications of energy price fluctuations.
3. Labor Market Dynamics
In many regions, labor markets have tightened, leading to wage inflation. AI tools have analyzed employment data to identify trends in wage growth and its impact on overall inflation. These analyses help in understanding the balance between wage increases and productivity gains, which is essential for assessing the sustainability of inflationary pressures.
The Role of AI in Inflation Analysis
Artificial Intelligence has revolutionized the way economists and policymakers analyze inflation. By processing vast amounts of economic data, AI can identify patterns and correlations that might be overlooked by traditional methods. Some key applications include:
Predictive Modeling: AI algorithms can forecast inflation trends by analyzing historical data and identifying leading indicators.
Sentiment Analysis: AI tools can analyze news articles, social media, and financial reports to gauge public sentiment and its potential impact on inflation expectations.
Supply Chain Optimization: AI can identify inefficiencies in supply chains, suggesting areas where improvements can be made to reduce costs and mitigate inflationary pressures.
The Impact on Consumers and Businesses
1. Erosion of Purchasing Power
Consumers are feeling the pinch as their incomes fail to keep pace with rising prices. AI-driven consumer behavior models indicate a shift towards more budget-conscious spending, with increased demand for discount retailers and private-label products.
2. Business Adaptation Strategies
Businesses are employing AI to optimize pricing strategies, manage inventory, and streamline operations to cope with inflation. Machine learning algorithms help in dynamic pricing, adjusting prices in real-time based on market conditions and competitor actions.
Policy Responses and Challenges
Governments and central banks have implemented various measures to combat inflation, including interest rate hikes and fiscal stimulus packages. However, AI analyses suggest that these measures have had limited success in the current environment due to factors such as global supply chain issues and geopolitical uncertainties.
Conclusion
The inflationary crisis of 2025 presents a multifaceted challenge that requires a nuanced understanding and a coordinated response. AI has proven to be an invaluable tool in analyzing and addressing this issue, offering insights that are critical for informed decision-making. As we move forward, the integration of AI into economic analysis will be essential in navigating the complexities of the global economy and mitigating the impacts of inflation.
Trdaingview
Part 2 Master Class of Intraday TradingCall and Put Options Explained
A Call Option gives the buyer the right to purchase an asset at a specific price (strike price) before or on the expiry date. Investors buy calls when they expect the asset’s price to rise. Conversely, a Put Option gives the buyer the right to sell the asset at the strike price, used when expecting a price fall. Sellers of options (writers) have obligations—call writers must sell, and put writers must buy if exercised. The interplay between call and put options allows for complex strategies, such as spreads and straddles. Understanding how both function is vital for predicting market direction and building profitable positions.

Part 1 Master Class of Intraday Trading Understanding the Concept of Options
Option trading involves financial contracts that give buyers the right, but not the obligation, to buy or sell an underlying asset—like a stock, index, or commodity—at a predetermined price within a specific period. The two main types are Call Options (buy rights) and Put Options (sell rights). Unlike owning shares directly, options let traders speculate on price movements with limited capital. The right to buy or sell comes at a cost known as the premium. Options are widely used for hedging, speculation, and income generation. Their value is influenced by factors such as volatility, time decay, and market sentiment. Understanding these dynamics helps traders manage risk and seize market opportunities efficiently.

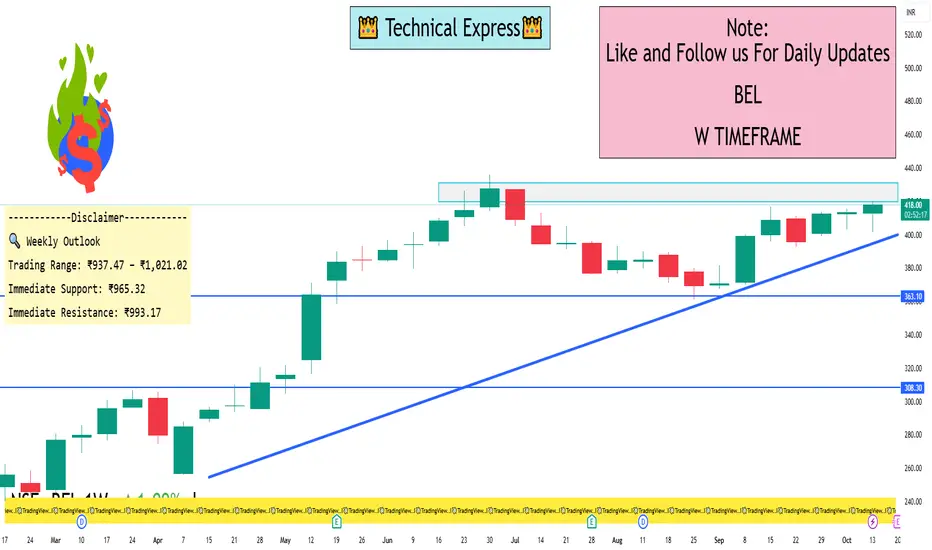
BEL 1 Day View 📊 Daily Support & Resistance Levels
Support Levels: ₹409.67 (S2), ₹407.53 (S1)
Resistance Levels: ₹413.32 (Pivot), ₹416.97 (R2), ₹419.57 (R3)
The current price is trading above the central pivot point, indicating a potential continuation of the upward trend.
🔧 Technical Indicators
RSI (14): 73.1 — Approaching overbought territory, suggesting strong bullish momentum.
MACD: +2.23 — Positive and above the signal line, reinforcing the buy signal.
ADX (14): 43.07 — Indicates a strong trend with increasing momentum.
Stochastic RSI: 100 — Overbought, but can remain in this zone during strong trends.
Williams %R: -7.69 — In overbought territory, aligning with the bullish trend.
📈 Moving Averages
MA5: 416.19
MA10: 413.97
MA20: 410.59
MA50: 409.43
MA100: 408.19
MA200: 402.58
All moving averages are in a bullish alignment, supporting the upward momentum.
📌 Summary
BEL is currently exhibiting a strong bullish trend on the daily timeframe, with prices above key support and resistance levels. Technical indicators such as RSI, MACD, and ADX confirm the strength of the trend. Traders should monitor the price action around the resistance levels for potential breakout opportunities.
Part 11 Trading Master Class With Experts Market Participation and Flexibility:
Option trading allows investors to participate in markets with diverse strategies without directly owning the underlying assets. Traders can speculate on upward, downward, or even sideways movements of the asset, using strategies like covered calls, straddles, or iron condors. This flexibility makes options suitable for different market conditions and investor goals. Unlike stocks, options can generate income through premium collection, or be used to adjust existing positions dynamically. By choosing strike prices, expiration dates, and contract sizes, traders can customize risk-reward profiles to align with their market outlook, making options highly versatile instruments.

Part 6 Institutional Trading enefits and Risks of Option Trading
Benefits:
Limited risk for buyers (only the premium is at risk).
High leverage with a small capital requirement.
Can be used for hedging against stock price movements.
Risks:
Option sellers face unlimited risk if the market moves against them.
Time decay reduces option value as expiry approaches.
Requires good understanding of volatility and market trends.

Part 4 Institutional Trading Types of Option Trading Strategies
Option traders use different strategies depending on their market view:
Bullish Strategies: Buying Call Options, Bull Call Spreads.
Bearish Strategies: Buying Put Options, Bear Put Spreads.
Neutral Strategies: Iron Condor, Straddle, Strangle — for when the trader expects low volatility.
These strategies help balance risk and reward, allowing traders to profit even in sideways markets.

Part 2 Ride The Big Moves Key Components of Option Contracts
Every option has specific terms that determine its value and use:
Underlying Asset: The stock, index, or commodity the option is based on.
Strike Price: The pre-decided price at which the buyer can buy or sell the asset.
Premium: The price paid to purchase the option.
Expiry Date: The date when the option contract ends.
Lot Size: The number of shares per contract (e.g., 50 shares for NIFTY options).
The value of an option depends on factors such as the market price of the asset, time left to expiry, and volatility. These factors influence whether the option is in-the-money (ITM), at-the-money (ATM), or out-of-the-money (OTM).

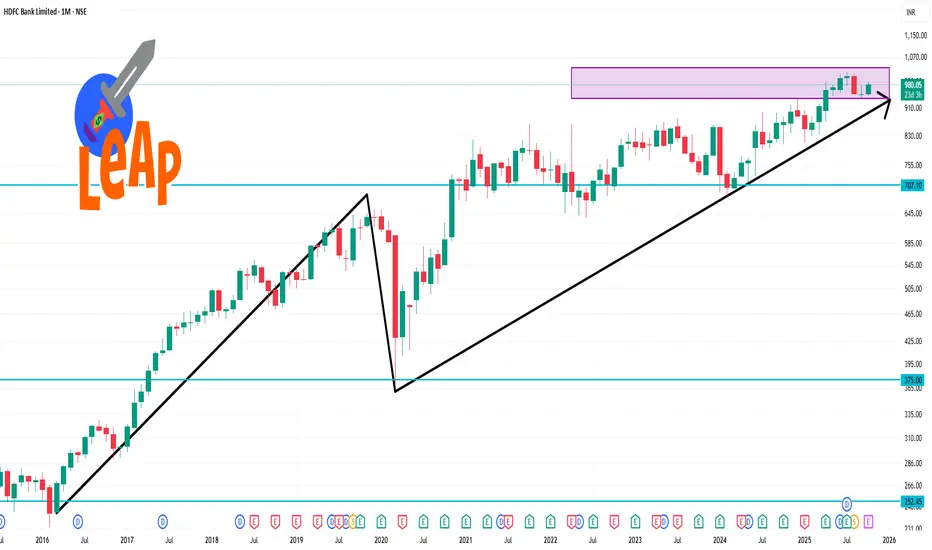
HDFCBANK 1 Month Time Frame 📊 1-Month Technical Outlook
Technical Rating: Strong Buy
Pivot Points:
Classic: Pivot: ₹960.28 | Support: ₹937.03, ₹951.12 | Resistance: ₹974.37, ₹983.53, ₹997.62
Fibonacci: Pivot: ₹960.28 | Support: ₹945.91, ₹951.40 | Resistance: ₹974.65, ₹983.53
Camarilla: Pivot: ₹961.30 | Support: ₹961.09, ₹963.80 | Resistance: ₹967.85, ₹969.21
Moving Averages:
Short-Term (MA5, MA10, MA20): Buy
Medium-Term (MA50): Sell
Long-Term (MA100, MA200): Buy
Relative Strength Index (RSI): 50.54 (Neutral)
MACD: -4.82 (Sell)
Average True Range (ATR): 13.27 (Moderate Volatility)
ADX (Trend Strength): 19.12 (Weak Trend)
Williams %R: -36.70 (Buy)
Commodity Channel Index (CCI): -13.66 (Neutral)
Rate of Change (ROC): -0.22 (Sell)
🔍 Summary
HDFC Bank's stock shows a bullish trend over the past month, with positive technical indicators and a strong buy signal. However, the neutral RSI and sell signal from the MACD suggest caution. Investors should monitor these indicators closely for potential shifts in market sentiment.
Part 8 Trading Master ClassPart 1: Introduction to Option Trading
Options are financial derivatives that derive their value from an underlying asset such as stocks, indices, commodities, or currencies. Unlike shares, buying an option doesn’t mean you own the asset—it gives you the right but not the obligation to buy or sell the asset at a pre-agreed price within a set period. This flexibility makes options a powerful tool for hedging, speculation, and income generation.
Part 2: What is a Derivative?
A derivative is a financial contract whose value depends on another asset. Futures and options are the two most popular derivatives. While futures require you to buy/sell at expiry, options give you the choice. This “choice” is what makes them unique—and sometimes tricky.
Part 3: The Two Types of Options
Call Option – Gives the buyer the right to buy an asset at a fixed price (strike price).
Example: If you buy a call option of Reliance at ₹2500, and the stock moves to ₹2600, you can still buy it at ₹2500.
Put Option – Gives the buyer the right to sell an asset at a fixed price.
Example: If you buy a put option at ₹2500 and the stock falls to ₹2400, you can still sell it at ₹2500.
Part 4: Key Terminologies
Strike Price – The pre-decided price of buying/selling.
Premium – The cost paid to buy the option.
Expiry Date – The last date till which the option is valid.
In-the-Money (ITM) – Option has intrinsic value.
Out-of-the-Money (OTM) – Option has no intrinsic value.
At-the-Money (ATM) – Strike price is close to market price.
Part 5: Call Option in Detail
A call option is ideal if you expect the price of an asset to rise. Buyers risk only the premium paid, while sellers (writers) can face unlimited losses if prices rise sharply. Traders often buy calls for bullish bets and sell calls to earn premium income.
Part 6: Put Option in Detail
A put option is profitable when asset prices fall. Buyers of puts use them for protection against a market crash, while sellers hope prices won’t fall so they can pocket the premium. Investors holding stocks often buy puts as insurance against downside risk.
Part 7: How Option Premium is Priced
Option premium = Intrinsic Value + Time Value
Intrinsic Value: Actual value (e.g., if Reliance is ₹2600 and strike is ₹2500, intrinsic = ₹100).
Time Value: Extra cost traders pay for the possibility of favorable movement before expiry.
Pricing is also influenced by volatility, interest rates, and dividends.
Part 8: The Greeks in Options
The Greeks measure option sensitivity:
Delta – Measures how much option price moves for a ₹1 move in stock.
Gamma – Measures how delta changes with stock movement.
Theta – Measures time decay (options lose value as expiry approaches).
Vega – Measures sensitivity to volatility.
Rho – Measures sensitivity to interest rates.
Part 9: Why Traders Use Options
Options are versatile. Traders use them to:
Speculate on price movements with limited risk.
Hedge against adverse market moves.
Generate Income by selling options (collecting premiums).
Leverage positions with less capital compared to buying shares directly.
Part 10: Buying vs Selling Options
Buying Options: Limited risk (premium), unlimited profit potential.
Selling Options: Limited profit (premium), unlimited risk.
Example: Selling a naked call when markets rise aggressively can cause heavy losses.

Option Trading 1. Speculation with Options
Options allow leverage, letting traders profit from small price movements with limited capital. Risk is limited to the premium paid for buyers, but sellers face potentially unlimited risk.
2. Option Styles
Options come in different styles:
European Options: Can be exercised only at expiry.
American Options: Can be exercised anytime before expiry.
Bermudan Options: Exercise possible on specific dates before expiry.
3. Factors Affecting Option Prices
Option premiums are influenced by:
Underlying asset price
Strike price
Time to expiry
Volatility
Interest rates
Dividends
Understanding these factors helps in predicting option price movement.
4. Intrinsic vs. Extrinsic Value
Intrinsic value: Real value if exercised now.
Extrinsic value: Additional premium based on time and volatility.
Example: If a stock trades at ₹520 and the call strike is ₹500, intrinsic value = ₹20, rest is extrinsic value.
5. Option Strategies
There are basic and advanced option strategies:
Single-leg: Buying a call or put.
Multi-leg: Combining options to reduce risk or maximize profit (e.g., spreads, straddles, strangles).
Example: Covered call involves holding the stock and selling a call to earn extra premium.
6. Risk Management
Options trading requires strict risk management:
Limit exposure per trade.
Use stop-loss orders.
Diversify strategies.
Monitor Greeks to assess risk dynamically.
7. Advantages of Options
Flexibility in trading.
Leverage for small capital.
Hedging against price swings.
Profit in any market condition using proper strategies.
8. Disadvantages of Options
Complexity compared to stocks.
Time decay can erode value.
Unlimited risk for option sellers.
Requires continuous monitoring of market movements.
9. Real-life Examples
Hedging: A farmer selling wheat futures and buying put options to secure a minimum price.
Speculation: A trader buying Nifty call options before earnings season to profit from upward movement.
Income: Selling covered calls on owned stocks to earn premiums regularly.
10. Conclusion
Option trading is a powerful tool for hedging, speculation, and income generation, but it requires knowledge, discipline, and risk management. Understanding strike prices, premiums, Greeks, and strategies ensures that traders can capitalize on market movements effectively. Beginners should start with simple strategies and gradually explore complex multi-leg positions as they gain confidence.

PCR Trading Strategies1. Strategic Approaches to Options Trading
Options strategies can be simple or complex, depending on the trader’s risk tolerance, market outlook, and capital. These strategies are categorized into basic, intermediate, and advanced levels.
1.1. Basic Strategies
Buying Calls and Puts: Simple directional trades.
Protective Puts: Hedging against portfolio declines.
Covered Calls: Generating income from existing holdings.
1.2. Intermediate Strategies
Spreads: Simultaneous buying and selling of options to limit risk and reward.
Vertical Spread: Buying and selling options of the same type with different strike prices.
Horizontal/Calendar Spread: Exploiting differences in time decay by using options of the same strike but different expiration dates.
Diagonal Spread: Combining vertical and horizontal spreads for strategic positioning.
Collars: Combining protective puts and covered calls to limit both upside and downside.
1.3. Advanced Strategies
Iron Condor: Selling an out-of-the-money call and put while buying further OTM options to limit risk, profiting from low volatility.
Butterfly Spread: Exploiting low volatility by using three strike prices to maximize gains near the middle strike.
Ratio Spreads and Backspreads: Advanced plays to profit from skewed market expectations or strong directional moves.
2. Identifying Option Trading Opportunities
Successful options trading requires analyzing market conditions, volatility, and liquidity. Key factors include:
2.1. Market Direction and Momentum
Use technical indicators (moving averages, RSI, MACD) to gauge trends.
Trade options in alignment with market momentum for directional strategies.
2.2. Volatility Analysis
Historical Volatility (HV): Measures past price fluctuations.
Implied Volatility (IV): Market’s expectation of future volatility.
Opportunities arise when IV is underpriced (buy options) or overpriced (sell options).
2.3. Earnings and Event Plays
Companies’ earnings announcements, product launches, or macroeconomic events create volatility spikes.
Strategies like straddles or strangles are ideal to capitalize on such events.
2.4. Liquidity and Open Interest
Highly liquid options ensure tight spreads and efficient entry/exit.
Monitoring open interest helps identify support/resistance levels and market sentiment.
3. Risk Management in Options Trading
While options offer significant opportunities, risk management is crucial:
Position Sizing: Limit exposure to a small percentage of capital.
Defined-Risk Strategies: Use spreads and collars to control maximum loss.
Stop-Loss Orders: Protect against rapid adverse movements.
Diversification: Trade multiple assets or strategies to reduce concentration risk.
Implied Volatility Awareness: Avoid buying expensive options during volatility spikes unless justified by market events.

Part 9 Trading Master Class1. How Option Trading Works
Let’s take a practical example.
Stock: TCS trading at ₹3600
You think it will rise.
You buy a call option with strike price ₹3700, paying ₹50 premium.
Two scenarios:
If TCS goes to ₹3900 → You can buy at ₹3700, sell at ₹3900, profit = ₹200 – ₹50 = ₹150.
If TCS stays at ₹3600 → Option expires worthless, you lose only the premium ₹50.
That’s the beauty: limited loss, unlimited profit (for buyers).
For sellers (writers), it’s the opposite: limited profit (premium collected), unlimited risk.
2. Options vs Stocks
Stocks: Ownership of company shares.
Options: Rights to trade shares at fixed prices.
Differences:
Options expire, stocks don’t.
Options require less money upfront (leverage).
Options can hedge risks, stocks cannot.
3. Why Traders Use Options
Options are versatile. Traders use them for three main reasons:
Hedging – Protecting portfolios from losses.
Example: If you own Nifty stocks but fear a market fall, buy a Nifty put option. Losses in shares will be offset by gains in the put.
Speculation – Betting on price moves with limited risk.
Example: Buy a call if you think price will go up.
Income Generation – Selling (writing) options to collect premiums.
Example: Covered calls strategy.
4. Option Pricing: The Greeks & Premium
An option’s price (premium) depends on several factors:
Intrinsic Value: The real value (difference between stock price & strike price).
Time Value: Extra cost due to time left until expiry.
Volatility: Higher volatility = higher premium (more chances of big moves).
The Option Greeks measure sensitivity:
Delta: How much option moves with stock.
Theta: Time decay (options lose value as expiry nears).
Vega: Impact of volatility changes.
Gamma: Rate of change of delta.
5. Strategies in Option Trading
This is where options shine. Traders can design strategies based on market outlook.
Bullish Strategies:
Buying Calls
Bull Call Spread
Bearish Strategies:
Buying Puts
Bear Put Spread
Neutral Strategies:
Iron Condor
Butterfly Spread
Income Strategies:
Covered Calls
Cash-Secured Puts
Options allow creativity – you can profit in rising, falling, or even stagnant markets.

Option Trading 1. Introduction to Options
In the world of financial markets, investors and traders are always looking for instruments that allow them flexibility, leverage, and opportunities to manage risks. One of the most popular derivatives that provide such opportunities is options trading.
An option is a financial contract between two parties: a buyer and a seller. The buyer of the option gets the right, but not the obligation, to buy or sell an underlying asset (like stocks, indices, or commodities) at a predetermined price within a specified time. The seller (also called the option writer) has the obligation to fulfill the contract if the buyer decides to exercise it.
This feature—right without obligation—is what makes options unique compared to other financial instruments.
2. Basic Terminology
Before diving deeper, let’s clarify some key terms:
Call Option: Gives the buyer the right to buy the underlying asset at a fixed price (strike price).
Put Option: Gives the buyer the right to sell the underlying asset at a fixed price.
Strike Price: The pre-agreed price at which the buyer can buy or sell the underlying.
Premium: The cost paid by the option buyer to the seller for the right.
Expiration Date: The last date the option is valid.
In the Money (ITM): When exercising the option is profitable (e.g., stock price above strike for calls, below strike for puts).
Out of the Money (OTM): When exercising leads to a loss, so the buyer won’t exercise.
At the Money (ATM): When the stock price is very close to the strike price.
3. How Options Work – An Example
Suppose stock ABC Ltd. is trading at ₹100.
You expect the stock to rise.
You buy a Call Option with a strike price of ₹105 for a premium of ₹3, expiring in one month.
Scenario 1: Stock rises to ₹115
You exercise your right to buy at ₹105 and immediately sell at ₹115.
Profit = (115 – 105) – 3 = ₹7 per share.
Scenario 2: Stock stays at ₹100
Buying at ₹105 makes no sense, so you let the option expire.
Loss = premium paid = ₹3.
This shows the limited loss (premium only) but unlimited profit potential for an option buyer.
4. Types of Options Trading Participants
There are broadly four categories:
Call Buyers – bullish traders expecting price rise.
Put Buyers – bearish traders expecting price fall.
Call Sellers – take opposite side of call buyers, hoping price stays flat or falls.
Put Sellers – take opposite side of put buyers, hoping price stays flat or rises.
Buyers take on risk by paying premiums, while sellers assume obligations but earn premiums upfront.

Divergence Secrets1. Basic Option Trading Strategies
These are simple, beginner-friendly strategies where risks are limited and easy to understand.
1.1 Covered Call
How it Works: You own 100 shares of a stock and sell a call option against it.
Goal: Earn income (premium) while holding stock.
Best When: You expect the stock to stay flat or slightly rise.
Risk: If stock rises too much, you must sell at the strike price.
Example: You own Infosys at ₹1,500. You sell a call at strike ₹1,600 for premium ₹20. If Infosys stays below ₹1,600, you keep the premium.
1.2 Protective Put
How it Works: You buy a put option to protect a stock you own.
Goal: Hedge downside risk.
Best When: You fear a market drop but don’t want to sell.
Example: You own TCS at ₹3,500. You buy a put with strike ₹3,400. If TCS falls to ₹3,200, your stock loses ₹300, but the put gains.
1.3 Cash-Secured Put
How it Works: You sell a put option while holding enough cash to buy the stock if assigned.
Goal: Earn premium and possibly buy stock at a discount.
Best When: You’re okay owning the stock at a lower price.
2. Intermediate Strategies
Now we step into strategies combining multiple options.
2.1 Vertical Spreads
These involve buying one option and selling another of the same type (call/put) with different strikes but same expiry.
(a) Bull Call Spread
Buy lower strike call, sell higher strike call.
Limited risk, limited profit.
Best when moderately bullish.
(b) Bear Put Spread
Buy higher strike put, sell lower strike put.
Best when moderately bearish.
2.2 Calendar Spread
Buy a long-term option and sell a short-term option at the same strike.
Profits if stock stays near strike as short-term option loses value faster.
2.3 Diagonal Spread
Like a calendar, but strikes are different.
Offers flexibility in adjusting for trend + time.
3. Advanced Option Trading Strategies
These are for experienced traders who understand volatility and time decay deeply.
3.1 Straddle
Buy one call and one put at same strike, same expiry.
Profits if the stock makes a big move in either direction.
Best before major events (earnings, policy announcements).
Risk: If stock stays flat, you lose premium.
3.2 Strangle
Similar to straddle, but strike prices are different.
Cheaper, but requires larger move.
3.3 Iron Condor
Sell an out-of-the-money call spread and put spread.
Profits if stock stays within a range.
Great for low-volatility environments.
3.4 Butterfly Spread
Combination of calls (or puts) where profit peaks at a middle strike.
Limited risk, limited reward.
Best when expecting very little movement.
3.5 Ratio Spreads
Sell more options than you buy (like 2 short calls, 1 long call).
Higher potential reward, but can be risky if stock trends too far.

Intraday Trading Tips1. Understanding Intraday Trading
Before diving into tips, let’s understand what intraday trading means.
Definition: Intraday trading involves buying and selling financial instruments—stocks, futures, options, or currencies—within the same trading session.
Objective: Profit from short-term price fluctuations.
Settlement: All open positions must be squared off before market close.
Leverage: Traders often use margin (borrowed money) to maximize gains, but this also increases risks.
For example: If you buy 100 shares of Reliance at ₹2,450 in the morning and sell them at ₹2,480 by afternoon, your profit is ₹3,000 (excluding brokerage).
2. Why Intraday Trading Attracts Traders
Quick profits: No need to wait for years like investors.
Leverage advantage: Small capital can control large trades.
Liquidity: You trade highly liquid stocks that allow easy entry/exit.
No overnight risk: Positions close before the market shuts.
However, the risks are equally high—overtrading, market volatility, and emotional decisions can wipe out capital quickly.
3. Golden Intraday Trading Tips
Tip 1: Choose the Right Stocks
Not all stocks are suitable for intraday trading.
Prefer liquid stocks (e.g., Reliance, Infosys, HDFC Bank).
Avoid penny stocks with low volumes.
Track stocks in the Nifty 50 and Bank Nifty basket—they have strong daily movement.
Look for stocks that follow market trends and are backed by news, earnings, or events.
Example: A stock with daily volume above 10 lakh shares is generally liquid enough for intraday trading.
Tip 2: Trade with a Plan
Trading without a plan is like sailing without a compass. Define:
Entry price – When to buy or sell.
Exit price – Where to book profits.
Stop-loss – How much you are ready to lose if the market goes against you.
A simple 2:1 risk-reward ratio is ideal. If you risk ₹1,000, target ₹2,000 profit.
Tip 3: Learn Technical Analysis
Intraday trading depends more on charts than company fundamentals.
Use candlestick patterns (Doji, Hammer, Engulfing).
Apply moving averages (50-day, 200-day) to spot trends.
Watch RSI (Relative Strength Index) for overbought/oversold zones.
Check Volume Profile to confirm momentum.
Example: If a stock breaks above a resistance level with high volume, it signals a potential intraday buying opportunity.
Tip 4: Follow Market Trend
“The trend is your friend.”
If the market is bullish, focus on buy opportunities.
If bearish, focus on short-selling opportunities.
Avoid going against the broader market trend.
Intraday traders often use Nifty and Bank Nifty movement as indicators of overall sentiment.
Tip 5: Use Stop Loss Religiously
The most important tool in intraday trading.
Decide in advance how much loss you can tolerate.
Place stop-loss orders immediately after entering a trade.
This prevents panic selling and large losses.
Example: Buy at ₹500, set stop-loss at ₹490. If the stock falls, you exit automatically, limiting loss.
Tip 6: Don’t Trade on Emotions
Greed and fear are the biggest enemies.
Avoid “revenge trading” after a loss.
Don’t chase stocks just because they are moving fast.
Stick to your trading plan, not your emotions.
Tip 7: Timing Matters
First 15 minutes after market opens = high volatility. Wait and observe.
Best trading hours: 9:30 AM to 11:30 AM and 1:30 PM to 2:30 PM.
Avoid trading just before market close unless you are squaring off.
Tip 8: Don’t Overtrade
Trading too many stocks at once increases confusion.
Focus on 2–3 quality trades per day.
Avoid random entry and exit without reason.
Remember: Fewer quality trades > Many random trades.
Tip 9: Keep Learning from Market News
Earnings results, RBI policy, crude oil prices, inflation data—all impact intraday trends.
Use reliable sources like Bloomberg, Moneycontrol, NSE updates.
Avoid tips from WhatsApp or Telegram groups without proper analysis.
Tip 10: Maintain Trading Discipline
Follow your rules strictly.
Keep a trading journal: Note entries, exits, reasons for trade, and results.
Review mistakes and improve.
4. Intraday Trading Strategies
Apart from general tips, let’s look at popular intraday strategies:
Breakout Trading: Enter when price breaks a strong support or resistance.
Momentum Trading: Buy rising stocks with strong volume, sell falling ones.
Scalping: Make multiple small trades for tiny profits.
Gap Trading: Trade based on price gaps at market opening.
Moving Average Crossover: Buy when short-term MA crosses above long-term MA, and vice versa for selling.
5. Risk Management in Intraday Trading
Without risk management, even the best trader will fail.
Never risk more than 1–2% of your capital per trade.
Diversify trades instead of betting everything on one stock.
Use proper leverage—don’t borrow excessively.
Conclusion
Intraday trading can be profitable, exciting, and rewarding, but it demands discipline, knowledge, and patience. Following intraday trading tips like choosing liquid stocks, sticking to stop-loss, respecting market trends, and avoiding emotions can make a big difference between success and failure.
Remember: In trading, survival is more important than speed. If you protect your capital and manage risks well, profits will follow.
Part 1 Ride The Big MovesWhat is an Option?
An option is a financial contract that gives the buyer the right, but not the obligation, to buy or sell an underlying asset at a predetermined price (called the strike price) on or before a specific date (called the expiry date).
There are two main types of options:
Call Option – Gives the buyer the right to buy the underlying asset.
Put Option – Gives the buyer the right to sell the underlying asset.
Example:
If you buy a call option on stock XYZ with a strike price of ₹500, you can buy the stock at ₹500 even if the market price rises to ₹600.
If you buy a put option on stock XYZ at ₹500, you can sell it at ₹500 even if the market price falls to ₹400.
How Options Work
Call Option Buyer: Expects the price to rise. Pays a premium upfront. Profit = Unlimited (price can rise indefinitely) – Premium paid. Loss = Premium paid (if price falls below strike).
Put Option Buyer: Expects the price to fall. Pays a premium upfront. Profit = Strike – Price (max is strike – 0) – Premium paid. Loss = Premium paid.
Option Seller (Writer): Receives the premium. Takes obligation to buy/sell if the buyer exercises. Risk = Can be unlimited for call sellers.
Factors Affecting Option Prices (Option Greeks)
Option price is influenced by:
Delta (Δ) – How much the option price moves with a 1-point move in underlying.
Gamma (Γ) – How fast delta changes with underlying price.
Theta (Θ) – Time decay; how much value the option loses each day.
Vega (V) – Sensitivity to volatility in the underlying asset.
Rho (ρ) – Sensitivity to interest rates.
Tip: Time decay is crucial – options lose value as expiry approaches if the underlying doesn’t move favorably.

Consumer Price Index (CPI) in India1. Understanding the Consumer Price Index (CPI)
The CPI reflects the purchasing power of a country's currency by tracking price changes in a representative basket of goods and services. In India, the Ministry of Statistics and Programme Implementation (MoSPI) compiles the CPI using a base year of 2012. The index is categorized into several groups, including:
Food and Beverages: Comprising items like cereals, pulses, vegetables, fruits, and beverages.
Housing: Reflecting the cost of housing in urban areas.
Clothing and Footwear: Encompassing garments and footwear.
Fuel and Light: Including energy costs such as electricity and fuel.
Miscellaneous: Covering items like education, health, transport, and communication.
Each category has a specific weight in the overall CPI calculation, influencing its impact on the total inflation rate.
2. Recent Trends in India's CPI
July 2025: A Historic Low
In July 2025, India's CPI inflation rate fell to a remarkable 1.55%, the lowest since June 2017. This decline was primarily driven by a significant drop in food prices, with the Consumer Food Price Index (CFPI) turning negative at -1.76%. This marked the first instance of negative food inflation since January 2019
The Times of India
.
The breakdown of inflation rates by sector in July 2025 was as follows:
Rural Areas: Headline inflation at 1.18%, with food inflation at -1.74%.
Urban Areas: Headline inflation at 2.05%, with food inflation at -1.90%.
Combined (All India): Headline inflation at 1.55%, with food inflation at -1.76%
Statistics Ministry
.
These figures indicate a broad-based decline in inflation across both rural and urban sectors.
Factors Contributing to the Decline
Several factors contributed to the sharp decline in CPI inflation:
Base Effect: The high inflation rates in the previous year created a favorable base for comparison, amplifying the perceived decline in current inflation.
Falling Food Prices: A significant decrease in the prices of essential food items, including pulses, vegetables, and cereals, led to negative food inflation.
Stable Fuel Prices: The moderation in fuel prices helped contain overall inflationary pressures.
Government Policies: Measures such as the reduction in Goods and Services Tax (GST) rates on essential items provided relief to consumers and helped lower prices.
3. Sectoral Analysis of CPI Components
Food and Beverages
Food inflation plays a pivotal role in the overall CPI, given its substantial weight in the index. In July 2025, food inflation turned negative, with the CFPI at -1.76%. This was attributed to:
Abundant Harvests: Favorable monsoon conditions led to increased agricultural production, resulting in lower food prices.
Government Interventions: Policies aimed at ensuring food security and stabilizing prices contributed to the decline in food inflation.
Housing
Housing inflation remained relatively stable, with a slight decrease from 3.18% in June 2025 to 3.17% in July 2025. This stability reflects the consistent demand for housing in urban areas and the ongoing challenges in the real estate sector.
Clothing and Footwear
Inflation in this category remained subdued, aligning with the overall trend of reduced consumer spending and stable supply chains.
Fuel and Light
Fuel inflation saw a marginal increase from 2.55% in June 2025 to 2.67% in July 2025. While global oil prices remained volatile, domestic factors such as exchange rates and taxation influenced fuel prices.
Miscellaneous Categories
Education: Inflation in education services remained high at 4.00%, reflecting the increasing cost of private education and related services.
Health: Health inflation stood at 4.57%, driven by rising medical costs and healthcare services.
Transport and Communication: Inflation in this sector was 2.12%, influenced by fuel prices and transportation demand.
4. Regional Disparities in Inflation
Inflation rates varied across different states in India. For instance:
Kerala: Recorded a higher inflation rate due to increased demand and higher costs in urban centers.
Jammu & Kashmir: Experienced elevated inflation, partly due to logistical challenges and supply constraints.
Punjab and Karnataka: Saw moderate inflation rates, reflecting balanced supply and demand dynamics.
These regional disparities underscore the importance of localized economic policies to address specific inflationary pressures.
5. The Role of the Reserve Bank of India (RBI)
The RBI closely monitors CPI inflation as part of its monetary policy framework. The central bank aims to maintain inflation within a target range to ensure economic stability. In response to the declining inflation rates:
Interest Rates: The RBI kept the policy interest rate unchanged at 5.50% in its recent review, citing the benign inflation outlook
Reuters
.
Inflation Targeting: The RBI's flexible inflation targeting framework allows for adjustments in policy to respond to evolving economic conditions.
6. Implications for the Economy
The sharp decline in CPI inflation has several implications:
Consumer Purchasing Power: Lower inflation enhances consumers' purchasing power, potentially boosting demand for goods and services.
Monetary Policy: The RBI's accommodative stance may support economic growth, especially in sectors sensitive to interest rates.
Government Policies: The government may consider fiscal measures to sustain the inflationary trend and support economic recovery.
7. Challenges and Risks
Despite the favorable inflation scenario, several challenges persist:
Global Economic Uncertainties: Fluctuations in global commodity prices and geopolitical tensions can impact domestic inflation.
Supply Chain Disruptions: Ongoing supply chain issues may lead to price volatility in certain sectors.
Monsoon Variability: Dependence on monsoon for agricultural output makes food prices susceptible to climatic variations.
8. Future Outlook
Looking ahead, the CPI inflation trajectory will depend on:
Monsoon Performance: A normal monsoon is crucial for stable food prices.
Global Commodity Prices: Movements in global oil and commodity markets will influence domestic inflation.
Policy Interventions: Continued fiscal and monetary measures will play a role in managing inflation expectations.
Economists forecast that CPI inflation may remain within the RBI's target range in the near term, barring significant external shocks.
9. Conclusion
The Consumer Price Index serves as a vital barometer of economic health in India. The recent decline in CPI inflation reflects a combination of favorable domestic conditions and effective policy measures. However, sustained vigilance is necessary to address emerging challenges and ensure that inflation remains conducive to economic growth and stability.

Part 1 Support and ResistanceThe Role of Options in Financial Markets
Options exist because they provide flexibility and risk management tools. Their role includes:
Hedging: Protecting portfolios from adverse price movements (insurance against loss).
Speculation: Betting on price direction with limited capital.
Leverage: Controlling large positions with small investment.
Income Generation: Selling options to earn premium income.
Arbitrage: Exploiting price differences between markets or instruments.
Why Traders Use Options
Options serve different purposes:
Investors: Hedge portfolios (e.g., protective puts).
Traders: Speculate on price moves (buying calls/puts).
Institutions: Manage risk exposure across assets.
Market Makers: Provide liquidity and earn spreads.
Psychology of an Options Trader
Trading is not just numbers, it’s emotions.
Fear and greed drive bad decisions.
Over-leverage leads to blowing up accounts.
Patience and discipline are more important than intelligence.
A successful trader has a trading plan, risk management, and psychological control.

Part 4 Learn Institutional Trading Risks of Options Trading
Options can be powerful but come with risks:
Time Decay (Theta): Options lose value as expiry nears.
High Volatility: Premiums can fluctuate wildly.
Leverage Trap: While leverage amplifies profits, it also magnifies losses.
Unlimited Risk (for Sellers): If you sell options, your risk can be theoretically unlimited.
Complex Strategies: Advanced option strategies require deep knowledge.
How Options Work in Practice
Let’s take a step-by-step breakdown using a Nifty Call Option Example:
Nifty Spot: 20,000
You buy a Call Option with Strike = 20,000, Premium = 150, Expiry = 1 month.
Scenario A: Nifty goes to 20,500
Option intrinsic value = 500 (20,500 - 20,000)
Profit = 500 - 150 = 350 per unit × Lot size (say 50) = ₹17,500 profit.
Scenario B: Nifty falls to 19,800
Option expires worthless.
Loss = Premium × Lot size = ₹150 × 50 = ₹7,500 loss.
This shows both the leverage and limited risk nature of options.

Options vs Buying & Selling in TradingPart 1: Basics of Buying & Selling in Trading
1.1 How It Works
Buying (going long): The trader purchases an asset, expecting its price to rise. Profit comes from selling it later at a higher price.
Selling (going short): The trader sells an asset they don’t own (borrowing it from a broker), expecting its price to fall. Profit comes from buying it back later at a lower price.
Example:
If you buy 100 shares of Tata Steel at ₹120 and sell at ₹150, your profit = ₹30 × 100 = ₹3,000.
If you short 100 shares of Infosys at ₹1,500 and later buy them back at ₹1,400, your profit = ₹100 × 100 = ₹10,000.
1.2 Characteristics of Traditional Trading
Ownership: When you buy, you actually own the asset.
Unlimited upside, unlimited downside (in shorting): Long trades can theoretically go up infinitely, but short trades carry unlimited loss potential.
Capital intensive: You must pay the full value of the asset (unless using margin).
Time horizon: No expiry date; you can hold as long as you want.
1.3 Advantages
Simple and easy to understand.
Ownership benefits like dividends, voting rights in stocks.
No expiry pressure.
1.4 Risks
Large capital required.
Losses can be significant if the market goes against you.
Limited flexibility in terms of strategy.
Part 2: Basics of Options Trading
2.1 What Are Options?
Options are derivative contracts that derive value from an underlying asset (like stocks, indices, commodities, or currencies).
Call Option: Right to buy the asset at a fixed price (strike price).
Put Option: Right to sell the asset at a fixed price.
Options are rights, not obligations. The buyer of an option can choose whether to exercise it, while the seller (writer) is obligated to honor it.
2.2 Example of Options
Suppose Nifty is at 20,000.
You buy a Nifty 20,000 Call Option for a premium of ₹200.
If Nifty rises to 20,500 at expiry, the option’s value = 500. Profit = (500 – 200) = ₹300 per unit.
If Nifty falls to 19,500, you lose only the premium = ₹200.
2.3 Key Features
Leverage: Small premium controls a large value of the asset.
Limited risk for buyers: Maximum loss = premium paid.
Variety of strategies: Options allow profit from up, down, or sideways markets.
Time-bound: Every option has an expiry date.
2.4 Advantages
Cost-efficient way to take positions.
Hedging tool for managing risk.
Flexibility in designing strategies.
Defined risk when buying options.
2.5 Risks
For buyers: Premium decay (time value erosion).
For sellers: Potential unlimited losses.
Complexity compared to direct buying and selling.
Part 3: Options vs Buying/Selling – A Direct Comparison
Feature Traditional Buying/Selling Options Trading
Ownership Yes (when buying) No, it’s a contract
Capital Requirement High Low (premium only)
Leverage Limited (margin needed) Built-in leverage
Risk Unlimited (in shorting) Limited for buyers, unlimited for sellers
Profit Potential Unlimited upside (long) Defined, depending on strategy
Expiry None Always has expiry
Complexity Simple Complex
Uses Investing, long-term holding Hedging, speculation, income strategies
Part 4: Practical Use Cases
4.1 When to Use Traditional Buying & Selling
Long-term investing in stocks.
When you want ownership (e.g., dividends).
When you want simple exposure to price movements.
4.2 When to Use Options
Hedging: An investor holding a stock portfolio buys put options to protect against a fall.
Speculation: A trader buys calls when expecting a sharp rally.
Income generation: Selling options (like covered calls) to earn premiums.
Event trading: Using straddles/strangles during earnings announcements.
Part 5: Risk Management
5.1 In Buying/Selling
Use stop-loss orders.
Diversify portfolio.
Avoid over-leverage.
5.2 In Options
Stick to defined-risk strategies (like spreads).
Understand implied volatility.
Avoid naked option selling without capital cushion.
Part 6: Psychological Differences
Buying & Selling: Feels straightforward, intuitive. Less cognitive load.
Options: Requires strong understanding of Greeks (Delta, Gamma, Theta, Vega). Traders must accept probability-based outcomes.
Part 7: Real-Life Example Comparison
Imagine you expect Reliance to rise from ₹2,500 to ₹2,700.
Method 1 – Buying Shares:
Buy 100 shares @ ₹2,500 = ₹2,50,000 invested.
If price hits ₹2,700 → Profit = ₹20,000.
Risk: If it falls to ₹2,300 → Loss = ₹20,000.
Method 2 – Buying Call Option:
Buy Reliance 2,500 Call @ ₹50 premium = ₹5,000 invested.
If Reliance rises to ₹2,700, intrinsic value = ₹200. Profit = (200 – 50) × 100 = ₹15,000.
If Reliance falls to ₹2,300, loss = only premium ₹5,000.
Here, options gave higher percentage return with limited risk.
Part 8: Long-Term Perspective
Investors prefer buying & holding stocks, as they represent ownership in a growing business.
Traders often use options for short-term moves, hedging, and leverage.
Smart portfolios often combine both: owning core assets while using options for risk management.
Conclusion
Traditional buying and selling is like owning the road—it’s direct, long-term, and stable. Options are like renting a sports car for a specific race—cheaper, faster, but requiring skill and timing.
Neither is inherently better. It depends on:
Risk appetite
Capital available
Market view
Time horizon
Experience level
For beginners, direct buying and selling is a solid foundation. For advanced traders, options open new horizons of creativity and control.
AWL 1 Day View AWL (Adani Wilmar Ltd.) – 1 Day Chart Levels
Trend Context
The stock has been moving in a broad consolidation zone after strong moves earlier.
Price action is showing sideways to mildly bullish bias with demand zones holding well.
Momentum indicators on daily are stabilizing, showing potential for either a range breakout or continuation of sideways accumulation.
Key Daily Levels
Immediate Support Zone: ₹345 – ₹350
(volume accumulation + recent demand area)
Strong Support: ₹330
(swing low + psychological mark, breakdown here may extend downside)
Immediate Resistance: ₹370 – ₹375
(recent supply zone + rejection candles)
Major Resistance: ₹395 – ₹400
(big resistance cluster, breakout here may trigger trend continuation)
Positional Resistance: ₹420+
(if price sustains above 400, bullish momentum can extend to 420–440)
View
Above ₹375: Buyers may attempt a push toward ₹395–400.
Above ₹400 (sustained): Fresh momentum likely, targets ₹420–440.
Below ₹345: Weakness may drag price toward ₹330.
Below ₹330 (sustained): Larger downside risk opens up to ₹310–305.

Types of Financial InstrumentsIntroduction
Financial instruments are the lifeblood of the global financial system. They represent monetary contracts between parties and are used for various purposes such as raising capital, investing, trading, risk management, and hedging. Whether it’s a simple bank deposit, a government bond, or a complex derivative like a swap, financial instruments act as the medium through which money flows in the economy.
Broadly speaking, financial instruments can be classified into two major categories: cash instruments (whose value is directly determined by markets) and derivative instruments (whose value is derived from underlying assets such as stocks, commodities, or currencies). Within these categories exist several subtypes, ranging from equity shares and bonds to futures, options, and structured products.
In this article, we will examine financial instruments in detail, covering their types, features, roles, and global significance.
1. Meaning and Characteristics of Financial Instruments
A financial instrument can be defined as:
“A tradable asset, security, or contract that represents a legal agreement involving monetary value.”
Key characteristics include:
Monetary Value – Each instrument carries a certain value in terms of money.
Transferability – Most financial instruments can be traded between parties.
Liquidity – They vary in liquidity; shares of large companies are highly liquid, while structured products may be less so.
Risk and Return – They balance between safety and profitability.
Maturity – Some instruments (like equity shares) have no maturity, while others (like bonds) mature after a specific period.
2. Classification of Financial Instruments
Financial instruments can be classified into multiple categories depending on their structure and usage:
A. Based on Nature of Contract
Cash Instruments
Directly influenced by market conditions.
Examples: Deposits, loans, equity shares, bonds.
Derivative Instruments
Value derived from underlying assets.
Examples: Futures, options, forwards, swaps.
B. Based on Ownership
Equity-based Instruments – Ownership in a company (shares).
Debt-based Instruments – Borrowed funds to be repaid (bonds, debentures).
C. Based on Market
Primary Instruments – Issued directly by companies or governments to raise funds.
Secondary Instruments – Traded between investors on exchanges.
3. Cash Instruments
Cash instruments are the simplest and most common. They are valued directly by supply and demand in financial markets.
3.1 Equity Instruments (Shares)
Represent ownership in a company.
Two main types:
Common/Equity Shares: Provide ownership rights, voting power, and dividends.
Preference Shares: Fixed dividends, priority over common shareholders during liquidation, but usually no voting rights.
Importance:
Provide capital to businesses.
Allow investors to share profits and growth of companies.
3.2 Debt Instruments (Bonds & Debentures)
Debt instruments represent a loan given by the investor to an issuer (corporation or government).
Government Bonds – Considered risk-free, issued by sovereign entities.
Corporate Bonds – Issued by companies, carry credit risk.
Municipal Bonds – Issued by local governments.
Debentures – Unsecured bonds relying on issuer’s creditworthiness.
Key Features:
Fixed interest (coupon).
Redemption at maturity.
Credit rating plays a crucial role in pricing.
3.3 Money Market Instruments
Short-term financial instruments with high liquidity and low risk.
Examples:
Treasury Bills (T-Bills).
Commercial Papers (CPs).
Certificates of Deposit (CDs).
Repurchase Agreements (Repos).
3.4 Loans and Deposits
Bank Loans: Credit extended by banks with fixed repayment terms.
Fixed Deposits (FDs): Deposits made with banks for fixed tenure at agreed interest.
4. Derivative Instruments
Derivatives derive their value from an underlying asset such as stocks, indices, commodities, currencies, or interest rates. They are widely used for hedging, speculation, and arbitrage.
4.1 Forwards
Customized agreements between two parties to buy/sell an asset at a predetermined future date and price.
Traded over-the-counter (OTC).
High counterparty risk.
4.2 Futures
Standardized contracts traded on exchanges.
Obligates buyer/seller to transact underlying asset on a future date at a fixed price.
Common in commodities, currencies, and stock indices.
4.3 Options
Provide the right, but not obligation, to buy/sell an asset at a predetermined price.
Call Option: Right to buy.
Put Option: Right to sell.
Used for hedging and speculative trading.
4.4 Swaps
Contracts to exchange cash flows between two parties.
Types include:
Interest Rate Swaps – Fixed vs floating rate exchange.
Currency Swaps – Exchange of principal and interest in different currencies.
Commodity Swaps – Based on commodity price fluctuations.
5. Hybrid Instruments
These combine characteristics of debt and equity.
5.1 Convertible Bonds
Start as debt but can be converted into equity shares at later stages.
Attractive to investors seeking both safety and growth.
5.2 Preference Shares (with Debt Features)
Hybrid nature: act like equity but provide fixed returns like debt.
5.3 Warrants
Provide the right to buy company shares at a fixed price in future.
Often issued along with bonds to make them attractive.
6. Based on Risk and Return
Financial instruments also differ in terms of risk profile:
Low-risk instruments – Treasury bills, government bonds.
Moderate-risk instruments – Corporate bonds, preference shares.
High-risk instruments – Equity shares, derivatives, cryptocurrencies.
7. Structured and Alternative Financial Instruments
With globalization and financial innovation, new categories of instruments have emerged:
7.1 Structured Products
Custom-designed financial products combining derivatives with bonds or equities.
Example: Capital-protected notes.
7.2 Securitized Instruments
Pooling financial assets and selling them as securities.
Examples: Mortgage-backed securities (MBS), Asset-backed securities (ABS).
7.3 Alternative Assets
Hedge funds, private equity, venture capital.
Cryptocurrencies and digital tokens also fall under this category.
8. International Financial Instruments
Financial instruments also differ based on geography and cross-border usage:
Eurobonds – Bonds issued in currency different from the issuer’s home country.
Global Depository Receipts (GDRs) & American Depository Receipts (ADRs) – Allow companies to raise funds abroad.
Foreign Exchange Instruments – Spot, forwards, and swaps in currency markets.
9. Role of Financial Instruments in the Economy
Capital Formation – Companies raise funds through shares and bonds.
Liquidity Creation – Instruments can be traded in secondary markets.
Risk Management – Derivatives allow hedging against price fluctuations.
Efficient Resource Allocation – Savings flow into productive investments.
Global Integration – International instruments connect economies.
10. Regulatory Framework for Financial Instruments
Since financial instruments impact millions of investors, they are regulated by authorities:
India: SEBI (Securities and Exchange Board of India).
USA: SEC (Securities and Exchange Commission).
Global: IOSCO (International Organization of Securities Commissions).
Regulations cover disclosure norms, investor protection, insider trading, and systemic risk management.
11. Risks Associated with Financial Instruments
Market Risk – Fluctuations in prices.
Credit Risk – Default by borrower.
Liquidity Risk – Inability to sell asset quickly.
Operational Risk – Failures in systems or processes.
Regulatory Risk – Sudden changes in laws or policies.
12. Future of Financial Instruments
The landscape is evolving rapidly:
Digital Assets & Cryptocurrencies – Bitcoin, Ethereum, and tokenized securities.
Green Bonds & ESG-linked Instruments – Promoting sustainable finance.
Blockchain-based Smart Contracts – Transparent, decentralized trading.
Artificial Intelligence in Trading – Algorithm-driven financial products.
Conclusion
Financial instruments are at the core of global finance, enabling businesses, governments, and individuals to mobilize capital, invest, manage risks, and generate returns. From traditional cash instruments like bonds and shares to complex derivatives and innovative products like cryptocurrencies, they represent the dynamic evolution of money and markets.
Understanding the types, features, risks, and applications of these instruments is essential for investors, traders, policymakers, and anyone involved in the financial ecosystem. As global markets evolve, financial instruments will continue to adapt, reflecting technological progress and the changing needs of economies.