MTF Demand Confluence: High-RR Reversal SetupMulti Timeframe Supply & Demand Analysis
🕰️Yearly Timeframe
On the Yearly timeframe, price has already broken above a major supply zone, signaling strong higher‑timeframe bullish intent and possible long‑term accumulation by institutional players. Just above this breakout, price tapped into a previously tested yearly supply zone, from where it faced rejection and started to rotate lower, confirming active overhead supply.
This structure shows a classic “Break–into–higher supply” reaction, where long‑timeframe trend strength is present, but price is temporarily capped by remaining sell orders in the upper zone. A clean, sustained break above this upper yearly supply could unlock a fresh leg of long‑term upside.
📆 Half-Yearly Timeframe
On the Half-Yearly timeframe, price is currently approaching a strong demand zone — a critical level where significant buying pressure was previously observed. This prior bullish activity proved powerful enough to break through a previous Half-Yearly supply zone, clearly signaling the presence of institutional demand or major accumulation at this area. 💪
This HYTF demand confluence adds further conviction to the overall bullish structure, as it validates sustained buyer interest capable of overcoming historical supply barriers.
📉 Monthly Timeframe
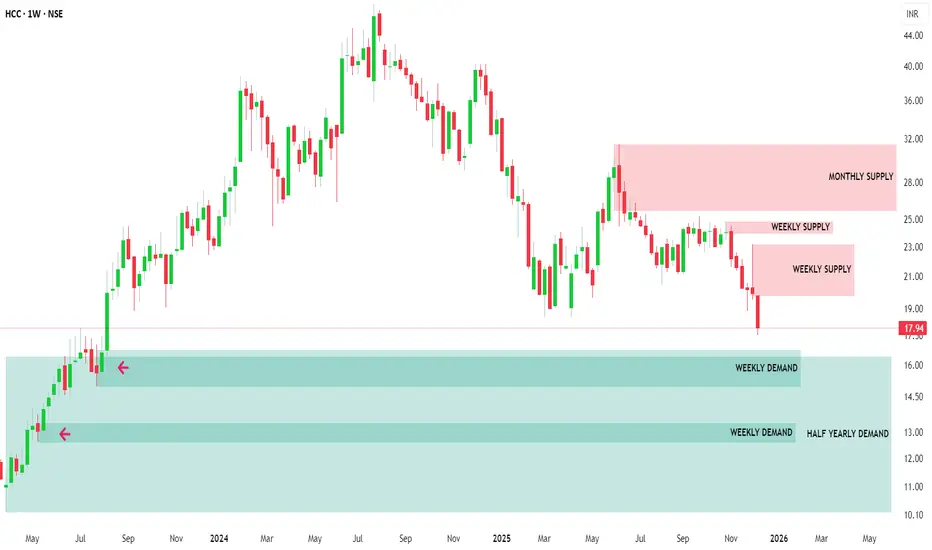
On the Monthly Timeframe, price first reacted downward from a Monthly Demand Zone (MDZ) that coincided with a Half‑Yearly Supply Zone (HYSZ), creating a strong confluence area where sellers stepped in aggressively. As price moved away, the nearest Supply Zone (SZ) was respected again, extending the selling leg and confirming short‑term bearish order‑flow.
Currently, price is approaching Monthly Demand Zone that overlaps with a Half‑Yearly Demand Zone (HYDZ), forming a powerful HTF demand confluence with high probability of bullish reversal. If buyers manage to defend this HYDZ–MDZ cluster, it can act as a strong platform for a new upside swing.
If selling pressure remains elevated and this primary MDZ fails, there is one more MDZ sitting near the bottom of the structure, which can serve as a secondary demand pocket where price may still reverse to the upside. Both these stacked demand zones offer attractive areas to watch for confirmation‑based long setups.
Weekly Timeframe Focus (Reversal Zones)
On the Weekly timeframe, there are four clearly defined reversal zones where price has a high probability of reacting due to visible supply‑demand imbalances and prior impulsive moves. These levels align well with the higher‑timeframe zones, making them high‑quality decision points.
Monitoring these four zones for clean price action signals such as strong rejection wicks, engulfing candles, or structure breaks can help time entries with precision while keeping risk tightly controlled. This multi‑timeframe stacking significantly increases the reliability of any confirmed reversal from these areas.
Conclusion: Long‑Term Investment View
Given the strong confluence of demand zones across Yearly, Half-Yearly, and lower timeframes, plus multiple well‑defined reversal levels on the Weekly chart, this stock is positioned for a potentially strong bullish reversal from current or slightly lower zones. Notably, after the reaction from this higher timeframe demand zone, there are no significant supply hurdles visible on higher timeframes, clearing the path for sustained upside momentum and substantially increasing the chances of higher returns.
From a long‑term investment perspective, the structure suggests a favorable reward‑to‑risk profile and scope for strong performance if price holds above the mapped HTF demand. If demand is confirmed and price starts building a higher‑low structure from these zones, this can evolve into a high‑conviction long‑term swing or investment candidate, supported by institutional‑grade demand footprints and multi‑timeframe alignment.
Trendalanalysis
BAJAJ FINANCE - 33% RETURNS!!!BUY - BAJAJ FINANCE LTD
CMP - Rs. 5649
Target - 1: Rs. 6880
Target - 2: Rs. 7689
.
.
Technicals - 1) Bullish Harmonic Pattern - Anti-Crab.
2) Targets set using Fibonacci Retracements.
.
.
Comment - The 2nd target will be achieved in the medium-term
.
.
Follow me for more!

gold today market hi guys
i hope all of us doing good ,quick update on gold h1 chart
bullish targets
1803 holding above next targets open on 1809,1811,1817,1819
1811 holding above next targets open on 1817, 1819
bearish targets
1809 holding below next next targets open on 1803
1800 holding below next target open on 1795

Triangle patternTriangle pattern - good opportunity, but wait for the volume confirmation and take advantage.

Nifty July last weekRange has extended to 15450- 16000. Any break of any of the mentioned price then only a trending move can be expected. Any support or resistance within this range is just meant to break and to create confusion in chart analysis. Somehow expectancy is little higher to cross 16000 as dow is almost touching all time high but wait for the break, do not trade directional before that.
If any bearishness is seen from 15900-16000 levels it can again come within the range of 15450-16000.
Trade as per the risk appetite, Spreads are much better to trade as risk is defined
Disclaimer - This post is for educational purpose only. Please consult your financial advisor before taking any position.
