Nifty spot 25320.65 by Daily Chart view - Weekly UpdateNifty spot 25320.65 by Daily Chart view - Weekly Update
- Support Zone 24775 to 25075 for Nifty Index
- Resistance Zone 25325 to 25625 for Nifty Index
- Nothing major Domestically except for the unwarranted Geo-Political scenario affecting our Stock Markets
Trendanalyisis

Cummins India cmp 3930.40 by Daily Chart viewCummins India cmp 3930.40 by Daily Chart view
- Support Zone 3885 to 3965 Price Band
- Resistance Zone 4165 to 4250 Price Band
- Support Zone reversal observed for stock price
- Volumes need to increase to push price on upside trend
- Price consolidation seen within 3885 to 4110 since mid Jan 2026

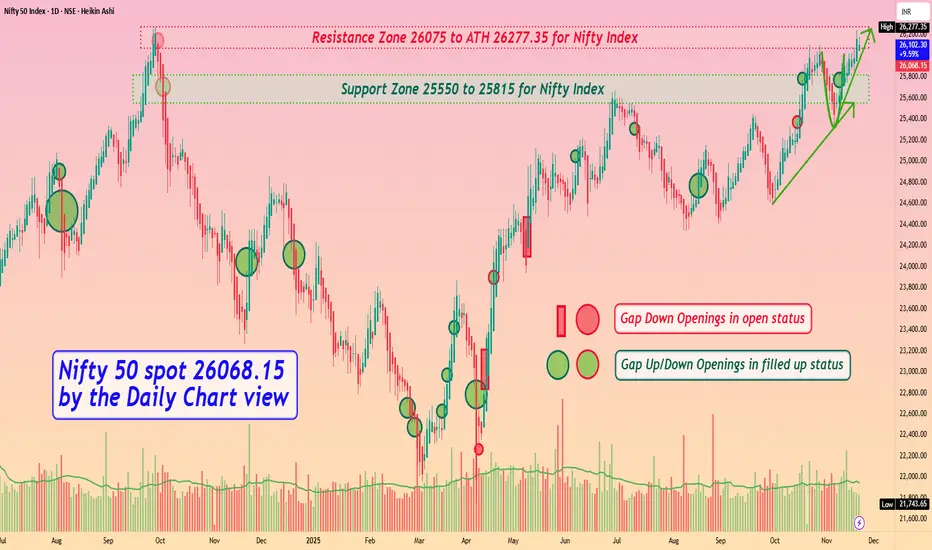
Nifty 50 spot 26068.15 by the Daily Chart view - Weekly updateNifty 50 spot 26068.15 by the Daily Chart view - Weekly update
- Support Zone 25550 to 25815 for Nifty Index
- Resistance Zone 26075 to ATH 26277.35 for Nifty Index
- Nifty keeping off to create ATH by Domestic and Geo Political events
- Bullish momentum intact but general Global paleness keeps New ATH distant
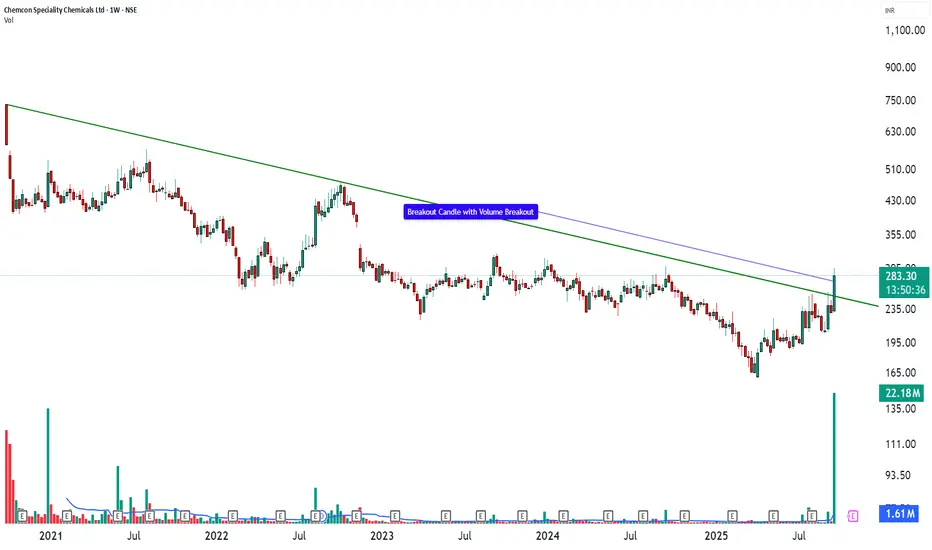
CHEMCON - Possible Breakout on Chart🧪 Chemcon Speciality Chemicals – Niche Player With a Big Opportunity
Chemcon Speciality Chemicals (CMP ~₹283) operates in a high-value niche of specialty chemicals, producing critical pharma intermediates such as HMDS and CMIC, along with bromide solutions for the oilfield sector. Being among the few Indian makers of these products, Chemcon enjoys a technical edge and import-substitution advantage.
📈 Fundamentals
Market Cap: ~₹1,038 Cr
P/E: ~40×
Book Value: ~₹137
Debt: Practically debt-free
ROE / ROCE: ~5% / ~7%
Recent Trend: Q1 FY26 revenue up ~18% YoY; net profit ~₹6.4 Cr.
🏭 Business View
Chemcon’s specialty products cater to global pharma and oilfield customers, giving it a wide demand base. A revival in pharma capex and rising domestic production of intermediates could drive steady orders. The company has announced capacity expansion plans and continues to broaden its export relationships.
💡 Technical Snapshot
Price action has been consolidating between ₹260–₹300, forming a base after earlier volatility. Sustained closes above ₹300 could open the path toward ₹340–₹360 as the next resistance zone, while ₹250 remains an important support.
🎯 Educational Trade Idea (for learning only)
A case-study plan could observe a hypothetical entry on a daily close above ₹300 with an illustrative stop around ₹265 and a learning target of ₹340–360.
This is not a recommendation, just an example of how one might structure a breakout setup.
🌟 Long-Term View
For Chemcon to become a serious compounder, management must deliver:
15–20%+ annual revenue growth,
stronger cash generation, and
ROE moving toward the mid-teens.
If those pieces fall into place, this niche specialty-chemicals player could create significant value.
⚠️ Disclosure & Disclaimer – Please Read Carefully
I/we have no financial interest or position in Hindustan Copper at the time of writing.
The information shared here is meant purely for learning and awareness. It is not a buy or sell recommendation and should not be taken as investment advice. I am not a SEBI-registered investment adviser, and all views expressed are based on personal study, chart patterns, and publicly available market data.
Trading—whether in stocks or options—carries risk. Markets can move unexpectedly, and losses can sometimes exceed the money you have invested. Past performance or past setups do not guarantee future results.
If you are a beginner, treat this as a guide to understand how the market works and practice on paper trades before risking real money. If you are experienced, always assess your own risk, position sizing, and strategy suitability before entering trades.
Consult a SEBI-registered financial adviser before making any real trading decision. By engaging with this content, you acknowledge full responsibility for your trades and investments.
💬 Found this useful?
🔼 Give this post a Boost to help more traders discover clean, structured learning.
✍️ Drop your thoughts, questions, or setups in the comments — let’s grow together!
🔁 Share with fellow traders and beginners to spread awareness.
👉 “If you liked this breakdown, follow for more clean, structured setups with discipline at the core.”
🚀 Stay Calm. Stay Clean. Trade With Patience.
Trade Smart | Learn Zones | Be Self-Reliant 📊
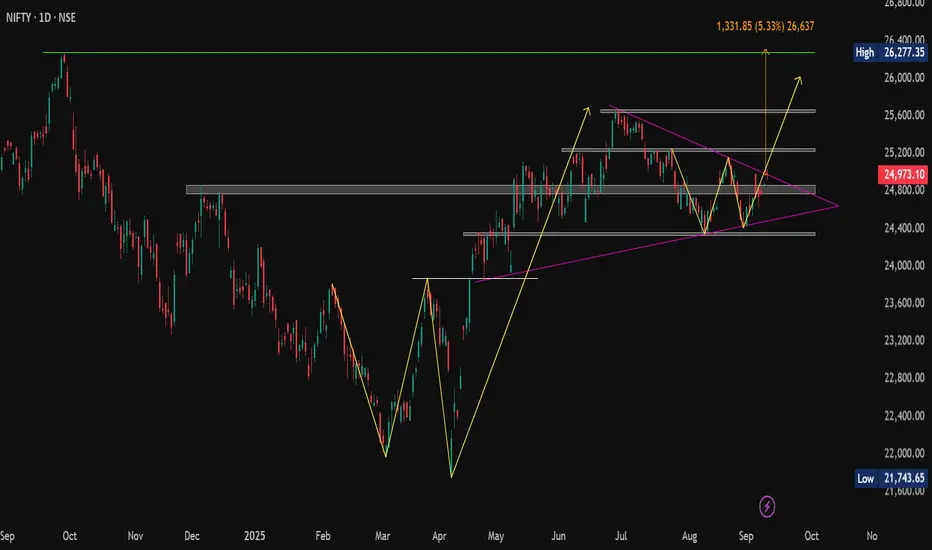
NIFTY: Ascending Triangle Breakout In PlayTechnical Outlook:
CMP: 24,973
📍 Immediate Support Zone: 24,858 – 24,768
📍 Strong Support Zone: 24,363 – 24,329
📍 Immediate Resistance Zone: 25,083 – 25,255 (Clustered zone)
📍 Strong Resistance Zones:
• 25,638 – 25,669
• 26,216 – 26,277 (All-Time High vicinity)
📈 Breakout Alerts:
✅ W-Pattern Breakout above 25,154 (Daily Candle Basis)
🎯 Target: 26,000
✅ Ascending Triangle Breakout above 24,972.50 ( Confirmed on Closing Basis today )
🎯 Target: 26,304 – aligning closely with the ATH of 26,277.35
Conclusion:
With two bullish patterns triggering nearly simultaneously, momentum is building. A sustained move above the immediate resistance cluster could fuel a rally towards uncharted territory.
Watch 25,154 and 25,255 – a clean move above could be the gateway to new all-time highs.
#BreakoutAlert | #TechnicalAnalysis | #ChartPatterns | #PriceAction
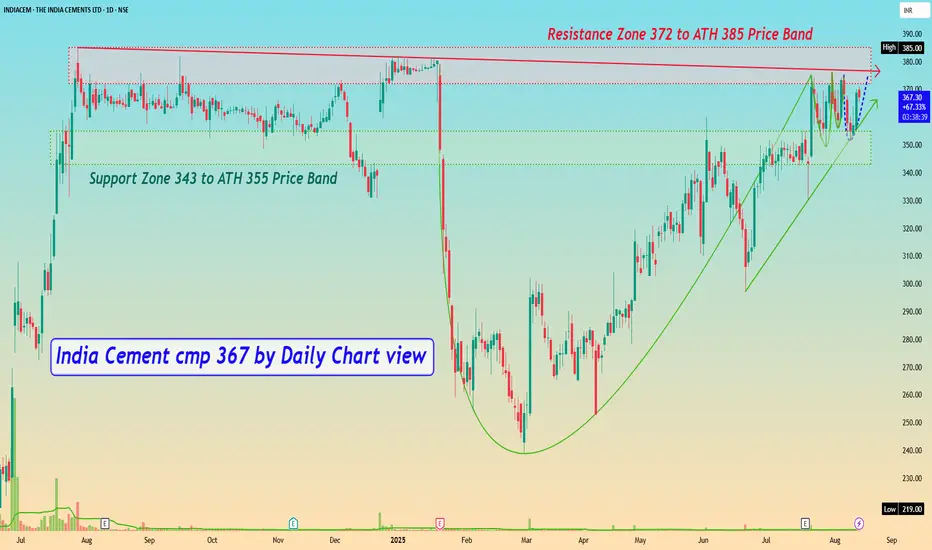
India Cement cmp 367 by Daily Chart viewIndia Cement cmp 367 by Daily Chart view
- Support Zone 343 to ATH 355 Price Band
- Resistance Zone 372 to ATH 385 Price Band
- Falling Resistance Trendline hurdle with Resistance Zone
- Bullish Cup and Handle pattern by the Resistance Zone neckline
- Rising Support Trendline seems well sustained by price momentum
- *Volumes steadily close to avg traded qty, need to increase for fresh breakout*
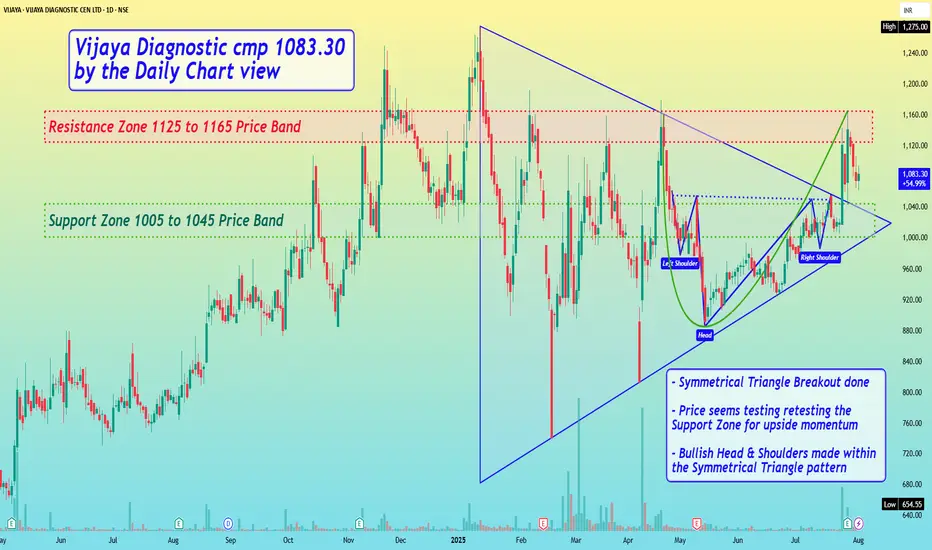
Vijaya Diagnostic cmp 1083.30 by the Daily Chart viewVijaya Diagnostic cmp 1083.30 by the Daily Chart view
- Support Zone 1005 to 1045 Price Band
- Resistance Zone 1125 to 1165 Price Band
- Symmetrical Triangle Breakout done
- Price seems testing retesting the Support Zone for upside momentum
- Bullish Head & Shoulders made within the Symmetrical Triangle pattern
- Bullish Rounding Bottom done over Head & Shoulders and again within Symmetrical Triangle pattern
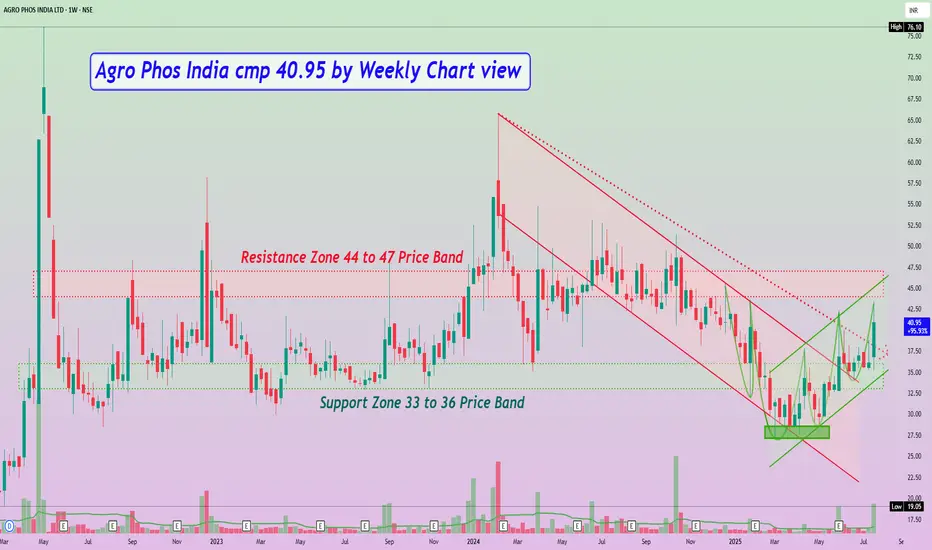
Agro Phos India cmp 40.95 by Weekly Chart viewAgro Phos India cmp 40.95 by Weekly Chart view
- Support Zone 33 to 36 Price Band
- Resistance Zone 44 to 47 Price Band
- Falling Price Channel Breakout has well sustained
- Falling Resistance Trendline Breakout too is maintained
- Bullish Double Bottom "W" by repeat Bullish Rounding Bottoms
- Rising Price Channel momentum steadily taking a gradual uptrend
- Volumes have surged heavily over the week above avg traded quantity
- Most common Technical Indicators BB, EMA, MACD, RSI, SAR seen turning positive
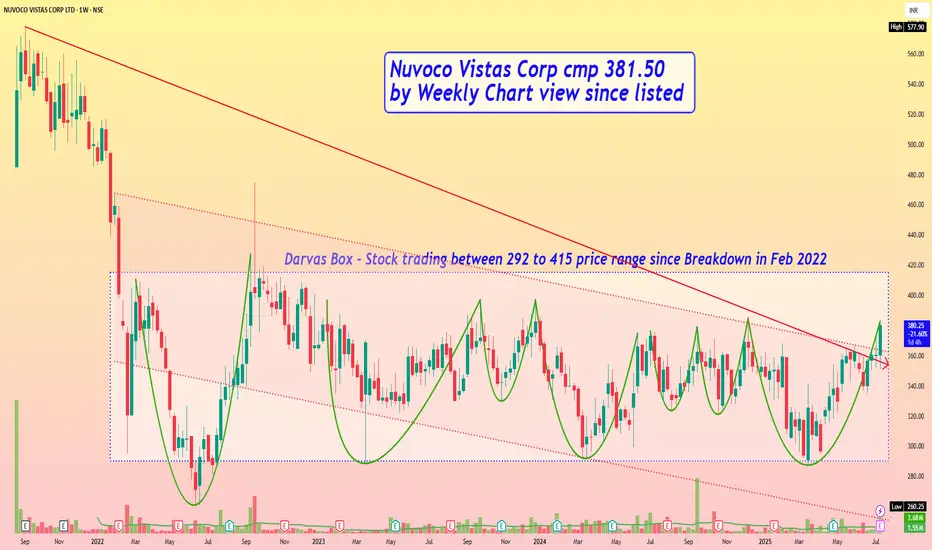
Nuvoco Vistas Corp cmp 381.50 by Weekly Chart view since listedNuvoco Vistas Corp cmp 381.50 by Weekly Chart view since listed
- Support Zone 335 to 355 Price Band
- Resistance Zone 395 to 415 Price Band
- Volumes generated over past few days based on expected good results outcome
- Darvas Box - Stock trading between 292 to 415 price range since Breakdown in Feb 2022
- Multiple Bullish Rounding Bottoms completed within Darvas Box indicative of probable breakout attempted
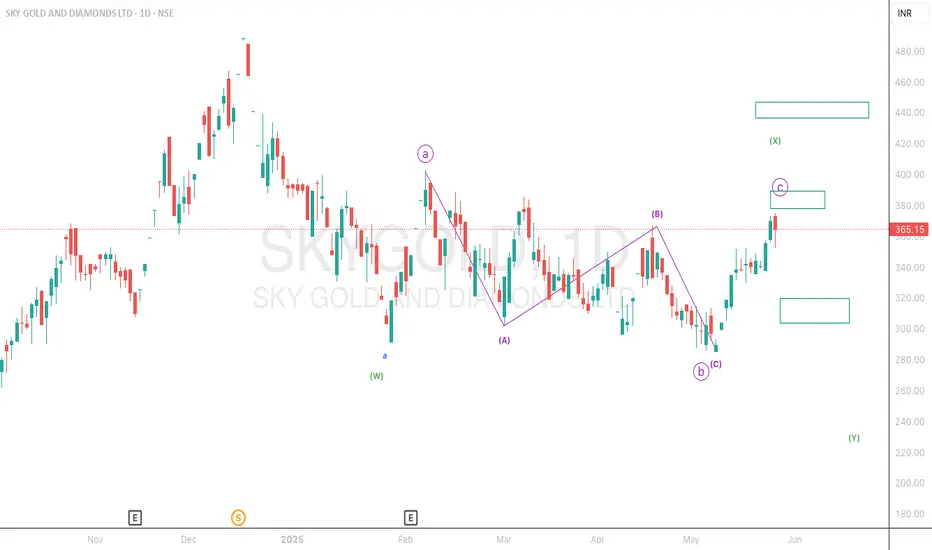
Too cloudy in sky gold and diamond..A consolidation phase is going on. as of now this script having correction or pullback value of 78.6% as its nature.
We need to wait and watch till the clouds disappear..
i am not a SEBI registered advisor. Before taking a trade do your own analysis or consult a financial advisor. I share chart for education purpose only. I share my trade setup.
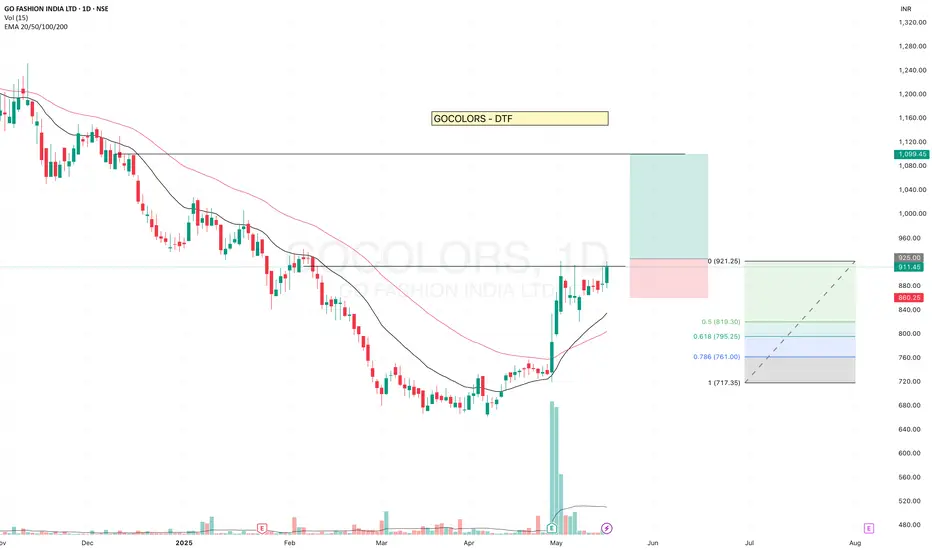
GOCOLORS - Getting ReadyGOCOLORS is getting ready and has been testing the resistance level.
- It is consistently trading above the 20 EMA. Recent high-volume candles suggest clear institutional participation. Although volume is currently drying up, the price is sustaining — a positive sign.
- The stock reversed after touching the 0.5 Fibonacci retracement level, indicating strength.
✅ If you like my analysis, please follow me as a token of appreciation :)
in.tradingview.com/u/SatpalS/
📌 For learning and educational purposes only, not a recommendation. Please consult your financial advisor before investing.
How to Trade Nifty Using Demand & Supply ZonesWhen markets move sharply up or down, many traders often wonder “Where should I enter?” or “Where might a reversal happen?” — That’s where Demand and Supply zones become your best trading friends. Let’s decode this chart and see how you can trade Nifty smartly using this powerful concept.
🔎 A Smart Trader's Guide to Spotting High-Probability Reversals
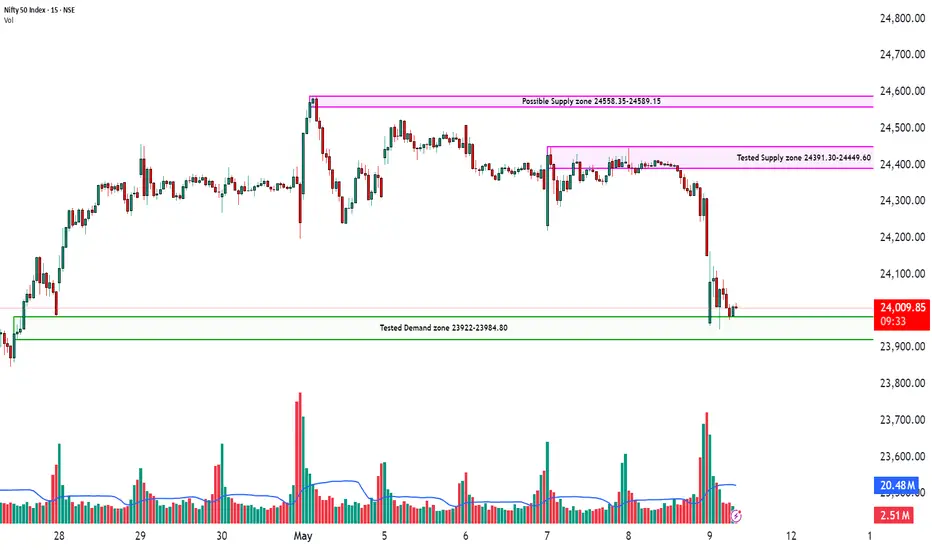
📍 Chart Timeframe: 15-Min | Index: Nifty 50
🖼️ Visuals Above: Key Demand & Supply Zones plotted with high-precision, backed by volume spikes and price rejection patterns.
🔍 What Are Demand & Supply Zones?
Think of demand and supply zones as institutional footprints.
Demand Zone = Where smart money is likely buying.
Supply Zone = Where smart money is likely selling.
These zones aren't random. They're created when large orders enter the market — and price reacts sharply. The idea is to follow where the "big boys" are placing their bets.
🧠 Why This Chart Matters:
In this Nifty 15-min chart, we’ve identified 3 key levels:
🟩 Tested Demand Zone: 23922 – 23984.80
This zone has already been tested and respected multiple times.
Price bounced cleanly from here again, showing active buying interest.
Volume confirms buyer presence — a sign that this zone still holds value.
🟥 Tested Supply Zone: 24391.30 – 24449.60
Sellers have defended this level previously.
It acted as a ceiling, pushing price back down.
If price returns here, be alert for shorting opportunities with bearish confirmation.
🟪 Possible Supply Zone (Untested): 24558.35 – 24589.15
This zone hasn’t been tested yet.
If price breaks above the first supply zone, this could be the next target or reversal point.
📈 How to Trade This Setup:
🟢 Long Trade Idea – Buy from Demand Zone
Entry: Near 23922–23984 (once price shows reversal candles or bullish volume)
Stop Loss: Just below 23922
Target: 24391–24449 (tested supply zone)
🔴 Short Trade Idea – Sell from Supply Zone
Entry: Near 24391–24449 (look for rejection wicks, volume drop)
Stop Loss: Slightly above 24449
Target: Demand zone near 23984
🔄 Breakout Opportunity
If price breaks above the tested supply zone with volume, watch for a quick move to the next supply zone near 24589.
Re-entry is possible on a retest of the broken zone.
🎯 Pro Trader Tip:
"Don’t chase price. Let it come to your zone. The highest probability trades happen when price enters a zone + confirms with volume."
⚠️ Disclaimer:
This analysis is for educational purposes only and does not constitute any investment advice or stock recommendation. Please consult with your financial advisor before taking any trading decisions. This post complies with SEBI regulations and is intended to promote financial literacy.
🗣️ Let's Discuss:
✅ Are you using supply & demand in your trading?
✅ Want help identifying zones on your favorite stocks?
👇 Drop your charts or questions in the comments — let’s grow together!
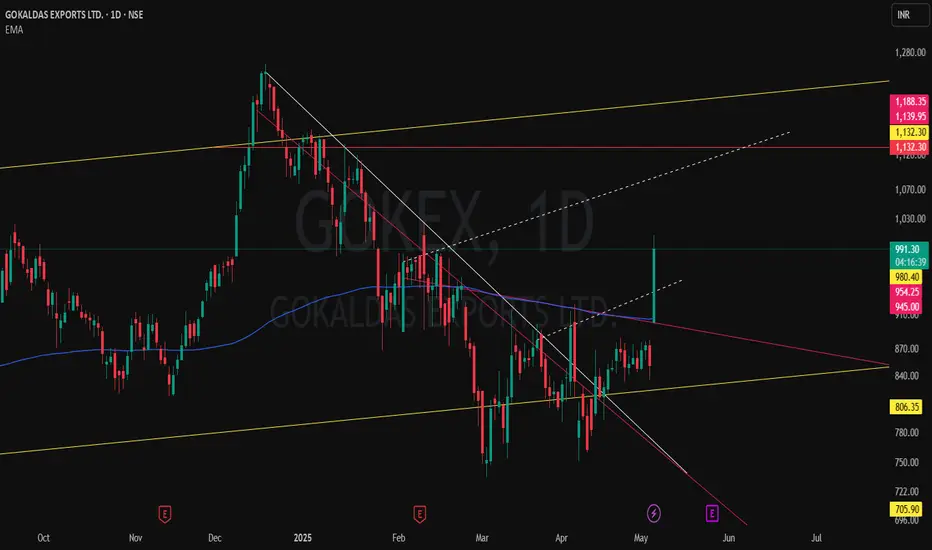
Massive Breakout Loading? GOKEX Smashes Through Triple TimeframeGOKALDAS EXPORTS LTD (GOKEX) is showing serious strength with a powerful breakout candle currently in play – but the real story is the multi-timeframe technical alignment:
📏 MTF Structure
Yellow Parallel Channel from Monthly shows a long-term structure still intact.
Red Horizontal Resistance marks the previous MTF peak – now under threat.
🔻 WTF Pressure
Pink Counter-Trendlines acted as significant resistance on the Weekly – both pierced.
⚡ DTF Precision
White CT Line (Daily) finally broken with conviction.
Dotted White Lines reveal multiple hidden resistances — all cleanly taken out by today's surge.
📊 Volume & Candle Strength
Volume spiking, price up over 16% intraday — just waiting on confirmation at close.
🧠 Watch Closely: A close above today’s highs could flip this into a full-blown A+ breakout setup.
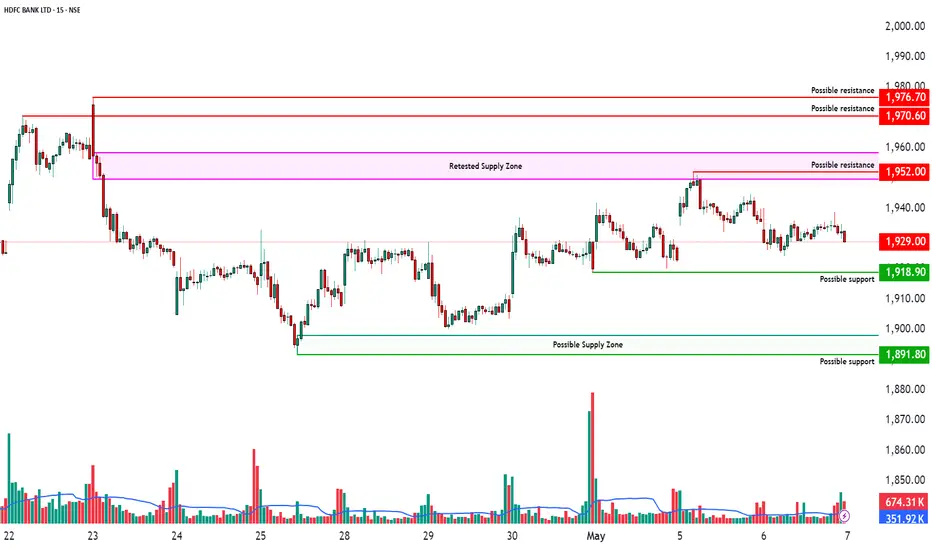
Range-Bound Between Key Supply & Demand Zones🏦 HDFC Bank Ltd – Range-Bound Between Key Supply & Demand Zones 📊
Timeframe: 15-Minute | Exchange: NSE | Date: May 6, 2025
CMP: 1,929.00
🔴 Retested Supply Zone: 1949.60 - 1958.40
This zone previously acted as resistance after a sharp fall.
Price revisited the zone but was rejected, indicating potential selling pressure.
A breakout above this level could trigger bullish continuation.
🟢 Possible Demand Zone: 1898 - 1891.80
Price rebounded from this zone earlier, showing possible accumulation by buyers.
Not confirmed yet with multiple tests, but worth watching for potential support.
Breakdown below this may open the door to further downside.
📌 Current Price Action
HDFC Bank is currently consolidating between these two zones.
No clear trend yet; price is oscillating sideways.
Volume is decreasing, indicating lack of momentum in either direction.
📈 Levels to Watch
Breakout Zone: 1,959+
Breakdown Zone: 1,890-
🔍 Observational Bias
Bearish Bias: If price revisits 1949.60 - 1958.40 zone and shows rejection, potential short setups may emerge.
Bullish Bias: If price retests 1898 - 1891.80 with bullish confirmation, long trades may be considered.
Reliance - Price action channel + Candlestick + RSIKey Observations from the Chart
Channel Structure -
Both resistance and support lines have been tested multiple times with precise reactions
The most recent price action shows a strong rejection at the lower channel boundary
Candlestick Formation-
This month printed a textbook strong lower wick rejection candle:
Long lower wick indicates buyers aggressively stepping in at support
RSI Confluence-
The RSI tells a compelling complementary story:
Recently retested COVID-era levels (historic oversold territory)
Has since established higher highs and higher lows (bullish structure)
Shows positive divergence with price (RSI making HHs while price tests support)

Gold Hits Another Record II U.S. Tariff Plan II Daily Analysis🔥 Fundamental Analysis :
⚡Gold rose to $3,164 per ounce, a new record high as risk aversion increased following President Trump's tariff announcement.
⚡Trump outlined a 10% baseline tariff on imports from all countries, with higher rates for nations with trade surpluses, including China (34%), the EU (20%), and Japan (24%), and a 25% tariff on foreign-made automobiles.
⚡ All eyes are on the U.S. non-farm payrolls report, due Friday, for further clues on the Federal Reserve's monetary policy path.
Technical Analysis:
1. New All-Time High:
The price reached 3,168 USD, marking a new all-time high.
However, the price has slightly retraced after hitting this level.
2. Fibonacci Levels:
• 1st Fib Level: 3,183 USD – Potential resistance.
• 2nd Fib Level: 3,206 USD – Further resistance if the bullish momentum continues.
3. Support & Resistance Zones:
• Green Zone (~3,135 - 3,138 USD): Previously a resistance, now acting as support.
• Another support near 3,124 USD.
• Resistance Levels:
• 3,168 USD: (All-time high) – If broken, could push the price towards the Fibonacci targets.
4. Moving Averages:
• Red Line (Likely 50 EMA): Trending upwards, supporting price action.
• Blue Line (Likely 200 EMA): Positioned lower, indicating that the trend remains bullish as long as price stays above.
5. Trend Analysis:
• Bullish Breakout: The price broke out of a previous range and surged to a new high.
• Potential Retest: Price might revisit the 3,135 - 3,138 support zone before another leg up.
Trading Considerations:
• Bullish Case: If price consolidates above 3,135-3,138, it could retest 3,168 and move towards 3,183 or 3,206.
• Bearish Case: A break below 3,135 could push price back towards 3,124 or lower.
• Risk Management: Place stop losses below key support zones if entering long positions.
👉 Always follow TP/SL to protect your capital and maximize profits!
Stay tuned for updates once the confirmations are in place!
Please support me with your likes and comments to motivate me to share more analysis with you and share your opinion about the possible trend of this chart with me !
📢Best Regards , Silver Wolf Traders Community
Disclaimer: This is for educational purposes only.
Always trade responsibly and manage your risk effectively

GOLD - BULLISH STRUCTURE INTACT II Trump's tariff plansFundamental Key points:
⚡Gold hangs near record high on safe-haven flows
⚡Currency market muted ahead of reciprocal tariffs
⚡Investors brace for Trump's levies
🔎 Technical Analysis:
Key Observations:
1. Market Structure:
o The price is in an uptrend overall, following a parallel channel (1H chart).
o Short-term retracement after testing a resistance level (~$3,138 - $3,149).
2. Support & Resistance Levels:
o Resistance Levels (Sell Zone):
$3,138.87 → Previous high/resistance.
$3,149.05 → Major resistance, potential reversal zone.
o Support Levels (Buy Zone):
$3,122.61 - $3,114.86 (Order Block - OB) → Strong demand zone.
$3,100.93 → Strong support level, potential bounce area.
$3,065.23 - $3,058.33 → Major support on the 1H chart.
3. POI (Point of Interest) Level:
o The price is currently at the POI level (~$3,130-$3,132), which is acting as a temporary resistance.
4. Moving Averages & Trend Confirmation:
o 50 EMA (Red Line) on 1H chart is acting as support (~$3,114).
o 200 EMA (Blue Line) below, confirming a strong bullish trend.
________________________________________
Trade Plan:
🔹 Buy (Long) Setups:
1. Entry Zone:
o $3,122 - $3,114 (OB Zone)
o $3,100 - $3,110 (Major Support)
o $3,065 - $3,058 (Strong Support, 1H Chart)
2. ⭐ Confirmation:
o Price showing bullish rejection at support levels.
o 50 EMA Holding Support
3.🎯Target:
🎯TP1: $3,138
🎯TP2: $3,149
4. ❌Stop Loss (SL):
o Below $3,100 (to avoid deeper pullback risks).
________________________________________
🔹 Sell (Short) Setups:
1. ✔Entry Zone:
o $3,138 - $3,149 (Major Resistance Zone)
o If price struggles to break above $3,138 and shows reversal patterns, it’s a potential short.
2. 📌Confirmation:
o Rejection wicks at resistance
o Break below POI Level ($3,130)
3. Target:🎯
🎯 TP1: $3,122
🎯 TP2: $3,114
4. Stop Loss (SL):
o Above $3,150 (to avoid fake breakouts).
________________________________________
📢 Conclusion:
• Bullish Bias: Until price breaks below $3,114.
• Ideal Buy Zone: $3,122 - $3,114
• Sell Only Near Resistance: $3,138 - $3,149

GUJARAT FLUOROCHEM Swing TradeOn weekly time frame, a liquidity pool was formed and sellers got trapped two times in GUJARAT FLUOROCHEM forming a double bottom, which can fuel a good potential up move.
Also it has recently grabbed liquidity from previous day low so if Nifty holds above 23400 then there are good chances of GUJARAT FLUOROCHEM to reach T1 which will be a 1:4 RR trade.

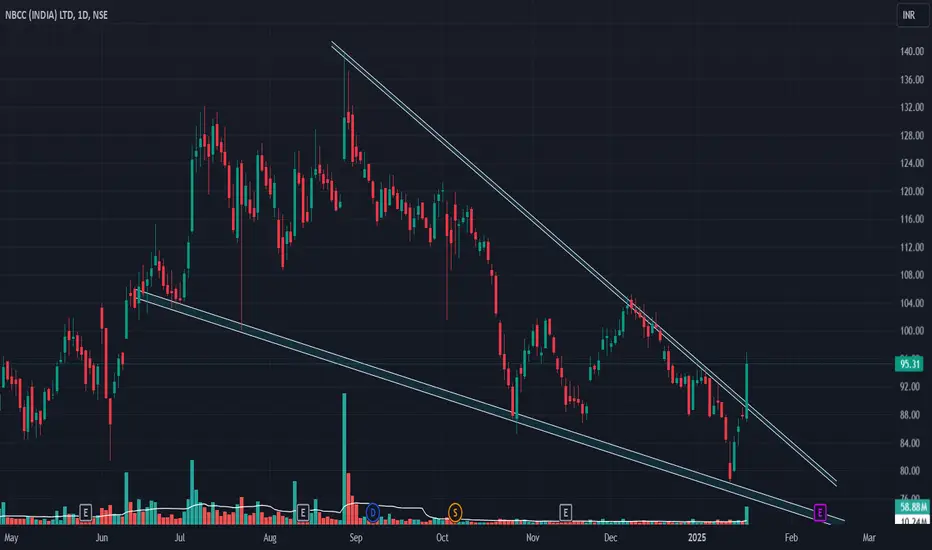
NBCC INDIADisclaimer : Trade at your own risk this is not buy - sell recommendation, I'm not sebi registered.
NBCC looks very bullish on daily, weekly and monthly charts keep on radar.
Analysis of Moving average stock (22/Nov/2024)Analysis of Moving average stock (22/Nov/2024)
follow for more updates and information

Analysis of intraday,intraweek Moving average stocks 19/Nov/2024Analysis of intraday, intraweek Moving average stocks 19/Nov/2024
follow us for more updates information.
WELCOME TO ARROWINDEX
We're dedicated to providing you the best of Finance stock market , with a focus on dependability and Investment. We're working to turn our passion for Finance stock market into a booming online.We analyze Live Market and try to Provide learning information Content. All the Live Market views and charts .We hope you enjoy our Finance stock market as much as we enjoy offering them to you.Support and offering
Effective online education modules for all segments of traders
Customized portfolio tracker Online research & trading guidance
Entry and Exit support for:-
Intraday trading,Swing trading,Scalping,Position trading
Future & Delivery trading
Technical analysis
Fundamentals analysis
Fii & Dii data and reports

Crude Oil Chart Pattern for 15 Oct 2024Crude faces heavy selling after breaking support as predicted in my last idea and same for the cuurent scenario again it comes to crucial level of support may be we can see minor pullback to zone of 72.300 to 600 and then selling of more than 2.5 to 3% ,let's see how its going to move today.

INDRAMEDCO - Bullish Flag PatternINDRAMEDCO - Has shown a Bullish Flag pattern in the Daily time frame - This shows strength in the stock and also means potential upside in the near future.
The company has a fantastic history and fundamentally has very attractive numbers, not only this is a good entry point for swing traders but also a good stock to hold for a long term.
Note: These views are personal and for informative/ educational purpose only. Please conduct your own research before making any investment decision.
