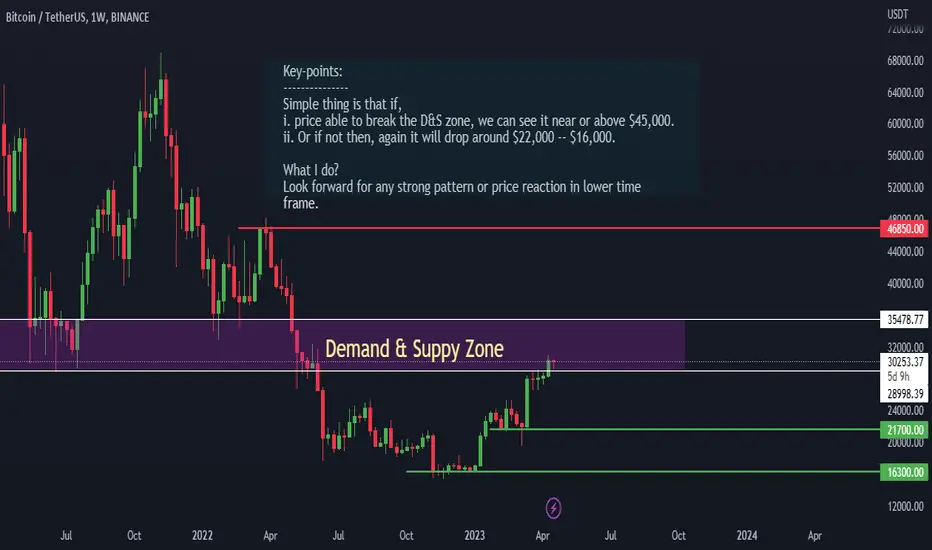
A Comprehensive Analysis of Bitcoin Future Price MovementAll the key points, aspects, and probabilities are clearly mentioned on the Chart. Kindly do your own research before entering.
THANK YOU
Trendanalyisis
NFL - 50% RETURNS!!!BUY - NFL
CMP - Rs. 86
Target - 1: Rs. 108
Target - 2: Rs. 130
.
.
Technicals -
1) Price-Volume analysis supported by the cup and handle chart pattern breakout.
.
.
Fundamentals -
1) Financial Performance:
In the fiscal year 2020-21, National Fertilizers Limited reported a consolidated net profit of INR 1,288 crore, an increase of 123% compared to the previous fiscal year. The company's revenue increased by 16.44% to INR 11,118 crore in the same fiscal year. National Fertilizers Limited has a current market capitalization of approximately INR 6,462.44 crore.
2) Future Prospects:
The Indian fertilizer industry is expected to grow in the coming years, driven by increasing demand from the agriculture sector. National Fertilizers Limited is well-positioned to take advantage of this growth, given its strong market presence and reputation in the industry. The company has also been investing in capacity expansion and modernization to stay competitive.
.
.
Follow me for more!

GM BREWERIES - 70% RETURNS!!!BUY - GM BREWERIES
CMP - Rs. 599
Target - 1: Rs. 810
Target - 2: Rs. 1020
.
.
Technicals -
1) Bullish Flag BO, supported with high volumes.
2) Historical trend ranging from August' 15 to May' 18 resembles the current trend, indicating a bullish continuation.
.
.
Fundamentals -
GM Breweries Limited (NSE:GMBREW) is an Indian company engaged in the manufacture and sale of alcoholic beverages, including country liquor, Indian-made foreign liquor (IMFL), and bulk alcohol. The company operates primarily in the state of Maharashtra, India, and has a market capitalization of around INR 5,570 crores (as of April 12, 2023).
1) Financial Performance:
In terms of financial performance, GM Breweries has been steadily growing its revenue over the past few years. In FY2022, the company's net revenue from operations was INR 1,229.38 crores, up from INR 925.59 crores in FY2021, which represents a growth rate of 33%. The company's net profit for FY2022 was INR 180.72 crores, up from INR 130.13 crores in FY2021, representing a growth rate of 39%. The company's profit margins have also been improving over the past few years.
2) Valuation:
In terms of valuation, GM Breweries has a price-to-earnings (P/E) ratio of around 13.27x (as of April 12, 2023), which is below the industry average of around 23.27x. This suggests that the stock may be undervalued relative to its peers. The company's price-to-book (P/B) ratio is around 4.15x, which is also below the industry average of around 6.68x.
.
.
This is just a view, please invest at your own risk.
.
.
Follow me for more!

BANKNIFY TO 48000!!!Bullish Flag BO in BANKNIFTY indicating further upside.
.
Targets have been set using Fibonacci Retracements, with respect to the flag pole as highlighted on the chart.
.
Refer to the chart for more details.
.
This is just a view, please trade at your own risk.
.
Follow me for more!

EXIDE INDS - 42% RETURNS!!!BUY - EXIDE INDUSTRIES
CMP - Rs. 183
Target - 1: Rs. 212
Target - 2: Rs. 260
.
.
Technical -
1) Double Bottom Pattern (before breakout).
2) Bullish Flag Breakout
3) Targets have been set using previous swing highs and Gann Fan.
.
.
Fundamentals -
1) The automobile batteries manufacturer has bought 24.80 lakh equity shares in Ulric Renewables, at a price of Rs 80 per share, amounting to Rs 19.84 crore. With this investment, its shareholding in Ulric Renewables stands at 39.08%.
2) Strong annual EPS growth.
3) Growth in Quarterly net profit with increasing profit margin (YoY).
4) PE = 3.39 < SECTOR PE = 5.30
5) FII holding has risen by 1.33% in December 2022.
6) DII holding has risen by 1.7% QoQ.
.
.
This opinion is for educational purposes. I am not SEBI registered and this is not an investment advice.
As with any trade, always look first, then leap.

GODREJCP - 35% RETURNS!!!BUY - GODREJ CONSUMER PRODUCTS
CMP - Rs. 967
Target - 1: Rs. 1066
Target - 2: Rs. 1132
Target - 3: Rs. 1312
.
.
Technicals - Ascending Triangle Breakout
.
.
Follow me for more!

ROYAL ORCHID HOTEL - 40% RETURNS!!!BUY - ROYAL ORCHID HOTEL
CMP - Rs. 269
Target - 1: Rs. 305
Target - 2: Rs. 380
.
.
Technicals - Bullish Symmetrical Triangle Pattern
.
.
Follow me for more!


RELAXO FOOTWEARS - 50% RETURNS!!!BUY - RELAXO FOOTWEARS
CMP - Rs. 850
Target - 1: Rs. 1178
Target - 2: Rs. 1293
.
.
Technicals - 1) Bullish Harmonic Pattern.
2) Targets set using Fibonacci Retracement and Gann Angles.
.
.
Follow me for more!

DCB BANK - 33% RETRURNS!!!BUY - DCB BANK LTD
CMP - Rs. 106
Target - 1: Rs. 119
Target - 2: Rs. 127
Target - 3: Rs. 140
.
.
Technicals - 1) Bullish Gartley Harmonic Pattern.
2) Targets set using Fibonacci Retracement.
.
.
Follow me for more!

INDUS TOWERS - 100% RETURNS!!!BUY - INDUS TOWERS LTD
CMP - Rs. 142
Target - 1: Rs. 211
Target - 2: Rs. 254
Target - 3: Rs. 285
.
.
Technicals - 1) Bullish Shark Harmonic Pattern indicating upward momentum.
2) Potential targets or take profit points have been highlighted using Fibonacci Retracement.
3) The stock is at support.
.
.
Follow me for more!

KSL - 45% RETURNS!!!BUY - KALYANI STEELS LTD
CMP - Rs. 292
Target - 1: Rs. 241
Target - 2: Rs. 161
.
.
Technicals - 1) Bearish Harmonic Pattern.
2) Targets set using Fibonacci Retracements.
.
.
Follow me for more!

BHARAT FORGE - 35% RETURNS!!!BUY - BHARAT FORGE
CMP - Rs. 750
Target - 1: Rs. 813
Target - 2: Rs. 881
Target - 3: Rs. 1019
.
.
.
Technicals - 1) Bullish Crab Harmonic Pattern.
2) Targets set using Fibonacci Retracements.
.
.
Follow me for more!

SUZLON ENERGY - 65% RETURNS!!!BUY - SUZLON ENERGY LTD
CMP - Rs. 7
Target - 1: Rs. 9
Target - 2: Rs. 10.65
Target - 3: Rs. 11.65
.
.
.
Technicals - 1) Bullish Bat Harmonic Pattern.
2) Targets set using Fibonacci Retracements.
.
.
Comment: Target - 3 will be achieved in 4-8 months.
.
.
Follow me for more!

VIP INDUSTRIES - 33% RETURNSBUY - VIP INDUSTRIES
CMP - Rs. 575
Target - 1: Rs. 664
Target - 2: Rs. 720
Target - 3: Rs. 760
.
.
.
Technicals - 1) Bullish Navarro 200 Harmonic Pattern
2) Targets set using Fibonacci Retracements
.
.
Follow me for more!

BOSCH - MORE TO THAN MEETS THE EYE???Short Position - BOSCH LTD
CMP - Rs. 18113
Target - 1: Rs. 17292
Target - 2: Rs. 15206
.
.
Technicals - Bearish Harmonic Pattern
.
Follow me for more!

BANKNIFTY ANALYSIS FOR 15th MARCH 2023#BankNifty #Analysis For 15th March 2023
As per our analysis for #BankNifty , we are expecting these below levels today in the upside and downside, kindly check the charts on #15min #timeframe and act accordingly.
#Previous Close: 39411. 40
#Buyers can be active above: 39492
#IntradayLevels : 39570-80 / 39665-75 / 39761-71 / 39865-75/ 39988-40000
#Sellers can be active below: 39331
#IntradayLevels : 39242-50 / 39133-125 / 39021-12 / 38901 - 915 / 38815 - 800
Disclaimer: All the provided levels are for #educational purpose only, please do your own analysis before doing any trade in the live market or consult your financial advisor before act.
Follow Us On For More Updates in Future.
If, you have any questions or queries, please post in comments. (click on boost button below so that these levels will reach to maximum number of users on TradingView)
#TrendAnalysis #ChartPatterns #TechnicalIndicators #chartpatternstrading #trendanalysisexplained #beyondtechnicalanalysis #tradeanalysis #BANKNIFTY #Intradayanalysis #bankniftycharts #15min #opportunity

#USDJPY Analysis #trend ,#Momentum,#volume pricerelation #HFHiii
dear TV
I ovserve a momentum shift in the USDJPY towards for uptrend ,
Tools i used
COCEPTS
☆ FIrst i USED Higher time Frame Analysis beacuse It dominate on lower Timeframes . All MARKER always Follows HTF
☆ I plot curve line as max wick touch with vol relation. for increase accuracy
☆ Monthly trend indicator line rule
.if price crossedup it will go UpTrend
crosseddown go DownTREND
☆ I changed vol color so we see where market maker order placed on chart
as i explain earlier marker maker buy at lower price and sell at higher ,
eg when price going lower they buy with heavy postion slowly which causes spikes in volume and price i maked on the chart .
known as wick or liquidity traped points
☆ momentum line shows shift in the Trend momentum
☆ curve drawing line for capturing exact momentum line
I used HA chart for showing momentum !
Thanks

Sell #BTC around 20900, SL 21070 & Target of 20450Sell #BTC around 20900, SL 21070 & Target of 20450, you can adjust to trailing SL every 100 or 150 point downside

Banknifty analysis for 12 Jan 2023uy above 42340 - Target would be 42530 and 42680 SL 42075
Sell below 42030 - Target would be 41875 and 41690 SL-42280
This time i have given with SL also. But you can have your SL with your money management.
Disclaimer: Iam not a SEBI registered and not a tip provider and this chart is not indented to take trade in my levels, It is shared here for educational purpose only. Trading in this levels are all your own risk.

Crisil weekly trend analysisCrisil weekly trend analysis.
> Falling wedge breakout
> 7 months downtrend break on weekly timeframe. (From may 2022)
> Size of the pattern is 890 rs.
> Forming an Inverted H&S Which is bullish pattern.
> Entry break and trade above 3100.
> Potential targets 3223,3424,3626,3840.
> keep will be 7-10% below entry price.
> position size : 10-20% of the trading capital.
> max risk : 1-2% of trading capital.
> time : 1-6 months.
> Happy swing/positional trading.
Note: only for educational purpose, trade at your own risk.

National Aluminum, NALCO (Long)NALCO for long-term.
Stock near 52WK low in price bound range (67-81) since June 22.
Fundamentals: Good
Technical: Cup formation
Target: 81/88/98
Resistance: 67
If held for more than 1 year, then a target of 111 also possible.
Remark: Growth + Dividend Stock

today gold market hi guys
i hope all of us doing good ,past several weeks we are traveling with swing market its gives successful ratio on chart analysis before you started review on it, our chart simple and clear but its helps lot of it ,quick update on gold m15 chart
bullish targets
1803 holding above next targets open on 1809,1811,1817,1819
1811 holding above next targets open on 1817, 1819
1822 holding above next targets open on 1824,1828
bearish targets
1824 holding below next targets open on 1822,1819,1817,1811,1809
1819 holding below next targets open on 1817,1811
1809 holding below next next targets open on 1803
