Axis Bank | Gann Square of 9 Intraday Study (Normal Case)Disclaimer:
This analysis is for educational purposes only. I am not a SEBI-registered advisor. This is not financial advice.
Symbol: AXISBANK (NSE)
Date Observed: 13 November 2024
Time Frame: 15-Minute Chart
This post documents a historical intraday observation using the Gann Square of 9, focusing on how normal price movement capacity interacts with time to highlight potential reaction zones.
📊 Initial Market Structure
Axis Bank showed upward momentum from the first 15-minute candle.
The low of the opening candle (~1148) was treated as the 0-degree reference level, following standard Square of 9 practice.
This reference point acts as the base for mapping the day’s expected upward vibration.
Correct identification of the 0-degree is essential for meaningful Square of 9 observations.
🔢 Gann Square of 9 Level Mapping
Based on Square of 9 calculations:
0 Degree: ~1148
45 Degree (Observed Normal Capacity): ~1165
In intraday studies, the 45-degree level often represents a stock’s normal price expansion range under regular market conditions.
⏱️ Price & Time Interaction (Observed Behavior)
Price reached the 45-degree level early in the session (around the second 15-minute candle).
Completion of the normal price capacity well before the later part of the trading day has historically shown temporary price pressure.
After interacting with this zone, the market displayed rejection behavior and short-term downside expansion.
This reflects a commonly observed Gann principle:
Early completion of expected price capacity can increase the probability of a reaction.
📘 Key Educational Takeaways
Square of 9 helps define logical intraday price limits
Normal (45-degree) reactions occur more frequently than rare cases
Combining price structure with time context improves clarity
The method supports rule-based observation, not prediction
Small variations around levels are part of normal market behavior
📌 Shared purely for educational and historical chart-study purposes.
#AxisBank #GannSquareOf9 #WDGann #IntradayAnalysis #MarketEducation #TechnicalAnalysis #PriceTime
Trendanalyse

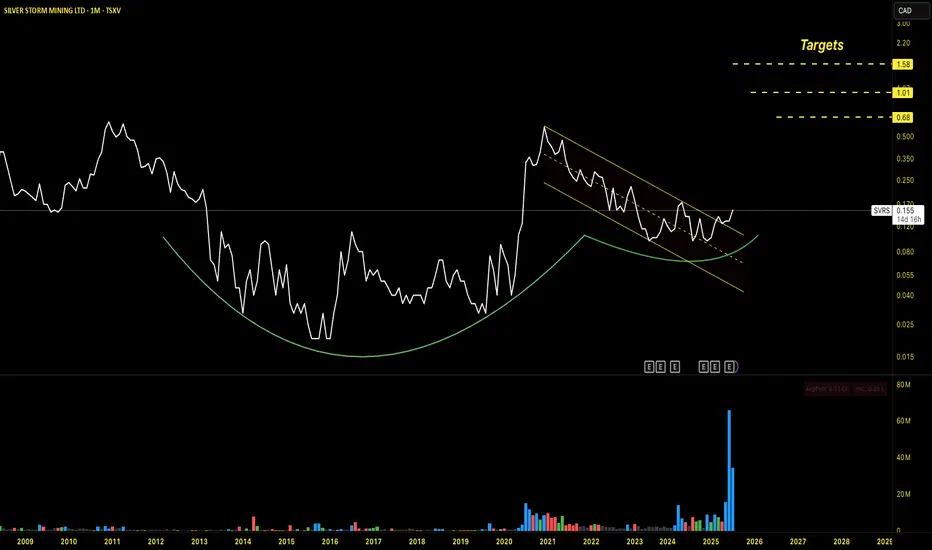
$SVRS forming a multi year cup and handle breakoutTSXV:SVRS is a compelling setup, nearly 8 years of consolidation (cup phase) followed by an impulse movement in 2020, and again 5 year long time correction handle pattern. This is a solid setup which we don't find often. What i like is the volume buildup near the handle phase, which is a clear institutional smart money surge.
I am buying here, and clearly this is not a short term trade. My downside risk is capped at 30%.
Essential Guide to Support and Resistance 1️⃣ The Importance of Support and Resistance in the Highly Volatile Crypto Market
- The cryptocurrency market operates 24/7/365 and shows significantly higher volatility than traditional financial markets. This volatility creates exceptional profit opportunities but also triggers intense fear and greed, placing substantial psychological pressure on traders.
- Support and resistance act as critical reference points within this chaos, highlighting areas where price is likely to react. Beyond technical analysis, they reflect the collective psychology of traders. Understanding them is essential for long-term success in crypto trading.
2️⃣ The Nature of Support and Resistance and Their Psychological Foundation
Support and resistance form where buying and selling pressures clash strongly enough to slow down or halt price movement.
Support:
At this level, buyers perceive the asset as “cheap enough” and are willing to enter, forming a psychological and structural barrier against further decline. Traders previously stuck in losing positions may sell at breakeven, adding layered reactions around these levels.
Resistance:
At this level, sellers believe the asset is “expensive enough” and reduce exposure, while trapped traders near the top may sell with a “better late than never” mentality, limiting further upward movement.
※ The Meaning of Breakouts and Fakeouts
- When support breaks, active buyers may panic and trigger stop-loss selling. Conversely, breaking resistance often invites aggressive buyers, accelerating the trend.
- However, many breakouts turn into fakeouts, designed to exploit trader psychology. Avoid jumping in too early without confirmation.
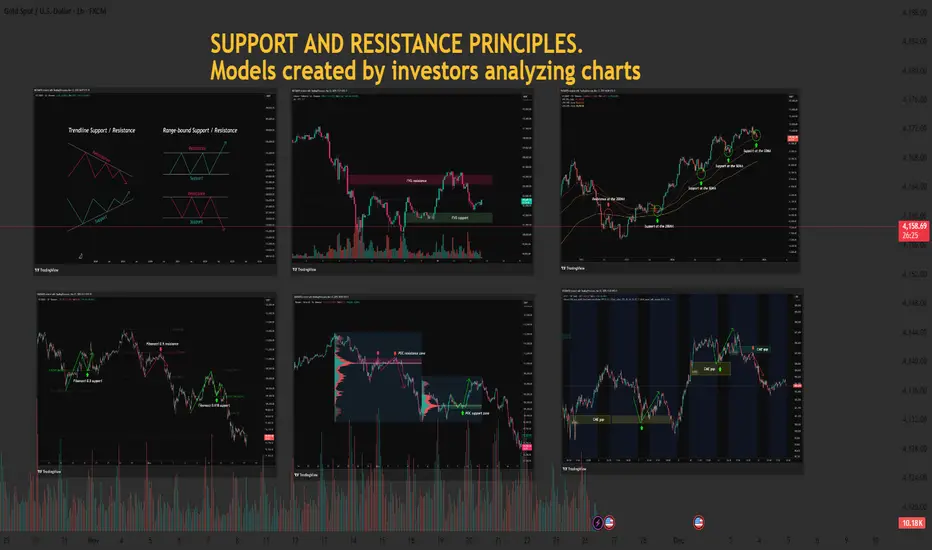
3️⃣ Key Support and Resistance Models Explained
📈 Trendlines & Accumulation Zones: Market Structure and Trader Expectations
- Trendlines visually represent collective expectations of future price direction.
- Touching an uptrend line triggers “buy the dip” psychology.
- Touching a downtrend line reinforces the belief that price “cannot move higher.”
- Accumulation Boxes mark areas where buying and selling pressures stabilize. Traders plan around these zones, driven by the mindset of “waiting for the breakout” to catch meaningful moves.
drive.google.com
📈 FVG (Fair Value Gap): Market Inefficiency & Smart Money Footprints
An FVG forms when price moves too quickly through a zone, leaving an unfilled “price gap.” These gaps often represent sudden activity from Smart Money (institutions, whales).
Gap Filling:
Markets naturally avoid leaving inefficiencies unresolved. When price returns to an FVG, the entities responsible for the original move may adjust or reopen positions, creating support or resistance.
Newer traders can observe FVGs as footprints of Smart Money and plan reactions accordingly.
drive.google.com
📈 Moving Averages (MA): Collective Sentiment & Trend Direction
MAs reflect the average price the market perceives over time. Because MAs are widely monitored, they naturally form psychological support and resistance.
Short-term MA (e.g., 50MA): Tracks short-term sentiment.
Price below → worry about trend weakening.
Price above → renewed optimism.
Long-term MA (e.g., 200MA): Represents long-term sentiment.
Price below 200MA → fear of prolonged downtrend.
Price above 200MA → hope for sustained bullishness.
When acting as support/resistance, MAs reflect strong collective agreement.
drive.google.com
📈 POC (Point of Control) – Volume Profile: Market Consensus & Volume Strength
POC is the price level with the highest trading volume within a given range — the market’s strongest consensus level.
Price below POC:
POC becomes strong resistance.
Buyers stuck in losing positions may sell at breakeven, strengthening resistance.
Price above POC:
POC turns into solid support.
Buyers believe price should not fall below this level.
POC often reflects the market’s “expected value” and the area where loss-aversion psychology is strongest.
drive.google.com
📈 Fibonacci: Natural Order & Human Expectations
- Fibonacci retracement applies golden ratio mathematics to charts, reflecting where traders expect reversals and forming support/resistance.
- These levels work not by magic but because many traders plan trades around them — collective behavior creates real reactions.
- Levels like 0.5 and 0.618 carry psychological significance, often seen as optimal buying or selling opportunities.
drive.google.com
📈 CME Gap: Institutional Movement & Mean Reversion Behavior
CME gaps occur in Bitcoin futures due to institutional trading hours. When spot price moves over the weekend while futures are closed, gaps form.
Gap Filling:
These gaps represent time periods without institutional activity, encouraging the market to “normalize” abnormal price areas.
Traders commonly expect gaps to be filled eventually, turning them into potential support/resistance zones.
drive.google.com
4️⃣ Managing Trading Psychology Through Support and Resistance
Even the best tools are useless without psychological discipline.
Confirmation Bias & Stop-Loss Discipline
- Ignoring losses due to selective perception leads to failure.
- When support breaks, accept the invalidation and exit decisively.
Overbought/Oversold Psychology & FOMO
- Avoid chasing price upward out of fear of missing out.
- In crashes, resist panic-selling at the bottom.
- Rely on your structured support/resistance rules.
Scaling Into Trades
- Avoid buying everything at one support level—or selling everything at one resistance level.
- Scaling entries across multiple levels increases psychological stability and reduces the impact of misjudgment.
5️⃣ Building a Complete Strategy & Practical Application Tips
Confluence Creates Strongest Levels
When multiple support/resistance signals overlap
(e.g., Fibonacci 0.618 + 200MA + POC + FVG),
these zones become significantly stronger because they reflect collective trader agreement.
Volume Confirms Support/Resistance Strength
High volume validates a level's importance.
A reliable breakout requires strong volume, showing clear market participation and intent.
Develop Your Own Trading Plan
Do not follow every model blindly.
Choose indicators and methods that fit your style, and create clear trading rules.
Discipline with your own system leads to psychological stability and long-term success.
Don’t forget to like and share your thoughts in the comments! ❤️
Gold XAUUSD Trading Strategy on July 17, 2025:
Yesterday's trading session was as we expected when the gold price adjusted from the 334x area, however, the gold price did not approach 3300 as we expected for a long-term trading point.
Basic news: News that President Trump considered firing FED Chairman Jerome Powell caused the USD to plummet, gold prices to skyrocket and stocks to fall. The US PPI and core PPI last month both recorded a 0% increase, lower than the forecast of 0.2% and the previous period's level of 0.1%. Data showed that inflationary pressure from the manufacturing side continued to cool down.
Technical analysis: After adjusting from the 334x area and approaching the nearest bottom of 3320, the gold price immediately increased sharply. RSI on the H1, H4 and D1 time frames crossed the average line, showing a renewed uptrend. Currently, the higher bottom pattern is compressing at the 3320 - 3357 border. If the price breaks this compression zone, it will fluctuate very strongly.
Important price zones today: 3325 - 3330, 3352 - 3357 and 3300 - 3305.
Today's trading trend: BUY.
Recommended orders:
Plan 1: BUY XAUUSD zone 3325 - 3327
SL 3322
TP 3330 - 3340 - 3360 - 3380.
Plan 2: BUY XAUUSD zone 3300 - 3302
SL 3297
TP 3305 - 3315 - 3335 - 3360.
Plan 3: SELL XAUUSD zone 3355 - 3357
SL 3360
TP 3352 - 3342 - 3332 - 3322.
Wish you a safe, successful and profitable trading day.🌟🌟🌟🌟🌟

ioc is getting bearishioc is at the supply zone the price will go lower because the price is respected the supply zone

CybertechIncorporated in 1995, CyberTech Systems and Software Ltd provides Information Technology and Software Development Services to customers primarily in USA.
Making a Cup and Handle pattern.
Market Cap: ₹ 623 Cr.
Promoter holding: 36.4 %
FII holding: 0.01 %
DII holding: 0.00 %
Public holding: 63.6 %
Looks good to buy on dip.

#NIFTY Intraday Support and Resistance Levels -05/08/2024Nifty will be gap down opening in today's session. After opening nifty start trading Below 24450 level and then possible downside rally up to 24330 in today's session. in case nifty trades Above 24500 level then the upside target can go up to the 24620 level.

[INTRADAY] #BANKNIFTY PE & CE Levels(05/08/2024) Today will be gap down opening in BANKNIFTY. After opening if banknifty start trading below 50950 level then possible downside rally of 400-500 points upto 50550 Level & this rally can can extend another 400 points if market gives breakdown 50450 level in todays session.Any Major upside only expected in case banknifty starts trading above 50550 level.

#NIFTY Intraday Support and Resistance Levels -31/07/2024Nifty will be gap up opening in today's session. After opening nifty sustain above 24860 level and then possible upside rally up to 24980 level in today's session. in case nifty trades below 24810 level then the downside target can go up to the 24690 level.

Descending Broadening Wedge pattern breakout in GNFCGUJARAT NARMADA VALLEY FERTILISERS & CHEMICALS
Key highlights: 💡⚡
✅On 1 Hour Time Frame Stock Showing Breakout of Descending Broadening Wedge Pattern.
✅Strong Bullish Candlestick Form on this timeframe.
✅It can give movement up to the Breakout target of 736+.
✅Can Go Long in this Stock by placing a stop loss below 684-.

#NIFTY Intraday Support and Resistance Levels -29/07/2024Nifty will be gap up opening in today's session. After opening nifty sustain above 24890 level and then possible upside rally up to 25010 level in today's session. in case nifty trades below 24830 level then the downside target can go up to the 24710 level.

Rising Wedge pattern breakout in METROPOLISMETROPOLIS HEALTHCARE LTD
Key highlights: 💡⚡
✅On 1 Day Time Frame Stock Showing Breakout of Rising Wedge Pattern.
✅Strong Bullish Candlestick Form on this timeframe.
✅It can give movement up to the Breakout target of 2410+.
✅Can Go Long in this Stock by placing a stop loss below 2034-.

#NIFTY Intraday Support and Resistance Levels -24/07/2024Nifty will be gap down opening in today's session. After opening nifty start trading Below 24450 level and then possible downside rally up to 24330 in today's session. in case nifty trades Above 24500 level then the upside target can go up to the 24620 level.

#NIFTY Intraday Support and Resistance Levels -23/07/2024Nifty will be gap up opening in today's session. After opening nifty sustain above 24550 level and then possible upside rally up to 24670 level in today's session. in case nifty trades below 24480 level then the downside target can go up to the 24360 level.

Double Bottom pattern breakout in AUBANKAU SMALL FINANCE BANK LTD
Key highlights: 💡⚡
✅On 1 Hour Time Frame Stock Showing Breakout of Double Bottom Pattern.
✅Strong Bullish Candlestick Form on this timeframe.
✅It can give movement up to the Breakout target of 670+.
✅Can Go Long in this Stock by placing a stop loss below 640-.

Descending Triangle pattern breakout in BALKRISINDBALKRISHNA INDUSTRIES LTD
Key highlights: 💡⚡
✅On 1 Hour Time Frame Stock Showing Breakout of Descending Triangle Pattern.
✅Strong Bullish Candlestick Form on this timeframe.
✅It can give movement up to the Breakout target of 3305+.
✅Can Go Long in this Stock by placing a stop loss below 3134-.

[INTRADAY] #BANKNIFTY PE & CE Levels(22/07/2024) Today will be gap down opening in BANKNIFTY. After opening if banknifty start trading below 52450 level then possible downside rally of 400-500 points upto 52050 Level & this rally can can extend another 400 points if market gives breakdown 51950 level in todays session.Any Major upside only expected in case banknifty starts trading above 52550 level.

[INTRADAY] #BANKNIFTY PE & CE Levels(19/07/2024) Today will be gap up opening in BANKNIFTY. After opening if banknifty sustain above 52550 level then possible upside rally of 400-500 points upto 52950 level & this rally can extend another 400 points if market gives breakout 53050 level in todays session. Any Major downside only expected in case banknifty starts trading below 52450 level.

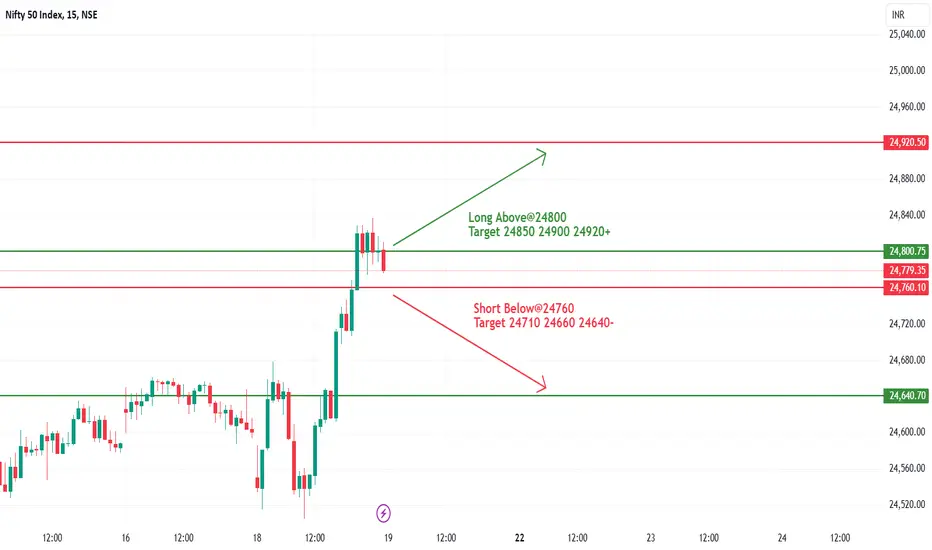
#NIFTY Intraday Support and Resistance Levels -19/07/2024Nifty will be gap up opening in today's session. After opening nifty sustain above 24800 level and then possible upside rally up to 24920 level in today's session. in case nifty trades below 24760 level then the downside target can go up to the 24640 level.
[INTRADAY] #BANKNIFTY PE & CE Levels(18/07/2024) Today will be gap up opening in BANKNIFTY. After opening if banknifty sustain above 52550 level then possible upside rally of 400-500 points upto 52950 level in todays session. Any Major downside only expected in case banknifty starts trading below 52450 level & this rally can extend another 400 points if market gives breakdown in 51950 level.

Symmetrical Triangle Pattern breakdown in RELIANCERELIANCE INDUSTRIES LTD
Key highlights: 💡⚡
✅On 1 Hour Time Frame Stock Showing Breakdown of Symmetrical Triangle Pattern .
✅Strong bearish Candlestick Form on this timeframe.
✅It can give movement up to the Breakdown target of 3064-.
✅Can Go short in this stock by placing a stop loss above 3196+.

Ascending Triangle pattern breakout in NAVINFLUORNAVIN FLUORIN INTERNATIONAL LTD
Key highlights: 💡⚡
✅On 1 Hour Time Frame Stock Showing Breakout of Ascending Triangle Pattern.
✅Strong Bullish Candlestick Form on this timeframe.
✅It can give movement up to the Breakout target of 3885+.
✅Can Go Long in this Stock by placing a stop loss below 3673-.

#NIFTY Intraday Support and Resistance Levels -16/07/2024Nifty will be gap up opening in today's session. After opening nifty sustain above 24600 level and then possible upside rally up to 24720 level in today's session. in case nifty trades below 24570 level then the downside target can go up to the 24450 level.
