CCL Products cmp 970.50 by Daily Chart viewCCL Products cmp 970.50 by Daily Chart view
- Support Zone 890 to 930 Price Band
- Resistance Zone 970 to 1015 Price Band
- Volumes in close sync with avg traded qty
- Rising Price Channel seem been well sustained
- Descending Triangle pattern breakout anticipated
- Technical Indicator trending positively thru Jan 2026
Trendanalysiss

Madras Fertilizers cmp 80.25 by Daily Chart viewMadras Fertilizers cmp 80.25 by Daily Chart view
- Support Zone 76.25 to 79.25 Price Band
- Resistance Zone 83.50 to 87.50 Price Band
- Bullish *W* upwards inclined by the Resistance Zone neckline
- Falling Resistance Trendlines, 1st Breakout done, next coming soon
- Volumes spiked heavily last week Thursday by demand based buying

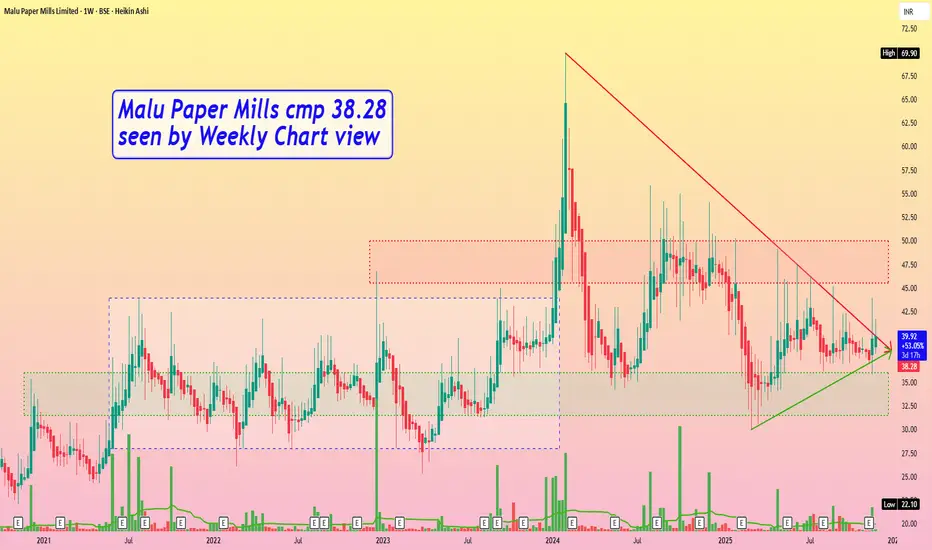
Malu Paper Mills cmp 38.28 by Weekly Chart viewMalu Paper Mills cmp 38.28 by Weekly Chart view
- Support Zone 31.50 to 36 Price Band
- Resistance Zone 45.50 to 50 Price Band
- Darvas Box Strategy Breakout done in Jan 2024
- Volumes spiking regularly over the past few weeks
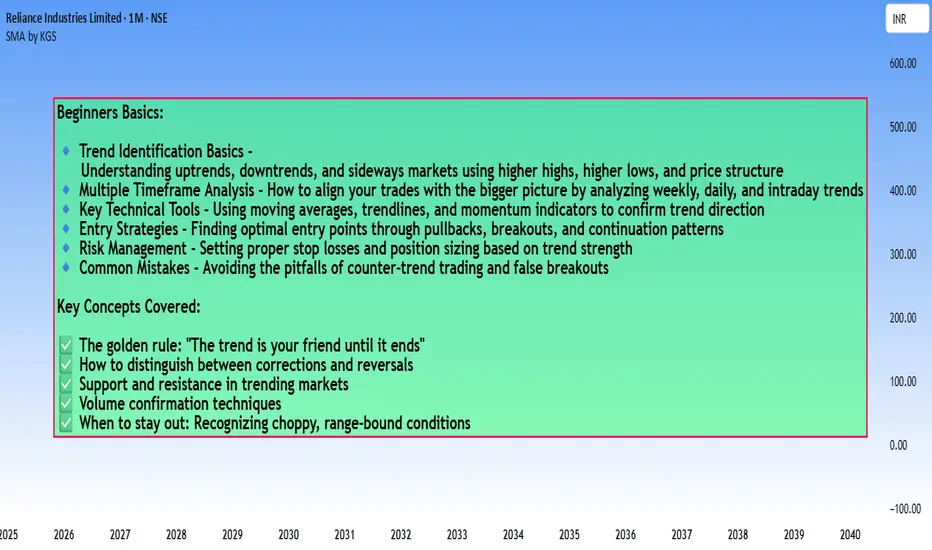
How to trade in the Right Trend - Beginners guide
How to Identify a Trend in a Chart?
Here's a practical breakdown of trend identification methods:
1. Price Structure Method (Most Fundamental)
Uptrend:
- Series of Higher Highs (HH) and Higher Lows (HL)
- Each peak is higher than the previous peak
- Each trough is higher than the previous trough
Downtrend:
- Series of Lower Highs (LH) and Lower Lows (LL)
- Each peak is lower than the previous peak
- Each trough is lower than the previous trough
Sideways/Range:
- Price oscillates between horizontal support and resistance
- No clear higher highs/lows or lower highs/lows
2. Moving Averages
Simple Rules:
- Price consistently above MA = Uptrend
- Price consistently below MA = Downtrend
- Price crossing back and forth = No clear trend
Popular MAs:
- 20 EMA (short-term)
- 50 SMA (medium-term)
- 200 SMA (long-term)
Golden Cross/Death Cross:
- 50 MA crosses above 200 MA = Bullish trend signal
- 50 MA crosses below 200 MA = Bearish trend signal
3. Trendline Method
Drawing Trendlines:
- Uptrend: Connect at least 2 higher lows with a straight line
- Downtrend: Connect at least 2 lower highs with a straight line
- The more touches, the stronger the trendline
- Price respecting the trendline confirms trend strength
4. Multi-Timeframe Analysis
The Complete Picture:
- Weekly chart: Overall market direction
- Daily chart: Intermediate trend
- 4H/1H chart: Entry timing
Rule: Always trade in the direction of the higher timeframe trend
#5. Indicators for Confirmation
ADX (Average Directional Index):
- Above 25 = Strong trend
- Below 20 = Weak/no trend
- Doesn't show direction, only strength
MACD:
- Histogram above zero = Uptrend
- Histogram below zero = Downtrend
- Crossovers signal potential trend changes
RSI:
- Consistently above 50 = Uptrend
- Consistently below 50 = Downtrend
6. Volume Confirmation
Healthy Trends Show:
- Rising volume on moves in trend direction
- Declining volume on corrections/pullbacks
- Volume spikes at breakout points
Quick Checklist for Trend Identification:
✅ Strong Uptrend:
- Higher highs and higher lows
- Price above rising moving averages
- Valid upward trendline intact
- ADX above 25
- Increasing volume on rallies
✅ Strong Downtrend:
- Lower highs and lower lows
- Price below falling moving averages
- Valid downward trendline intact
- ADX above 25
- Increasing volume on declines
⚠️ No Clear Trend (Stay Out):
- Choppy price action
- MAs flat or intertwined
- ADX below 20
- Price between support/resistance
Common Beginner Mistakes:
❌ Looking at only one timeframe
❌ Ignoring the bigger picture
❌ Trading every small wiggle as a "trend"
❌ Not waiting for confirmation
❌ Confusing corrections with reversals
Pro Tips:
💡 **The 3-Touch Rule:** A trend becomes more reliable after price respects a trendline at least 3 times
💡 **Trend is Your Timeframe:** What's an uptrend on daily might be a pullback on weekly
💡 **When in Doubt, Zoom Out:** Higher timeframes show the true direction
💡 **Trade WITH the trend, not against it:** Counter-trend trades have lower probability
**Remember:** Trend identification isn't about being perfect - it's about being on the right side of the market more often than not. Start with the basics (higher highs/lows), then add confirmation tools as you gain experience.
More updates with examples and Explanation on individual topics in a easy way to understand.
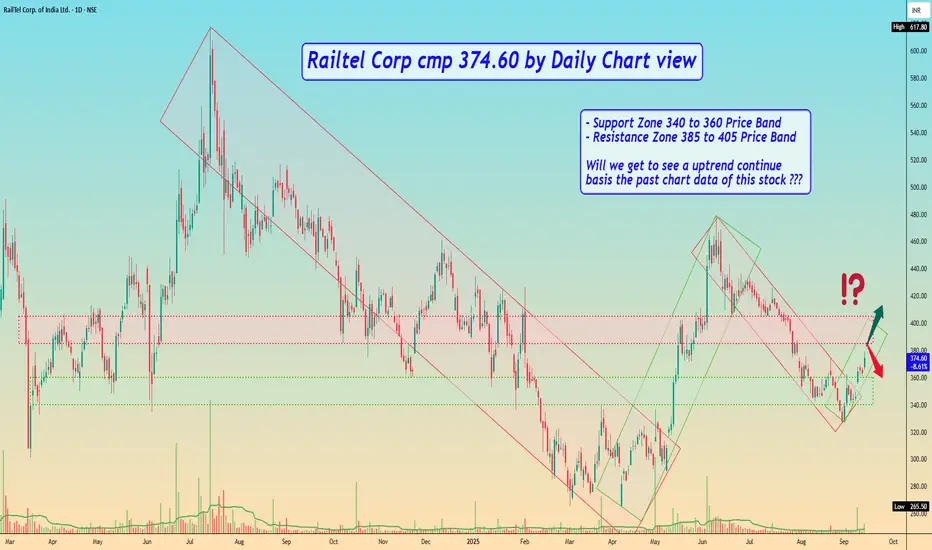
Railtel Corp cmp 374.60 by Daily Chart viewRailtel Corp cmp 374.60 by Daily Chart view
- Support Zone 340 to 360 Price Band
- Resistance Zone 385 to 405 Price Band
- Will we get to see a uptrend continue basis the past chart data of this stock ???
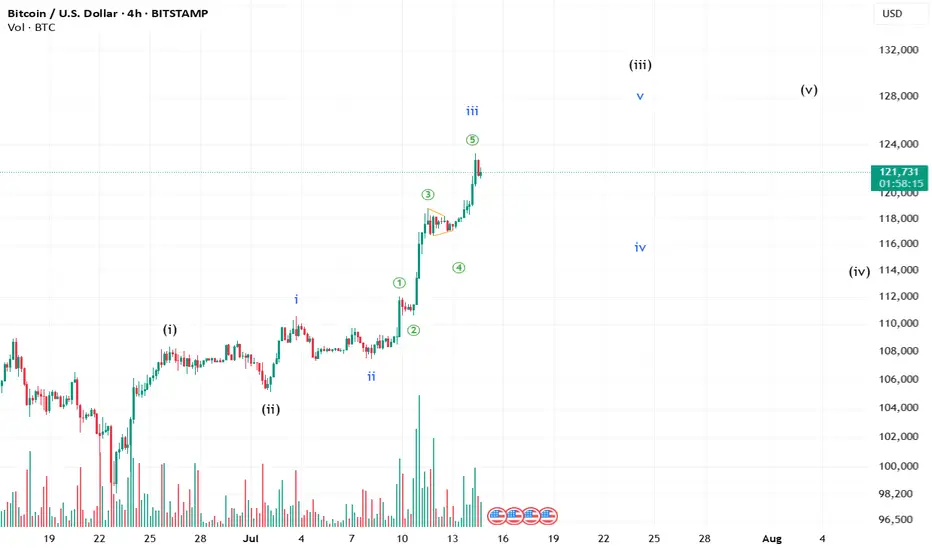
There is some steam still left in BTC!!BTC might still try again to push the levels to complete its sister waves. Whether it will sustain in the future is still yet to be answered.
**This is an educational market outlook, not investment advice. Please consult a SEBI-registered advisor before taking any investment decisions.**
Gold prices today, January 21: Unexpected sharp reversalGold prices have risen slightly due to a weaker USD as the market assesses the economic impact of President Trump’s policies following his inauguration. A Trump administration official stated that the president will issue a trade memorandum on his first day in office without imposing new tariffs.
The price spread between futures and spot gold has widened recently as traders speculate on the impact of U.S. import tariffs. While gold is a hedge against inflation, Trump’s tariff policies could lead the Federal Reserve to maintain higher interest rates for a longer period, which would reduce the appeal of gold.
However, dovish comments from Fed Governor Waller and reports about gradually applied tariffs have led traders to adjust their expectations, now predicting two rate cuts this year instead of just one. Gold is currently in an upward price channel and could continue to rise if it holds support at 2,693.
From a technical analysis perspective, gold is currently in an upward price channel with clear upward waves. The new support level at 2,693 reinforces the bullish trend, and if gold holds above this level, it could continue to target higher levels. The next significant resistance is around 2,720 – 2,730, and if broken, gold could continue to rise sharply to 2,750.
The Take Profit (TP) level could be set in the 2,750 – 2,760 range, while the Stop Loss (SL) should be placed around 2,680 – 2,690 to mitigate risk if the price reverses. If gold breaks the support level at 2,693, this could signal a reversal, and it is recommended to reconsider the strategy.

Limited Upside Potential Ahead of Trump's InaugurationGold prices reversed their Asian session decline on Monday as the US dollar weakened slightly. Expectations that the Fed may pause its rate-cutting cycle could limit the upward momentum of XAU/USD amidst a positive risk sentiment. Traders are now focusing on President-elect Donald Trump's inauguration speech for new market drivers.
The short-term technical outlook suggests that gold may continue its downward trend before new buying interest emerges at lower levels. Based on the technical chart, the current challenge for gold is the resistance level at 2721. If gold fails to break this level, it is likely to reverse and test the previous support at 2660.
Stop Loss and Target:
Stop Loss (SELL): 2725
Take Profit (SELL): 2660
Stop Loss (BUY): 2675
Take Profit (BUY): 2720
Be cautious and good luck with your trading!

Nifty on Radar, View for 21-JuneThe price has been following a divergence pattern between rsi and price.
Today the price is rejected by the previous candle high. The breakdown of the level 23,334 could start a downtrend.
Disclaimer: This is my pre market analysis and my trading journal. Not a suggestion to buy or sell.

BAJAJHLDNG, Technical Outlook for 27MayTrend - Negative
Strength Strong
CMP - 8,031.95
Breakdown Level - 8,014.30
Support - 7,739.50
Resistance - 8,495.00
Disclaimer : This is my pre market analysis and my trading journal. Not a suggestion to buy or sell.

PNB, Intraday View for 29-MayTrend - Positive
Strength - Medium
Probability > 50%
Today we have a red candle with High High and High Low.
The price could test the level of 137.
CMP : 128.20
Resistance : 137
Support-1 : 123.50
Support-2 : 119
Disclaimer: This is my pre market analysis and my trading journal. Not a suggestion to buy or sell.

Diagonal formation in AARTI-INDElliott Wave Analysis
A diagonal has formed in the C wave. there may be a small correction pending.
the correction seems to be a 2nd wave to the Previous 1st impulse wave.
almost 60% fall was done.
we may expect a bounce back.
further chart will be posted accordingly.
kindly follow to kept updated.

USDJPY Downtrend AnalysisTrade Analysis : Swing USDJPY Downtrend
Trendline analysis on USDJPY
Trend Identification: Swing Downtrend USDJPY.
Support/Resistance Levels: Identify key levels on the chart for potential entry and exit points.
Price Behavior: Daily Bullish pullback with market structure.
Targets: T1 = 143.375, T2 - 143.00. Check for Entry and Stop-loss.
Risk Management: Set appropriate stop-loss levels to manage risk and protect against adverse price movements.
Confirmation Indicators: Support/Resistance Levels, Higher High, Higher Lows.
Conclusion: Based on the chart analysis of , USDJPY is Downtrend has been identified. Combine this analysis with thorough research and risk management strategies to make well-informed trading decisions. Avoid counter-trend trading. Happy trading!
(Note: Trading is subject to market risk. This is analysis not an trade idea for trade.)

USDJPY Swing Downtrend AnalysisTrade Analysis : Swing USDJPY Downtrend
Channel analysis on USDJPY
Trend Identification: Swing Downtrend USDJPY.
Support/Resistance Levels: Identify key levels on the chart for potential entry and exit points.
Price Behavior: Daily Bullish pullback with market structure.
Targets: T1 = 139.00, T2 - 137.50.
Risk Management: Set appropriate stop-loss levels to manage risk and protect against adverse price movements.
Confirmation Indicators: Support/Resistance Levels, Higher High, Higher Lows.
Conclusion: Based on the chart analysis of , USDJPY is Downtrend has been identified. Combine this analysis with thorough research and risk management strategies to make well-informed trading decisions. Avoid counter-trend trading. Happy trading!
(Note: Trading is subject to market risk. This is analysis not an trade idea for trade.)

NIFTY - AnalysisThe key levels for NIFTY are as follows.
The move is just started.
Buy - 18314
Target - 18882

LTIMINDTREE - AnalysisThe key levels for LTIMINDTREE are as follows.
The move is already in progress.
Buy - 4680
Target - 4830

INFY - AnalysisThe key levels for INFY are as follows.
The move is ready to take off.
Buy - 1247
Target - 1365

RELIANCE - AnalysisThe key levels for RELIANCE are as follows.
The move is Just started.
Buy - 2482
Target - 2600

Channel breakout in Balramchinni mills Channel Breakout with good volumes.
Fundamentally Strong stock
Entry - 370
Target -530
Longterm Investing (hold for 1 year and you will get the results)

EURO/USD (Neowave Analysis)FX:EURUSD
Hi Everyone
Its been a long time almost an year EUR/USD had been falling. We were falling in an structure of L series (mean long term wave ) and recently we have completed L5 a 0.98132. Now its time for an ABC correction structure which we represent with LC1, LC2. ( C stand for correction).
Let see structure equation,
1) We are in (LC 1 >)
in which we have completed M1 ( m stand for medium term waves) and progressing with M2
(LC 1>M2 ?)
2) Further if we brake down M series you will see s series( s stand for short term wave)
(LC 1>M2 > SC 2?)
3 ) This mean after correction wave in wave M2, we will definitely see an 5 or 3 wave structure in s series as long as we are above invalidation levels.
Note - This equation is just for your memory. Let me know if this is helpful or not.
If you does not understand our coding structure plz check out below chart.
Thank You
