Part 6 Learn Institutional Trading Risks in Option Trading
While options offer unique advantages, they also carry risks:
Time Decay: Options lose value as expiration approaches, especially for buyers.
Complexity: Advanced strategies require deep understanding and precise execution.
Unlimited Loss Potential: Some option selling strategies can result in very large losses.
Liquidity Risk: Not all options have sufficient trading volume.
Trendcontinuation

Part 4 Learn Institutional Trading Factors Affecting Option Prices
Option pricing is influenced by several variables, commonly explained through models like the Black-Scholes model:
Price of the underlying asset
Time to expiration (time decay or theta)
Volatility (implied volatility plays a crucial role)
Interest rates
Dividends

Part 2 Ride The Big MovesKey Components of Option Trading
Several important elements determine an option’s price and behavior:
Underlying Asset – The stock, index, or instrument on which the option is based.
Strike Price – The price at which the asset can be bought or sold.
Expiration Date – The date after which the option becomes worthless if not exercised.
Premium – The cost of buying the option.
Lot Size – The standardized quantity of the underlying asset per option contract.

Part 1 Ride The Big MovesWhat Are Options?
An option is a financial derivative contract that derives its value from an underlying asset such as a stock, index, commodity, or currency. The contract gives the buyer the right, but not the obligation, to buy or sell the underlying asset at a predetermined price, known as the strike price, on or before a specified date called the expiration date. The seller (or writer) of the option has the obligation to fulfill the contract if the buyer chooses to exercise the option.
There are two main types of options:
Call Options: Give the buyer the right to buy the underlying asset at the strike price.
Put Options: Give the buyer the right to sell the underlying asset at the strike price.
The buyer pays a price known as the premium to the seller for acquiring this right.

Candle Pattern What Are Candlestick Patterns?
Candlestick patterns originate from Japanese rice traders and represent the open, high, low, and close of price. They are especially useful for identifying short-term reversals, continuations, and market indecision.
Common Mistakes Traders Make
Trading patterns without confirmation
Ignoring higher timeframes
Overtrading every pattern
Forgetting risk management
Ignoring market context and trend
Patterns work best when aligned with:
Trend direction
Support & resistance
Volume
Broader market sentiment

Chart Patterns What Are Chart Patterns?
Chart patterns are recognizable formations created by price movements on a chart. They develop over time and help traders identify trends, reversals, or continuation of trends. Chart patterns are usually formed by support and resistance levels, trendlines, and consolidation phases.
Types of Chart Patterns
Chart patterns are broadly classified into:
Reversal Patterns
Continuation Patterns
Bilateral (Neutral) Patterns

Small Account ChallengesNavigating the Market with Limited Capital
Trading or investing with a small account is one of the most demanding yet most common starting points for market participants. Whether in stocks, forex, commodities, or crypto, a small account magnifies every decision, emotion, and mistake. While the markets offer equal access to everyone, the reality is that account size significantly influences strategy, psychology, risk management, and growth potential. Understanding the challenges of a small account is essential to surviving early stages and building a sustainable path toward long-term success.
Limited Margin for Error
The biggest challenge of a small account is the lack of room for mistakes. A few bad trades can cause disproportionate damage. For example, a 10% loss on a ₹10,000 account feels manageable, but psychologically it can be devastating because recovery requires a higher percentage gain. Unlike large accounts, where losses can be absorbed and diversified across multiple positions, small accounts are fragile. This forces traders to be extremely precise with entries, exits, and position sizing—skills that usually take time and experience to develop.
Position Sizing Constraints
Small accounts face strict position sizing limitations. Many quality trades require a certain stop-loss distance to respect market structure. However, with limited capital, traders often feel compelled to reduce stop-loss size unrealistically or increase position size beyond safe limits just to make the trade “worth it.” This leads to overleveraging, premature stop-outs, or catastrophic losses. The challenge is balancing proper risk management with the desire to generate meaningful returns from a small base.
Overtrading and the Urge to Grow Fast
A common psychological trap for small account traders is overtrading. Because profits appear small in absolute terms, traders feel pressure to trade frequently, chase volatility, or jump into low-quality setups. This behavior is driven by impatience rather than strategy. Overtrading increases transaction costs, emotional fatigue, and exposure to random market noise. Instead of compounding steadily, the account often fluctuates wildly, making consistent growth nearly impossible.
Emotional Pressure and Psychological Stress
Small accounts carry intense emotional weight. Every trade feels important, sometimes even “make or break.” This pressure can cause fear of pulling the trigger, hesitation at key moments, or panic exits. On the other hand, a few winning trades may create overconfidence, leading to reckless risk-taking. Emotional swings are sharper because the account represents hard-earned capital and often personal savings. Managing psychology becomes as important—if not more important—than technical or fundamental analysis.
High Impact of Costs and Fees
For small accounts, brokerage fees, spreads, commissions, and taxes have a much larger relative impact. A trade that looks profitable on paper may yield minimal net gains after costs. Frequent trading further amplifies this issue. In markets like forex or crypto, spreads alone can eat into profits significantly. This makes strategy selection critical; traders must focus on setups with favorable risk-reward ratios rather than small, frequent scalps that may not survive costs.
Limited Diversification Opportunities
Diversification is a cornerstone of risk management, but small accounts struggle with it. Capital constraints often force traders to concentrate on one or two instruments or strategies. While focus can be beneficial, it also increases exposure to specific market conditions. If that instrument enters a choppy or unfavorable phase, the account suffers. Large accounts can rotate across sectors, assets, or time frames, but small accounts must rely heavily on timing and discipline.
Leverage: A Double-Edged Sword
Leverage is often seen as a solution for small accounts, but it is also one of their greatest threats. While leverage allows traders to control larger positions, it magnifies losses faster than gains. Many small accounts are wiped out not because the strategy was wrong, but because leverage was misused. The challenge lies in using leverage responsibly—as a tool, not a crutch—while respecting strict risk limits.
Information Overload and Strategy Confusion
Small account traders are frequently overwhelmed by too much information. Social media, trading courses, tips, and signals promise quick growth and “sure-shot” strategies. This creates confusion, constant strategy switching, and lack of consistency. A small account does not have the luxury to experiment endlessly. Every strategy change resets the learning curve, leading to losses that could have been avoided with patience and focus.
Slow Compounding and Unrealistic Expectations
One of the hardest realities to accept is that small accounts grow slowly when managed properly. Safe risk percentages (1–2% per trade) produce modest gains in the beginning. This clashes with unrealistic expectations of doubling accounts quickly. The challenge is mental: respecting the process, trusting compounding, and understanding that survival and consistency matter more than short-term growth.
Turning Challenges into Strengths
Despite these difficulties, small accounts also offer valuable advantages. They force traders to develop discipline, precision, and emotional control early. Losses, while painful, are usually smaller in absolute terms and serve as affordable lessons. Traders who successfully grow small accounts often build stronger habits than those who start large. The key is shifting the mindset from “making money fast” to building skill, consistency, and capital protection.
Conclusion
Small account challenges are real, intense, and unavoidable for most traders. Limited capital magnifies risk, emotions, and mistakes, while restricting flexibility and diversification. However, these same constraints can shape disciplined, resilient, and skilled market participants. Success with a small account is not about aggressive growth or constant action—it is about patience, risk control, psychological mastery, and long-term thinking. Those who respect these principles may not grow fast, but they grow strong, laying a foundation for sustainable success in the markets.

"Gold in Firm Bullish Control""Gold in Firm Bullish Control"
Gold is currently trading in a constructive upward environment, where price behavior reflects sustained participation from institutional buyers rather than speculative spikes. Recent movements show that upside progress has been built through measured advances followed by controlled pauses, a pattern that typically appears when the market is preparing for continuation rather than exhaustion.
Market activity suggests that buy-side interest remains dominant, with pullbacks being absorbed efficiently and failing to generate follow-through selling. This indicates that bearish pressure lacks commitment, while bullish participation remains organized and patient. The absence of aggressive downside momentum during pauses reinforces confidence in the prevailing direction.
Volatility has compressed after an expansion phase, which often precedes another directional move. This compression reflects balance at higher price levels, a sign that the market is accepting value above prior ranges. Such acceptance generally supports further upside attempts once activity re-expands.
From a flow perspective, price reactions imply that liquidity has already been tested and cleared, reducing immediate downside vulnerability. The market now appears positioned for continuation rather than correction, with sentiment favoring gradual appreciation rather than sharp reversals.
Overall Assessment:
Gold remains in a positive continuation phase, where conditions favor further upward progress as long as market behavior continues to show acceptance at elevated levels and pullbacks remain corrective in nature

Option Trading Psychological Factors for Profit
a) Patience
Wait for setup confirmation.
b) Discipline
Follow risk rules.
c) Emotion Control
Avoid greed.
Book profits early.
d) Backtesting
Practice improves profitability.

Part 2 Support and Resistance Buying Options for Profit
Buying options is attractive because:
limited risk (only premium)
unlimited profit potential (for calls)
high reward-to-risk ratio
lower capital requirement vs buying stocks
Example of buying a call:
Premium paid: ₹20
Strike: ₹100
Spot moves to ₹130
Intrinsic value: 130 − 100 = ₹30
Profit = ₹30 − ₹20 = ₹10 per share
If each lot has 500 shares:
Total profit = ₹5,000
The beauty:
Maximum risk = ₹20 × 500 = ₹10,000
Even if the asset crashes, your loss is capped.

Part 1 Support and Resistance How Option Trading Profits Work
There are two major types of option contracts:
Call Options: Profit when asset prices rise.
Put Options: Profit when asset prices fall.
When you buy an option, you pay a premium. This premium is the cost of entering the trade. When the market moves in your favor, the value of the option increases, enabling you to sell it for more than you paid, or exercise it at a favorable price.
The core idea:
If the market moves toward your expectation, you profit.
If the market moves against your expectation, you lose only the premium if you're a buyer.
Profit = (Option Selling Price – Option Purchase Price) – Premium

Part 9 Trading Master Class Moneyness of Options
Options are categorized based on their relationship to the current market price:
In-the-Money (ITM) – Option has intrinsic value
At-the-Money (ATM) – Strike price is near the market price
Out-of-the-Money (OTM) – Option has no intrinsic value
ATM options are most sensitive to price movement, while OTM options are cheaper but require larger moves to become profitable.

Part 8 Trading Master Class Option Pricing and the Role of Greeks
Option prices are influenced by multiple factors, not just price direction. These influences are measured by Option Greeks:
Delta – Measures how much the option price changes for a 1-point move in the underlying
Gamma – Measures the rate of change of delta
Theta – Measures time decay; options lose value as expiry approaches
Vega – Measures sensitivity to changes in volatility
Rho – Measures impact of interest rate changes
Understanding Greeks helps traders manage risk, select strategies, and anticipate how options behave under different market conditions.

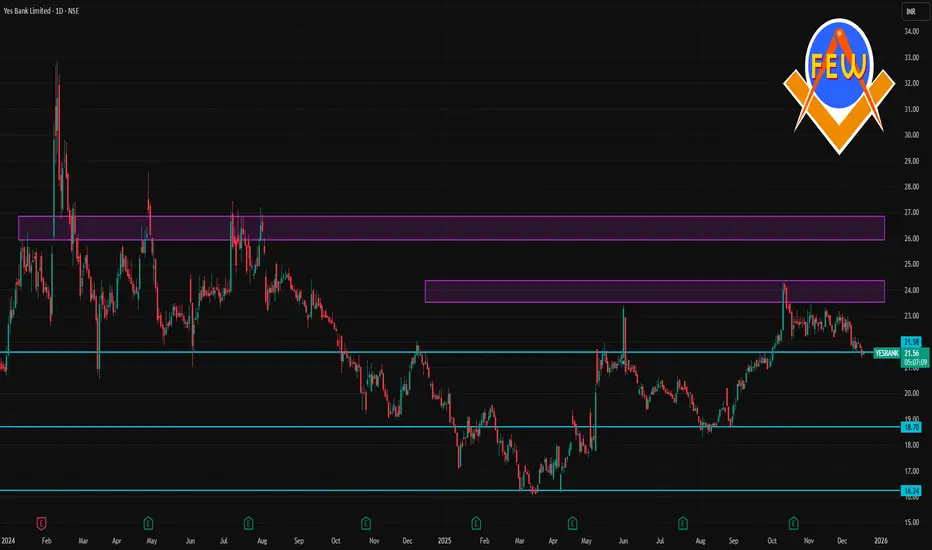
YESBANK 1 Day Time Frame 📊 Daily Time Frame Levels (1 D)
Current approximate price: ~₹21.7–₹22.7 (varies by source)
🔹 Pivot & Daily Reference Level
Daily pivot (Classic): ~ ₹22.58–₹22.60
🧱 Resistance Levels
Immediate resistance: ~ ₹24.00–₹24.03 (1st major upside barrier)
Above that, psychologically significant levels are near recent 52-week highs around ₹24.30
📉 Support Levels
Short-term support: ~ ₹22.22
Medium/stronger support: ~ ₹20.97
Lower support zones (broader view): ~ ₹19.17–₹18.50 (from broader multi-period analysis)
📈 Technical Indicator Snapshot (Daily)
RSI appears mid-range (neutral/slightly weak) on some chart summaries (~40–46), indicating no strong overbought/oversold condition on the daily chart.
Some aggregators still show a general sell bias based on moving averages and oscillator signals (especially if price < longer-term MAs).
🧠 How Traders Often Use These Levels
Bullish scenario: A sustained break above ₹24.00–₹24.30 with volume could target higher levels.
Bearish scenario: Failure below ₹20.97/₹20 may open the way toward ₹19–₹18 region.
Pivot plays: Near daily pivot (~₹22.58), intraday traders often watch for bounces or breaks for direction.
Trade Crypto Like a ProA Complete Guide to Mastering Cryptocurrency Markets
Trading cryptocurrency like a professional is not about luck, hype, or chasing the next trending coin. It is a disciplined process that combines market knowledge, technical skills, risk management, psychology, and continuous learning. The crypto market operates 24/7, is highly volatile, and reacts instantly to global news, making it both an opportunity-rich and risk-heavy environment. Professional crypto traders approach this market with structure, patience, and a well-defined strategy, treating trading as a business rather than a gamble.
Understanding the Crypto Market Structure
To trade crypto like a pro, the first step is understanding how the market works. Cryptocurrencies trade on centralized exchanges (like Binance, Coinbase, or OKX) and decentralized exchanges (DEXs). Prices are driven by supply and demand, liquidity, market sentiment, macroeconomic trends, regulations, and technological developments. Unlike traditional markets, crypto has no closing bell, which means price movements can happen anytime. Professionals account for this by using alerts, stop-losses, and predefined trading plans instead of constantly watching charts.
Market cycles are another critical concept. Crypto moves through accumulation, markup (bull phase), distribution, and markdown (bear phase). Professional traders focus on identifying which phase the market is currently in and align their strategies accordingly. They do not fight the trend; instead, they trade with it.
Choosing the Right Trading Style
Professional traders clearly define their trading style. Some focus on scalping, making small profits from quick trades. Others prefer day trading, closing all positions within a day. Swing traders hold positions for days or weeks, capturing medium-term trends, while position traders ride long-term market moves. There is no “best” style—only what suits your capital, time availability, and emotional tolerance.
Pros avoid overtrading. They understand that fewer high-quality trades often outperform frequent impulsive trades. Patience is considered a skill, not a weakness.
Technical Analysis: The Trader’s Core Skill
Technical analysis is the backbone of professional crypto trading. It involves studying price charts, trends, support and resistance levels, volume, and indicators. Pro traders focus more on price action than on cluttering charts with too many indicators. Key tools include moving averages, RSI, MACD, Fibonacci levels, and volume profile.
Support and resistance zones are especially important in crypto due to its volatility. Professionals wait for confirmation near these levels instead of chasing breakouts blindly. They also understand false breakouts and fake pumps, which are common in crypto markets due to low liquidity in some altcoins.
Fundamental and Narrative Analysis
While technicals help with entries and exits, fundamentals provide context. Professional traders track blockchain upgrades, tokenomics, developer activity, institutional adoption, regulatory news, and macro factors like interest rates and global liquidity. Narratives such as DeFi, AI tokens, Layer-2 scaling, or Web3 gaming often drive sector-wide rallies.
Pros do not marry narratives blindly. They use them to filter opportunities and time trades, not to justify holding losing positions. When the narrative changes, they adapt quickly.
Risk Management: The Pro’s Biggest Edge
What truly separates professionals from amateurs is risk management. Pro traders never risk a large portion of their capital on a single trade. They define risk before entering a trade, typically risking only 1–2% of total capital per trade. Stop-losses are non-negotiable.
Position sizing is calculated, not guessed. Even with high-confidence setups, professionals accept that losses are part of the game. Survival comes first; profits come second. They aim for favorable risk-to-reward ratios, often targeting at least 1:2 or 1:3.
Psychology and Emotional Control
Crypto markets are emotional battlegrounds. Fear, greed, FOMO, and panic selling destroy more accounts than bad strategies. Professional traders build emotional discipline by following rules, journaling trades, and reviewing mistakes objectively.
They do not revenge trade after losses or become overconfident after wins. Every trade is treated as one of many in a long series. Consistency matters more than excitement.
Using Leverage Wisely (or Avoiding It)
Leverage can amplify profits, but it can destroy accounts just as fast. Professional traders either avoid high leverage or use it very conservatively. They understand liquidation mechanics and never rely on leverage to compensate for poor setups.
Many pros focus on spot trading during uncertain market conditions and use derivatives only when volatility, liquidity, and trend clarity align.
Building a Professional Trading Routine
Professional trading is systematic. It includes pre-market analysis, setting alerts, planning trades in advance, executing with discipline, and post-trade reviews. Journaling trades helps identify patterns, strengths, and recurring mistakes.
Pros continuously refine their strategies based on data, not emotions. They backtest ideas, forward test with small capital, and scale only after consistent performance.
Security, Tools, and Long-Term Growth
Security is a professional priority. Using hardware wallets, two-factor authentication, and avoiding suspicious links is essential. Tools like charting platforms, on-chain analytics, and news aggregators help professionals stay informed without noise.
Finally, professional crypto traders invest in education. Markets evolve, strategies stop working, and new instruments emerge. Adaptability is the ultimate edge.
Conclusion
Trading crypto like a pro is not about predicting every move or getting rich overnight. It is about process, discipline, risk control, and continuous improvement. Professionals respect the market, manage risk relentlessly, and stay emotionally neutral. By approaching crypto trading as a serious business and committing to skill development, patience, and structure, traders can steadily move from amateur behavior to professional-level performance in one of the most dynamic markets in the world.

Candle Patterns The Power of Context: Where Patterns Truly Work
Patterns are not standalone signals. Their effectiveness depends on context:
Trend Direction: Patterns aligned with the higher-timeframe trend have higher probability.
Support and Resistance: Patterns near key levels carry more weight.
Volume: Breakouts with volume confirm participation.
Market Structure: Higher highs and higher lows validate bullish patterns; lower highs and lower lows validate bearish ones.
A bullish engulfing in the middle of nowhere is noise. The same pattern at a weekly support level is opportunity.

Part 3 Learn Institutional Trading Spread Strategies (Risk-Defined Trades)
Spread strategies reduce risk by combining buy and sell options.
Bull Call Spread
Concept: Buy lower strike call + Sell higher strike call.
Profit: Limited
Risk: Limited
Best Market Condition: Moderate uptrend
Benefit:
Lower cost than buying a naked call.

Part 2 Ride The Big Moves Iron Condor Strategy
Concept: Combination of bull put spread + bear call spread.
Profit: Limited
Risk: Limited
Best Market Condition: Range-bound market
Use Case:
Preferred by professional traders due to defined risk.

Part 1 Ride The Big Moves Short Strangle Strategy
Concept: Sell out-of-the-money Call and Put.
Profit: Premium
Risk: Unlimited
Best Market Condition: Sideways market with limited range
Advantage over Straddle:
Lower margin and lower risk compared to straddle.

Part 2 Intraday Trading Master ClassNon-Directional (Range-Bound) Strategies
These strategies profit when the market does not move much.
Short Straddle Strategy
Concept: Sell Call + Sell Put at same strike.
Profit: Premium received
Risk: Unlimited
Best Market Condition: Low volatility, sideways market
Use Case:
When expecting very low movement, typically before event expiry.
Warning:
High-risk strategy, requires strict risk management.

Positional Trading vs. Swing Trading in the Indian MarketUnderstanding Positional Trading
Positional trading is a medium- to long-term trading style where traders hold positions for several weeks to a few months. The goal is to benefit from a larger directional move driven by strong trends, fundamental changes, or long-term technical breakouts.
In the Indian market, positional traders often focus on:
Strong sectoral themes (banking, IT, pharma, PSU, metals)
Macroeconomic trends (interest rates, inflation, GDP growth)
Company fundamentals (earnings growth, balance sheet strength)
Long-term technical structures on weekly or monthly charts
For example, a positional trader may buy a banking stock when interest rate cuts are expected and hold it for three to six months as the sector re-rates.
Key Characteristics of Positional Trading:
Holding period: Weeks to months
Charts used: Daily, weekly, monthly
Trade frequency: Low
Stop loss: Wider
Target size: Large
Stress level: Comparatively low
Positional traders are less affected by daily market noise. Short-term volatility caused by global cues or intraday news does not usually force them out of trades unless the broader trend changes.
Understanding Swing Trading
Swing trading is a short- to medium-term strategy where traders aim to capture price swings within a trend. Positions are usually held from a few days to a few weeks. Swing traders actively trade market fluctuations and are more sensitive to technical signals.
In the Indian market, swing trading is extremely popular because:
Volatility is high, especially in mid-cap and small-cap stocks
Weekly option expiry cycles create frequent momentum
Retail participation leads to sharp price swings
Technical patterns work well on short time frames
Swing traders typically rely on:
Support and resistance levels
Chart patterns (flags, triangles, double tops/bottoms)
Indicators like RSI, MACD, moving averages
Volume and price action
For instance, a swing trader may buy a stock near a strong support level after a pullback and exit within 5–10 days once resistance is reached.
Key Characteristics of Swing Trading:
Holding period: 2 days to 2–3 weeks
Charts used: Hourly, 4-hour, daily
Trade frequency: Moderate to high
Stop loss: Tight
Target size: Moderate
Stress level: Higher than positional trading
Swing trading requires regular monitoring of positions and quick decision-making.
Time Commitment and Lifestyle Differences
One of the biggest differences between positional and swing trading in India is time involvement.
Positional trading is suitable for working professionals, business owners, or investors who cannot watch markets daily. Once a trade is planned, only periodic review is required.
Swing trading demands more screen time. Traders must track price movements, adjust stop losses, and respond to market changes, especially around events like RBI policy announcements or global market moves.
If you can spend only limited time on markets, positional trading is often more practical.
Risk Management and Capital Requirements
Risk management plays a crucial role in both styles, but it is applied differently.
Positional Trading Risk Profile:
Wider stop losses due to long-term volatility
Lower position size per trade
Fewer trades reduce transaction costs
Overnight and weekend gap risk exists
Swing Trading Risk Profile:
Tighter stop losses
Higher position turnover
More brokerage and taxes due to frequent trading
Lower gap risk due to shorter holding period
In the Indian context, where sudden news (budget announcements, election results, global market shocks) can cause gaps, positional traders must be mentally prepared for drawdowns.
Role of Fundamentals vs. Technicals
Positional traders give higher importance to fundamentals combined with technicals. They often enter trades only when both align.
Swing traders rely primarily on technical analysis. Fundamentals are secondary and mainly used to avoid weak stocks.
For example, a swing trader may trade a technically strong stock even if long-term fundamentals are average, whereas a positional trader may avoid it.
Impact of Indian Market Structure
The Indian market has some unique features that influence both styles:
Weekly and monthly F&O expiry increases short-term volatility (benefits swing traders)
High retail participation leads to emotional price swings
Sector rotation is frequent, creating positional opportunities
Global dependency (US markets, crude oil, dollar index) affects both styles differently
Swing traders often benefit from expiry-related momentum, while positional traders benefit from broader economic and sectoral trends.
Psychology and Discipline
Psychology is where many traders fail.
Positional trading psychology requires patience, conviction, and the ability to sit through temporary drawdowns.
Swing trading psychology demands quick execution, emotional control, and acceptance of frequent small losses.
In India, where social media tips and news-driven trading are common, swing traders are more prone to overtrading, while positional traders risk holding losing positions for too long.
Which Is Better for Indian Traders?
There is no universally “better” approach. The choice depends on:
Your time availability
Risk tolerance
Capital size
Personality and patience level
Market experience
Positional trading is better if you:
Prefer low-frequency trades
Have limited screen time
Believe in macro and sectoral trends
Can handle longer drawdowns
Swing trading is better if you:
Can actively monitor markets
Enjoy technical analysis
Prefer faster results
Are comfortable with frequent decision-making
Many successful Indian traders use a hybrid approach, combining positional trades in strong sectors with swing trades for short-term opportunities.
Conclusion
In the Indian market, both positional trading and swing trading offer excellent opportunities when applied correctly. Positional trading focuses on capturing big trends with patience and discipline, while swing trading aims to profit from short-term price movements with active involvement. Understanding your personality, market conditions, and risk management skills is more important than choosing one style over the other. Ultimately, consistency, discipline, and continuous learning determine success—regardless of whether you are a positional trader or a swing trader.
Option Trading Strategies Directional Option Trading Strategies
Directional strategies are used when the trader has a clear bullish or bearish view on the underlying asset.
Long Call Strategy (Bullish)
Concept: Buy a call option expecting the price to rise.
Maximum Loss: Premium paid
Maximum Profit: Unlimited
Best Market Condition: Strong uptrend
Use Case:
When you expect sharp upside movement with high momentum.
Risk:
If price does not move fast enough, time decay erodes option value.

ASIANPAINT 1 Day Time Frame 📊 Current Trading Context (latest session data)
The stock today has traded between ₹2,746 and ₹2,797.
Latest price around ₹2,780–₹2,788 (price fluctuating intraday).
📈 Intraday Technical Levels (Daily Pivot-Style)
Resistance Levels (Upside):
R1: ₹2,792 – ₹2,793
R2: ₹2,820 – ₹2,821
R3: ₹2,844 – ₹2,846
(These are key zones where upside can stall)
Support Levels (Downside):
S1: ₹2,741 – ₹2,742
S2: ₹2,718 – ₹2,720
S3: ₹2,690 – ₹2,692
(These are key zones where price might find a floor)
📌 How to Use These Levels Today
Bullish scenario:
✔ Sustained move above ₹2,792–₹2,793 may target ₹2,820 and then ₹2,844.
Bearish scenario:
✔ Failure below ₹2,742 may push towards ₹2,720 and then ₹2,690.
Neutral / range:
✔ Between ₹2,742 and ₹2,792, expect sideways chop unless volume breaks out.
