Narrative-Driven MarketsHow Stories Move Prices More Than Numbers
Financial markets are often described as rational systems where prices reflect hard data such as earnings, interest rates, cash flows, and economic indicators. Yet, anyone who has observed markets closely knows that prices frequently move far ahead of fundamentals—or even in the opposite direction. This apparent contradiction is best explained by the concept of the narrative-driven market, where stories, beliefs, and collective imagination shape market behavior more powerfully than spreadsheets and models.
A narrative-driven market is one in which stories dominate decision-making. These stories can be about growth, disruption, fear, recovery, nationalism, technology, or even survival. Investors, traders, media, analysts, and policymakers all contribute to building and spreading these narratives. Once a narrative gains momentum, it influences expectations, risk appetite, capital flows, and ultimately prices.
The Power of Stories in Financial Markets
Human beings are natural storytellers. We understand the world not just through data, but through meaning. Markets are no exception. A balance sheet tells us what is, but a narrative tells us what could be. Investors do not buy stocks for past earnings; they buy them for future possibilities. Narratives fill the gap between uncertainty and action.
For example, the narrative of “a fast-growing digital economy” can lift valuations of technology companies even when profits are weak. Similarly, a narrative of “economic slowdown” can crush fundamentally strong stocks because fear overrides logic. In both cases, the story becomes stronger than the numbers.
How Narratives Are Born
Market narratives usually emerge from a combination of events and interpretation. A new technology, a policy change, a geopolitical conflict, a pandemic, or a central bank decision can act as the spark. Media headlines, expert opinions, social media discussions, and institutional reports then shape how that event is understood.
Over time, repetition reinforces belief. The more a narrative is discussed, the more credible it appears. Eventually, it becomes the “accepted truth” of the market—even if the underlying facts are still uncertain.
For instance, during periods of global liquidity, the narrative often becomes “buy every dip because central banks will support markets.” This belief itself encourages buying, making the narrative self-fulfilling.
Narratives and Market Cycles
Narratives evolve with market cycles.
Early cycle: Narratives are quiet and skeptical. Only a few believe in the new story.
Expansion phase: The narrative gains traction. Data starts supporting it, and prices rise steadily.
Euphoria: The narrative becomes extreme. Valuations are justified with phrases like “this time is different.” Risks are ignored.
Breakdown: Reality challenges the story. A trigger event causes doubt.
Collapse: The narrative reverses. Fear replaces optimism, often overshooting on the downside.
Understanding where a narrative sits in this cycle helps traders and investors avoid emotional decisions and crowd behavior.
Media and Social Amplification
In modern markets, narratives spread faster than ever. Financial news channels, Twitter (X), YouTube, Telegram, and WhatsApp groups amplify stories instantly. Algorithms prioritize emotional and sensational content, which often strengthens extreme narratives—both bullish and bearish.
Retail participation has further intensified narrative-driven moves. Coordinated belief, even without strong fundamentals, can drive sharp rallies or crashes. Price action then becomes the “proof” that the narrative is correct, attracting even more participants.
Fundamentals vs Narratives
It is important to note that narratives do not permanently replace fundamentals. In the long run, cash flows, profitability, and economic reality matter. However, in the short to medium term, narratives can stretch valuations far beyond fair value.
Successful market participants understand this balance. They do not dismiss fundamentals, but they also do not underestimate the power of belief. A fundamentally cheap stock can remain cheap if the narrative is negative. A fundamentally expensive stock can keep rising if the narrative remains strong.
Narratives in Different Asset Classes
Narrative-driven behavior is not limited to equities.
Commodities react strongly to stories of shortages, wars, or super cycles.
Currencies move on narratives of economic strength, capital flows, and political stability.
Crypto markets are almost entirely narrative-based, driven by adoption stories, regulation fears, and technological promises.
Bond markets respond to narratives around inflation, growth, and central bank credibility.
Each asset class has its own dominant storytellers and belief systems.
Trading and Investing in Narrative-Driven Markets
To operate effectively in narrative-driven markets, one must shift mindset. Instead of asking only “Is this cheap or expensive?”, a better question is “What story is the market currently believing?”
Key skills include:
Listening to dominant themes across media and market commentary
Observing price reaction to news rather than the news itself
Identifying when a narrative is strengthening or weakening
Recognizing emotional extremes such as greed and panic
Traders often benefit by aligning with strong narratives but exiting when signs of saturation appear. Long-term investors may wait for narrative collapse to accumulate quality assets at discounted prices.
The Risk of Blind Storytelling
While narratives create opportunity, they also create danger. Blind faith in a story can lead to bubbles and heavy losses. When narratives disconnect completely from reality, even small disappointments can cause violent reversals.
Discipline, risk management, and independent thinking are essential. The goal is not to reject narratives, but to use them consciously rather than emotionally.
Conclusion
A narrative-driven market reflects the deeply human nature of finance. Markets are not just mechanisms of capital allocation; they are arenas of belief, hope, fear, and imagination. Prices move not only on what is known, but on what is believed.
Those who understand narratives gain a powerful edge. They see markets not just as charts and ratios, but as evolving stories. By learning to read, question, and anticipate these stories, traders and investors can navigate volatility with greater clarity, confidence, and control.
Trendcontinuation

Stories Shape the TradeMarkets move on belief before they move on numbers.
Behind every price movement is a story shaping how traders think, feel, and act. Below is a clear, point-wise and impressive explanation of how stories shape the trade in financial markets.
1. Markets Are Built on Human Psychology
Traders are humans, not machines.
Humans understand the world through stories, not raw data.
Prices reflect collective emotions—hope, fear, greed, and doubt.
2. Data Creates Facts, Stories Create Direction
Economic data shows what happened.
Stories explain what it means for the future.
Trades are placed based on expectations, not history.
3. Every Trend Has a Dominant Story
Bull markets thrive on stories of growth, innovation, and opportunity.
Bear markets feed on narratives of risk, slowdown, and collapse.
As long as the story survives, the trend continues.
4. News Is Powerful Because It Builds Narratives
A single headline can change market mood instantly.
The same news can be bullish or bearish depending on the story behind it.
Markets react more to interpretation than information.
5. Stocks Are Valued on Future Stories
Price is not just about current earnings.
Markets buy future potential wrapped in a compelling narrative.
Strong stories attract capital even before profits arrive.
6. Technical Levels Work Because Traders Believe Them
Support and resistance are psychological zones.
Breakouts succeed when the story says “momentum is strong.”
Charts work because belief becomes action.
7. Sentiment Moves Faster Than Fundamentals
Stories spread faster than financial reports.
Social media accelerates narrative-driven trades.
Price often moves first; fundamentals follow later.
8. Institutions Trade Stories at Scale
Big money positions itself before narratives go mainstream.
Retail traders usually enter once the story becomes popular.
Early story recognition creates the biggest profits.
9. Fake Stories Create Traps
Not all stories are true or sustainable.
Overhyped narratives lead to bubbles and sharp reversals.
Smart traders watch price confirmation, not just excitement.
10. Price Reveals Whether the Story Is Working
Strong story + weak price = warning sign.
Bad news + strong price = hidden strength.
Price action exposes belief strength.
11. Market Cycles Are Story Cycles
Accumulation: “No one cares”
Expansion: “This is the future”
Distribution: “It can’t fall”
Collapse: “It was obvious”
12. Successful Traders Trade Story Shifts
The biggest moves happen when the story changes.
Fear turning into confidence creates rallies.
Confidence turning into doubt creates crashes.
13. Emotional Control Beats Story Addiction
Traders lose when they fall in love with narratives.
Professionals stay flexible as stories evolve.
Adaptation is more powerful than conviction.
14. Stories Explain Volatility
Sudden moves happen when stories clash.
Markets reprice instantly when belief changes.
Volatility is the sound of narratives breaking.
15. Master the Story, But Follow the Price
Stories guide understanding.
Price decides truth.
Profitable trading lives at the intersection of both.
🔑 Final Insight
Markets don’t trade facts—they trade beliefs.
Those who understand stories early shape profits.
Those who ignore them chase prices.

Trading Breakouts and Fakeouts How to Identify Real Opportunities and Avoid Traps
Trading breakouts and fakeouts is one of the most popular yet challenging approaches in the financial markets. Traders across equities, commodities, forex, and derivatives closely watch key price levels where the market is expected to make a decisive move. While breakouts can lead to strong, profitable trends, fakeouts often result in losses and emotional frustration. Understanding the difference between the two, and learning how to trade them systematically, is critical for long-term trading success.
What Is a Breakout in Trading?
A breakout occurs when the price of an asset moves decisively above a resistance level or below a support level with increased momentum. These levels are usually formed by prior highs, lows, consolidation ranges, trendlines, or chart patterns such as triangles, rectangles, and head-and-shoulders formations.
Breakouts signal a potential shift in market sentiment. When resistance is broken, it suggests buyers have overpowered sellers. When support breaks, it indicates sellers have gained control. Traders aim to enter positions early in these moves to benefit from the expansion in volatility and price.
Why Breakouts Work
Breakouts work because markets tend to alternate between consolidation and expansion. During consolidation, price moves in a narrow range as buyers and sellers reach temporary balance. Once this balance breaks, price often moves rapidly as:
Stop-loss orders get triggered
New traders enter positions
Institutional traders increase exposure
This chain reaction creates momentum, which can lead to sustained trends.
Common Breakout Strategies
One of the simplest breakout strategies involves identifying a clear support or resistance level and entering a trade once price closes beyond that level. Traders often use:
Horizontal support and resistance
Chart patterns (flags, triangles, ranges)
Highs and lows of previous sessions
Volatility-based levels
Stops are usually placed just inside the broken range, while targets can be based on pattern projection, risk–reward ratios, or trailing stops.
The Role of Volume in Breakouts
Volume is a key confirmation tool in breakout trading. A genuine breakout is usually accompanied by higher-than-average volume, showing strong participation from market players. Low-volume breakouts are more likely to fail, as they indicate a lack of conviction.
In derivatives or futures markets, open interest combined with volume can further validate whether new positions are being built or existing ones are being closed.
What Is a Fakeout?
A fakeout occurs when price briefly breaks above resistance or below support but fails to sustain the move and quickly reverses back into the previous range. Fakeouts are common, especially in sideways or low-volatility markets.
These moves are often driven by:
Stop-loss hunting
False news reactions
Low liquidity periods
Retail trader overreaction
Fakeouts trap breakout traders and reward traders who take the opposite side at the right time.
Why Fakeouts Happen So Often
Markets are designed to find liquidity. Obvious support and resistance levels attract a large number of stop-loss and entry orders. Smart money or institutional players may push price beyond these levels to trigger orders, only to reverse the move once liquidity is absorbed.
Fakeouts are more frequent:
In choppy or range-bound markets
Near major economic announcements
During low-volume sessions
When levels are too obvious
How to Identify a Real Breakout vs a Fakeout
Distinguishing between a breakout and a fakeout requires combining multiple factors rather than relying on a single signal.
Key factors to analyze include:
Candle close: Strong breakouts usually close decisively beyond the level, not just wick through it
Volume confirmation: Higher volume supports breakout validity
Retest behavior: Real breakouts often retest the broken level and hold
Market context: Breakouts in trending markets have higher success rates
Time spent near the level: Strong bases lead to stronger breakouts
Trading Fakeouts as a Strategy
Instead of avoiding fakeouts, some traders specialize in trading them. Fakeout trading involves entering in the opposite direction once price fails to hold beyond a key level.
For example:
Price breaks above resistance
Fails to hold and closes back below
Seller enters short with stop above the fake breakout high
This strategy works best in range-bound markets and requires patience and strict risk control.
Risk Management in Breakout and Fakeout Trading
Risk management is crucial because not all breakouts will succeed. Traders should:
Risk only a small percentage of capital per trade
Use predefined stop-loss levels
Avoid overtrading multiple breakouts at once
Maintain a favorable risk–reward ratio (at least 1:2)
Without proper risk management, even a high win-rate strategy can result in losses.
Psychology Behind Breakouts and Fakeouts
Breakout trading tests trader psychology. Fear of missing out (FOMO) often pushes traders to enter too early, while fear of loss causes premature exits. Fakeouts exploit emotional decision-making, especially among inexperienced traders.
Successful traders remain disciplined, wait for confirmation, and accept that losses are part of the process. Emotional neutrality and consistency are more important than predicting every move correctly.
Best Timeframes for Breakout Trading
Breakouts occur on all timeframes, but their reliability varies. Higher timeframes (daily, weekly) tend to produce more reliable breakouts due to institutional participation. Lower timeframes (5-minute, 15-minute) have more noise and fakeouts but offer more frequent opportunities.
Traders should align breakout strategies with their trading style—scalping, day trading, or swing trading.
Breakouts in Different Markets
Stocks: Earnings, news, and sector momentum often drive breakouts
Forex: Breakouts frequently occur around sessions opens and macro news
Commodities: Supply-demand imbalances and global events fuel strong moves
Options: Breakouts often lead to volatility expansion, benefiting option buyers
Understanding market-specific behavior improves breakout accuracy.
Conclusion
Trading breakouts and fakeouts is both an art and a science. Breakouts offer the potential for strong trends and high rewards, while fakeouts serve as reminders that markets are unpredictable and often deceptive. The key to success lies in confirmation, context, and discipline.
By combining price action, volume analysis, market structure, and solid risk management, traders can improve their ability to identify genuine breakouts and avoid common traps. Rather than trying to be right every time, successful traders focus on consistency, probability, and long-term growth.

Option Trading Strategies for Smart Market Participation1. What Are Option Trading Strategies?
Option trading strategies are planned combinations of call and put options.
They are designed to control risk, reduce cost, and improve probability.
Each strategy matches a specific market condition—bullish, bearish, neutral, or volatile.
The goal is not prediction, but risk-adjusted profitability.
2. Core Building Blocks of Options
Call Option: Profits when price moves upward.
Put Option: Profits when price moves downward.
Strike Price: Pre-decided buy/sell price.
Expiry Date: Time limit for the option.
Premium: Cost paid or received for the option.
3. Bullish Option Strategies (Rising Market)
Long Call
Buy a call option when expecting strong upside.
Risk is limited to premium; profit potential is unlimited.
Bull Call Spread
Buy lower strike call, sell higher strike call.
Lower cost and controlled risk with limited profit.
Cash-Secured Put
Sell put to earn premium while planning to buy stock at lower price.
4. Bearish Option Strategies (Falling Market)
Long Put
Buy put when expecting sharp downside.
Limited risk with high profit potential.
Bear Put Spread
Buy higher strike put, sell lower strike put.
Ideal for moderate downtrend with reduced cost.
Call Credit Spread
Sell call spread to benefit from falling or stagnant prices.
5. Sideways Market Strategies (Range-Bound Market)
Covered Call
Hold stock and sell call for regular income.
Iron Condor
Sell out-of-the-money call and put spreads.
Profits from low volatility and time decay.
Short Strangle (Advanced)
Sell OTM call and put when market is stable.
6. Volatility-Based Strategies (Big Move Expected)
Long Straddle
Buy call and put at same strike.
Profits from strong movement in any direction.
Long Strangle
Buy OTM call and put; cheaper than straddle.
Calendar Spread
Profit from changes in volatility and time decay.
7. Option Selling Strategies (Time Decay Advantage)
Sellers benefit from Theta (time decay).
Credit Spreads offer limited risk with consistent income.
High probability strategies when market remains stable.
Requires strong risk management and margin control.
8. Role of Option Greeks in Strategies
Delta: Measures price sensitivity.
Theta: Measures time decay (favors sellers).
Vega: Measures volatility impact.
Gamma: Measures speed of Delta change.
Greeks help select, manage, and adjust strategies.
9. Risk Management in Option Trading
Always use defined-risk strategies.
Risk only 1–2% of capital per trade.
Avoid naked selling without protection.
Set predefined exit rules.
Adjust positions instead of panicking.
10. Capital Allocation & Position Sizing
Diversify across multiple strategies and expiries.
Avoid all-in trades.
Keep cash reserve for adjustments.
Focus on consistency, not jackpots.
11. Psychological Discipline in Options
Small frequent losses are normal.
Avoid revenge trading.
Follow strategy logic, not emotions.
Patience and discipline beat prediction skills.
12. Adapting Strategies to Market Conditions
High volatility → Prefer option selling after spike.
Low volatility → Buy options or calendar spreads.
Trending market → Directional spreads.
Sideways market → Income strategies.
13. Beginner vs Professional Approach
Beginners should start with spreads and hedged strategies.
Professionals focus on probability, risk-reward, and consistency.
Strategy selection matters more than market prediction.
14. Key Advantages of Option Trading Strategies
Limited and defined risk.
Profit in any market condition.
Lower capital requirement.
Multiple ways to adjust losing trades.
Income generation opportunity.
15. Final Conclusion
Option trading strategies are not about complexity—they are about structure, discipline, and probability. When used correctly, they allow traders to control risk, adapt to market behavior, and build consistent returns over time. Success in options comes from understanding strategy logic, respecting risk, and maintaining emotional discipline. Master these elements, and option trading becomes a powerful weapon in your trading journey.

Part 2 Candle Stick PatternsOption Expiry Types
Options expire on:
Weekly expiry (popular for indices like NIFTY)
Monthly expiry
Quarterly expiry
As expiry nears:
Premium decay accelerates
Volatility spikes
Price movements become sharper

PCR Trading Strategies Risks in Option Trading
Despite advantages, options carry risks:
Time decay can erode premium quickly
Overtrading leads to losses
Emotional decisions during volatility
Option selling without hedging can cause heavy drawdowns
Proper position sizing, stop-loss, and discipline are essential.

Part 2 Support and Resistance Option Premium
The option premium is the price paid by the buyer to the seller (writer) of the option.
Premium consists of:
Intrinsic Value – Real value if exercised now
Time Value – Value based on time remaining until expiry
As expiry approaches, time value decreases, a phenomenon known as time decay (Theta).

Part 1 Support and Resistance Put Option Explained
A Put Option gives the buyer the right to sell the underlying asset at a fixed price before or on expiry.
Example:
If NIFTY is trading at 22,000 and you buy a 21,800 Put Option, you expect the market to move down.
If NIFTY falls to 21,500 → You profit
If NIFTY stays above 21,800 → Option may expire worthless
Maximum loss = Premium paid
Profit potential = High but limited
Put options are used when traders are bearish or want to protect their portfolio from downside risk.

Part 11 Trading Master ClassWhat Is an Option?
An option is a derivative contract whose value is derived from an underlying asset such as:
Stocks
Indices
Commodities
Currencies
Each option contract is defined by:
Underlying asset
Strike price
Expiry date
Option premium
There are two main types of options:
Call Option
Put Option

Trading the Future of Financial MarketsUnderstanding Futures Contracts
A futures contract is a standardized agreement traded on an exchange. It specifies the underlying asset, quantity, quality, expiration date, and settlement method. Because contracts are standardized, they are highly liquid and transparent. Futures can be settled either by physical delivery (common in commodities like crude oil or agricultural products) or by cash settlement (common in index futures).
One of the defining features of futures trading is leverage. Traders are required to deposit only a fraction of the contract’s total value as margin. This enables participation with relatively lower capital, but it also amplifies both profits and losses. Therefore, futures trading demands a strong understanding of risk management.
Types of Futures Markets
Futures trading spans multiple asset classes:
Commodity Futures: Include agricultural products (wheat, rice, cotton), energy (crude oil, natural gas), and metals (gold, silver, copper).
Equity Index Futures: Such as NIFTY, BANK NIFTY, S&P 500, and Dow Jones futures, which track stock market indices.
Currency Futures: Allow trading in currency pairs like USD/INR or EUR/USD.
Interest Rate Futures: Based on bonds or treasury instruments, widely used by institutional participants.
Each market serves different participants, from farmers and manufacturers hedging price risks to traders seeking short-term opportunities.
Participants in Futures Trading
Futures markets attract a diverse set of participants:
Hedgers use futures to protect against adverse price movements. For example, a farmer may sell futures to lock in crop prices, while an airline may buy fuel futures to hedge fuel costs.
Speculators aim to profit from price fluctuations. They assume risk in exchange for potential returns and provide liquidity to the market.
Arbitrageurs exploit price differences between spot and futures markets or across exchanges to earn low-risk profits.
The interaction of these participants ensures efficient price discovery.
Advantages of Futures Trading
Futures trading offers several advantages:
Leverage allows traders to control large positions with limited capital.
Liquidity ensures easy entry and exit in popular contracts.
Two-way trading enables profit opportunities in both rising and falling markets.
Price discovery helps markets reflect future expectations of supply and demand.
Hedging efficiency provides businesses and investors with tools to manage uncertainty.
These benefits make futures trading attractive, but they also require discipline and knowledge.
Risks Involved in Futures Trading
Despite its advantages, futures trading carries significant risks:
High leverage risk can lead to substantial losses if the market moves against the position.
Margin calls require additional funds if losses exceed initial margins.
Market volatility can cause rapid price swings, especially around economic data or geopolitical events.
Overtrading and emotional decisions often result in poor outcomes for inexperienced traders.
Understanding these risks is essential before entering the futures market.
Futures Trading Strategies
Successful futures trading relies on well-defined strategies:
Trend following focuses on identifying and trading in the direction of prevailing market trends.
Range trading works in sideways markets by buying near support and selling near resistance.
Spread trading involves taking opposite positions in related contracts to reduce risk.
Hedging strategies aim to offset potential losses in spot positions.
Scalping and intraday trading seek small profits from short-term price movements.
Each strategy requires different time horizons, skills, and risk tolerance.
Role of Technical and Fundamental Analysis
Futures traders commonly use both technical and fundamental analysis. Technical analysis involves studying price charts, indicators, and patterns to predict future price movements. Fundamental analysis examines economic data, supply-demand dynamics, interest rates, inflation, and global events. Combining both approaches often leads to better decision-making.
Importance of Risk Management
Risk management is the backbone of futures trading success. This includes setting stop-loss levels, maintaining proper position sizing, avoiding excessive leverage, and diversifying trades. A disciplined trader focuses on capital preservation first, knowing that consistent profits come over time rather than from single trades.
Conclusion
Futures trading is a powerful financial tool that shapes global markets and offers opportunities for hedging and speculation. While it provides high liquidity, leverage, and flexibility, it also demands deep market understanding, emotional discipline, and strict risk control. For traders who invest time in learning market behavior, developing strategies, and managing risk effectively, futures trading can be a valuable component of a long-term trading or investment journey. However, beginners should approach it cautiously, gain experience gradually, and treat futures trading not as gambling, but as a structured and professional market activity.

Master Your Trading MindsetThe Psychological Edge Behind Consistent Market Success
In the world of trading, strategies, indicators, and market knowledge are important, but they are not the ultimate deciding factors between success and failure. The true differentiator is mindset. Many traders enter the markets believing that mastering technical analysis or finding a perfect strategy will guarantee profits. Over time, they discover a hard truth: trading is less about predicting the market and more about controlling oneself. To master your trading mindset is to build emotional discipline, mental clarity, and psychological resilience that allow you to perform consistently in an uncertain and often stressful environment.
Understanding the Role of Mindset in Trading
Markets are driven by human behavior—fear, greed, hope, and panic. As a trader, you are not just analyzing price charts; you are also participating in a collective psychological game. Every decision you make is influenced by emotions, whether you realize it or not. A strong trading mindset allows you to observe these emotions without being controlled by them. Instead of reacting impulsively to market noise, you respond logically based on your trading plan.
Many traders fail not because their analysis is wrong, but because their emotions interfere at critical moments. They exit winning trades too early due to fear, hold losing trades too long due to hope, or overtrade after a loss in an attempt to recover quickly. Mastering your mindset means recognizing these emotional traps and building habits that protect you from them.
Discipline: The Foundation of a Strong Trading Mindset
Discipline is the backbone of successful trading. It means following your trading plan consistently, regardless of recent wins or losses. A disciplined trader understands that no single trade defines success. Instead, success comes from executing a proven process repeatedly over time.
Without discipline, even the best strategy becomes useless. Traders often break rules when emotions rise—moving stop losses, increasing position size impulsively, or entering trades without proper confirmation. A strong mindset keeps discipline intact, reminding you that long-term survival is more important than short-term excitement.
Managing Fear and Greed
Fear and greed are the two dominant emotions in trading. Fear can stop you from entering good trades, cause premature exits, or lead to hesitation. Greed, on the other hand, pushes traders to overtrade, take excessive risk, or ignore exit signals in the hope of bigger profits.
Mastering your mindset involves finding balance. You must accept risk as a natural part of trading and become comfortable with uncertainty. Losses are not failures; they are business expenses. When you truly accept this, fear loses its grip. Similarly, controlling greed requires understanding that markets will always provide opportunities. Missing one trade is insignificant compared to protecting your capital and confidence.
Developing Emotional Resilience
Trading is emotionally demanding. Drawdowns, losing streaks, and unexpected market moves are inevitable. Emotional resilience is the ability to stay focused and confident despite these challenges. Traders with strong resilience do not let a losing streak damage their self-belief or push them into revenge trading.
Resilient traders review losses objectively, learn from mistakes, and move forward without emotional baggage. They understand that confidence should come from process, not outcomes. When you trust your system and execution, temporary setbacks no longer feel personal.
Patience and the Art of Waiting
One of the most underrated skills in trading is patience. Markets do not offer high-quality opportunities all the time. Many losses occur simply because traders feel the need to be active. A strong trading mindset embraces waiting as a strategic advantage.
Patience means waiting for clear setups, proper risk-reward conditions, and favorable market environments. It also means letting trades play out according to plan instead of interfering emotionally. In trading, doing nothing is often the most profitable decision.
Building Consistency Through Routine
A professional mindset treats trading as a business, not a gamble. This requires routine and structure. Pre-market preparation, post-trade reviews, journaling, and regular performance evaluation are essential habits. These routines create mental stability and reduce emotional decision-making.
A trading journal, in particular, is a powerful tool for mindset development. By recording not only trades but also emotions and thoughts, you gain awareness of psychological patterns that affect performance. Over time, this self-awareness leads to better emotional control and consistency.
Letting Go of Perfection
Perfectionism is a hidden enemy in trading. Many traders constantly search for flawless entries, zero losses, or a “holy grail” strategy. This mindset creates frustration and unrealistic expectations. The reality is that losses are unavoidable, and even the best traders are wrong frequently.
Mastering your trading mindset means accepting imperfection. You focus on probabilities, not certainty. Your goal is not to win every trade, but to manage risk effectively and let your edge play out over a series of trades.
Confidence Rooted in Preparation
True trading confidence does not come from recent profits; it comes from preparation and experience. When you have a clear plan, tested strategy, and defined risk rules, confidence naturally follows. This confidence allows you to execute trades without hesitation or emotional conflict.
Overconfidence, however, is dangerous. A strong mindset maintains humility, respecting the market at all times. Confident traders trust their skills but never underestimate risk.
Long-Term Thinking and Growth
Finally, mastering your trading mindset requires a long-term perspective. Trading success is a journey of continuous learning and psychological growth. Every market phase, win, and loss contributes to your development as a trader.
Instead of focusing solely on profits, focus on becoming a better decision-maker. When your mindset improves, results follow naturally. Trading then becomes not just a way to earn money, but a discipline that builds patience, self-control, and emotional intelligence.
Conclusion
To master your trading mindset is to gain the most powerful edge in the markets. Strategies may change, markets may evolve, but psychological strength remains timeless. By developing discipline, managing emotions, building resilience, and thinking long-term, you transform trading from a stressful struggle into a structured, professional pursuit. In the end, the market is not your biggest challenge—you are. When you master your mindset, consistent success becomes possible.
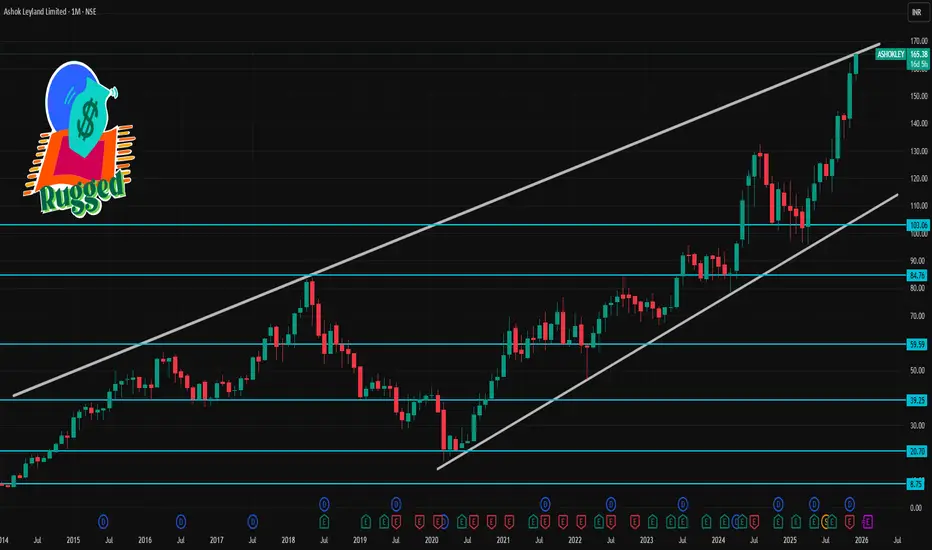
ASHOKLEY 1 Month Time Frame 📊 Current Price & Trend (as of latest market close)
Current trading level: ~₹163‑164 on NSE.
Price has rallied strongly and recently hit a 52‑week/all‑time high.
📈 1‑Month Key Levels (Short‑Term Technicals)
🔹 Immediate Resistance (Upside Targets)
R1 ~ ₹165‑167: Short‑term pivot resistance zone.
R2 ~ ₹167‑170: Key near‑term resistance above current.
R3 ~ ₹170‑176: Stronger upside area (if momentum continues).
🔻 Immediate Support (Downside Floors)
S1 ~ ₹161: Nearest short‑term support.
S2 ~ ₹158: Stronger support zone if price tests lower.
S3 ~ ₹156: Major initial support level before deeper pullback.
🧠 What This Means for 1‑Month Outlook
Bullish case (short term):
Holding above ₹158–161 supports continuation.
Clear break above ₹170–176 with strong volume could extend moves toward new highs.
Bearish/Neutral case:
Failure below ₹156–158 puts pressure on short‑term trend.
RSI nearing overbought suggests a possible pullback or consolidation first.
PARAGMILK 1 Week Time Frame 📌 Current Price (approx)
~₹315 – ₹320 on NSE (latest trading range)
📊 Weekly Time‑Frame Levels
🔹 Key Weekly Pivot & Levels
These are useful for the next few sessions (week):
Weekly Pivot Point (approx): ~₹318 – ₹320 (central reference for trend this week)
Weekly Support Levels:
S1: ~₹295 – ₹300
S2: ~₹283 – ₹288
S3: ~₹260 – ₹275 (deeper support if heavy pullback)
Weekly Resistance Levels:
R1: ~₹323 – ₹326
R2: ~₹331 – ₹335
R3: ~₹350 – ₹355 (secondary target zone)
(Pivot & weekly support/resistance based on aggregated pivot frameworks)
🔸 Short‑Term/Weekly Trading Zones
Bullish Scenario (uptrend holds):
✔ Stay above ₹320‑318 → next upside targets
→ ₹326‑₹331 (near‑term resistance)
→ ₹345‑₹350+ (medium‑term / breakout target)
Bearish Scenario (correction):
❌ Drop below ₹300‑295 → next support zone
→ ₹283‑₹288
→ ₹260‑₹275 (deeper demand zone)
📉 Simple Pivot Levels (Daily/Shorter)
Daily pivot range for context this week:
R1 ~₹311–₹315
R2 ~₹315–₹320
R3 ~₹320–₹325
S1 ~₹302–₹305
S2 ~₹297–₹300
S3 ~₹292–₹295
(Classic pivot ranges also align with weekly S1/S2)
📅 What to Watch This Week
🔹 Hold above ₹318–₹320: strengthens bullish outlook
🔹 Break below ₹295: possible deeper correction
🔹 Volume & daily closes: confirm breakout or reversal

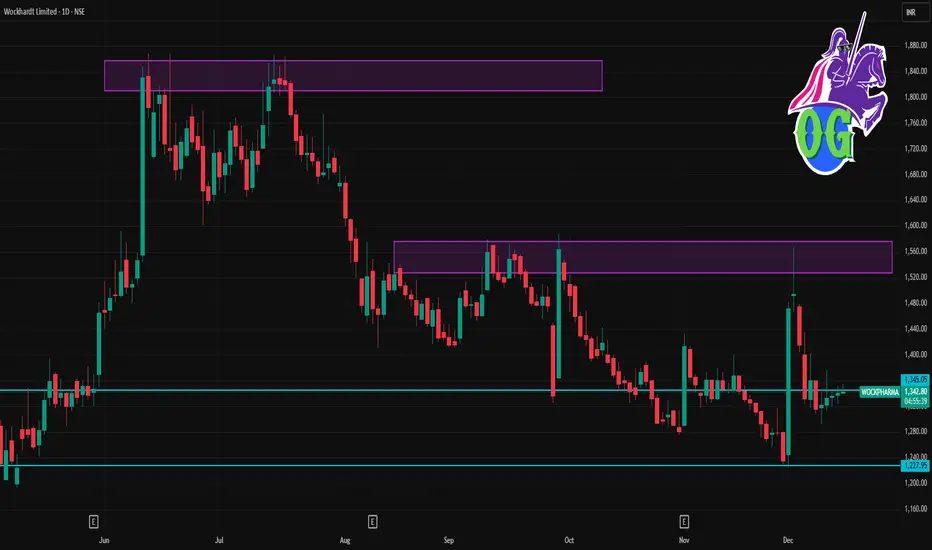
WOCKPHARMA 1 Day Time Frame 📌 Live Current Price (Approx)
≈ ₹1,341 on NSE (latest available market data) 📊
📈 Daily Pivot & Support/Resistance Levels (Today)
Using standard pivot calculation (based on previous day range) — reliable for 1D intraday view:
🔹 Pivot Point (PP): ~ ₹1,360.07
🔹 Resistance Levels:
R1: ₹1,401.93
R2: ₹1,443.87
R3: ₹1,485.73
🔹 Support Levels:
S1: ₹1,318.13
S2: ₹1,276.27
S3: ₹1,234.33
🧠 Alternate Intraday Levels (from technical screener)
Pivot Speed Levels
R1: ~ ₹1,353.53
R2: ~ ₹1,365.87
R3: ~ ₹1,381.13
S1: ~ ₹1,325.93
S2: ~ ₹1,310.67
S3: ~ ₹1,298.33
🔍 Intraday Price Range (Observed Today)
Day’s Low: ~ ₹1,323
Day’s High: ~ ₹1,350+
Managing Trading Risk: Foundation of Long-Term Market SuccessUnderstanding Trading Risk
Trading risk refers to the possibility of losing capital due to unfavorable market movements, poor decisions, or unexpected events. Every trade carries risk, whether in stocks, derivatives, forex, or crypto markets. Market volatility, news events, economic data, and geopolitical factors can cause sudden price fluctuations. A trader’s goal is not to eliminate risk—because that is impossible—but to control and manage it effectively.
Risk management begins with accepting that losses are inevitable. Many beginners enter the market focusing only on profits, ignoring the downside. This mindset often leads to emotional trading, oversized positions, and account blow-ups. Professional traders, on the other hand, think first about how much they can lose before considering how much they can gain.
Capital Preservation Comes First
The primary objective of risk management is capital preservation. Without capital, there is no opportunity to trade. A trader who loses 50% of their account needs a 100% return just to break even. This mathematical reality highlights why controlling losses is more important than chasing big gains.
Successful traders usually risk only a small percentage of their total capital on a single trade, commonly between 1% and 2%. This approach ensures that even a series of losing trades does not significantly damage the trading account. Preserving capital provides the psychological confidence to continue trading rationally rather than emotionally.
Position Sizing and Risk Per Trade
Position sizing is one of the most powerful risk management tools. It determines how many shares, contracts, or lots to trade based on account size and risk tolerance. Proper position sizing aligns the potential loss of a trade with predefined risk limits.
For example, if a trader has a capital of ₹10,00,000 and decides to risk 1% per trade, the maximum loss allowed per trade is ₹10,000. Based on the stop-loss distance, the trader calculates the appropriate position size. This systematic approach removes guesswork and emotional bias from trading decisions.
Ignoring position sizing often leads to overtrading and excessive exposure. Even a high-probability setup can fail, and oversized positions can turn small mistakes into catastrophic losses.
The Role of Stop-Loss Orders
A stop-loss is a predefined price level at which a losing trade is exited automatically. It acts as a safety net, limiting losses and protecting capital. Using stop-loss orders is not a sign of weakness but a mark of discipline and professionalism.
Effective stop-loss placement is based on market structure, volatility, and technical levels rather than arbitrary values. Stops placed too tight may result in frequent premature exits, while stops placed too wide may expose the trader to unnecessary losses. A well-planned stop-loss balances risk control with market behavior.
More importantly, traders must respect their stop-losses. Moving or removing a stop-loss due to hope or fear often leads to larger losses. Discipline in executing stop-losses is essential for consistent performance.
Risk-to-Reward Ratio
The risk-to-reward ratio compares the potential loss of a trade to its potential profit. A favorable risk-to-reward ratio ensures that even if a trader is right only a portion of the time, they can still be profitable.
For instance, a 1:2 risk-to-reward ratio means risking ₹1 to make ₹2. With this ratio, a trader can be profitable even with a win rate below 50%. Focusing on high-quality setups with positive risk-to-reward characteristics helps traders avoid overtrading and low-probability opportunities.
However, risk-to-reward should not be viewed in isolation. It must align with the trader’s strategy, market conditions, and realistic profit targets.
Emotional and Psychological Risk Management
Risk management is not only technical but also psychological. Fear, greed, overconfidence, and revenge trading are major contributors to trading losses. Emotional decisions often lead to breaking rules, increasing position sizes impulsively, and holding losing trades for too long.
Developing a trading plan and strictly following it reduces emotional interference. A clear plan defines entry rules, exit rules, risk limits, and trade management guidelines. Journaling trades and reviewing mistakes also helps traders identify emotional patterns and improve discipline over time.
Maintaining realistic expectations is another key aspect of psychological risk management. Markets do not provide consistent profits every day. Accepting drawdowns as part of the process helps traders stay calm and focused.
Diversification and Exposure Control
Diversification reduces risk by spreading exposure across different instruments, sectors, or strategies. Relying heavily on a single stock, asset class, or market condition increases vulnerability to unexpected events.
However, diversification should be meaningful. Holding multiple positions that are highly correlated does not significantly reduce risk. Traders must monitor overall exposure, especially during volatile periods, to avoid excessive concentration.
Adapting Risk to Market Conditions
Market conditions are dynamic. Volatility levels, liquidity, and trend strength change over time. Effective risk management requires flexibility. During high-volatility periods, reducing position size or tightening risk limits can protect capital. In stable market environments, traders may cautiously increase exposure within predefined limits.
Ignoring changing conditions and applying the same risk approach blindly can lead to unnecessary losses. Adaptability is a hallmark of experienced traders.
Conclusion
Managing trading risk is the backbone of sustainable success in financial markets. It is not about avoiding losses but about controlling them intelligently. Through capital preservation, proper position sizing, disciplined stop-loss usage, favorable risk-to-reward ratios, emotional control, and adaptability, traders can survive market uncertainty and grow steadily over time.
In the long run, consistent risk management matters more than finding the perfect strategy. Markets reward discipline, patience, and respect for risk. Traders who master risk management build resilience, confidence, and the foundation for lasting profitability.

Quarterly Result Trading: Strategy, Opportunities, and RisksUnderstanding Quarterly Results
Quarterly results provide a snapshot of a company’s financial health and operational performance over the previous three months. The most closely watched parameters include:
Revenue (Sales): Indicates business growth and demand.
Net Profit: Reflects overall profitability after expenses.
Operating Margins: Show cost efficiency and pricing power.
Earnings Per Share (EPS): Used for valuation comparisons.
Guidance and Management Commentary: Signals future expectations.
Markets do not react only to absolute numbers; they react to how results compare with expectations. If results exceed expectations, the stock may rally. If they fall short, even slightly, the stock can decline sharply.
Why Quarterly Results Move Stock Prices
Stock prices are forward-looking. Investors and traders price stocks based on future growth prospects rather than past performance. Quarterly results help the market reassess these expectations. A strong result can lead to earnings upgrades, higher valuations, and increased institutional buying. Weak results may trigger downgrades, selling pressure, and loss of confidence.
Additionally, results often resolve uncertainty. Before announcements, traders speculate, leading to volatility. Once results are out, prices adjust quickly to new information.
Types of Quarterly Result Trading Strategies
Pre-Result Trading
Traders take positions before results based on expectations, rumors, sector trends, or analyst forecasts. This strategy aims to capture a price run-up ahead of the announcement. However, it is risky because unexpected numbers can reverse gains instantly.
Post-Result Trading
This involves trading after results are announced, once the market reaction becomes clearer. Traders analyze whether the reaction is justified or overdone. For example, if results are strong but the stock falls due to profit booking, it may present a buying opportunity.
Result Day Momentum Trading
On the day of results, stocks can move strongly in one direction with high volume. Momentum traders ride this move using intraday or short-term setups, relying on price action and volume rather than deep fundamentals.
Expectation vs Reality Trading
Sometimes even good results lead to a fall because expectations were too high. Skilled traders focus on the gap between expectations and actual numbers rather than the numbers alone.
Role of Derivatives in Quarterly Result Trading
Options and futures are widely used during result season due to high volatility.
Options Trading: Traders use strategies like straddles, strangles, and spreads to benefit from volatility without predicting direction.
Futures Trading: Directional traders take leveraged positions expecting a strong move.
However, implied volatility usually rises before results and collapses after the announcement, which can lead to option value erosion. Understanding volatility dynamics is crucial.
Importance of Volume and Price Action
During quarterly results, volume plays a critical role. A price move accompanied by high volume signals strong conviction from institutional players. Breakouts or breakdowns near key support and resistance levels often gain reliability during result-driven moves. Candlestick patterns formed after results can indicate continuation or reversal.
Sector and Market Context
Quarterly result trading should not be done in isolation. Broader market sentiment and sector performance matter. For example, even strong results from a company may not lead to a rally if the overall market is weak or the sector is under pressure. Conversely, average results may lead to a rally in a strong bull market.
Risks in Quarterly Result Trading
High Volatility: Prices can swing sharply within minutes, leading to slippage and losses.
Gap Openings: Stocks may open far above or below the previous close, limiting stop-loss effectiveness.
Emotional Trading: Fast price movements can trigger fear and greed, leading to impulsive decisions.
Information Asymmetry: Institutional investors may interpret results faster and more accurately than retail traders.
False Reactions: Initial market reactions can reverse once detailed analysis emerges.
Risk Management Techniques
Effective risk management is essential in quarterly result trading:
Use strict stop-losses and predefined position sizing.
Avoid over-leveraging, especially in derivatives.
Focus on liquid stocks to reduce slippage.
Trade fewer but high-quality setups rather than chasing every result.
Long-Term vs Short-Term Perspective
While quarterly result trading is mostly short-term, it can also help long-term investors. Consistently strong quarterly performance builds confidence in a company’s growth story. Traders who understand results deeply can transition into positional or swing trades based on improving fundamentals.
Conclusion
Quarterly result trading is one of the most exciting and challenging forms of market participation. It blends fundamentals, technical analysis, market psychology, and risk management. The biggest price moves often occur during result season, but so do the biggest mistakes. Successful traders focus not just on profits and losses, but on expectations, positioning, and disciplined execution. When approached with preparation and caution, quarterly result trading can become a powerful tool in a trader’s overall strategy—but without discipline, it can quickly turn into a high-risk gamble.

Part 6 Institutional Trading Common Option Trading Strategies
a) Basic Strategies
1. Long Call
Used when a trader expects strong upside movement. Risk is limited to the premium paid, while reward potential is theoretically unlimited.
2. Long Put
Used when expecting a sharp decline. Risk is limited to the premium, and profits increase as the underlying falls.
3. Covered Call
Involves holding the underlying stock and selling a call option. It generates regular income but caps upside potential.
4. Protective Put
Buying a put option against an existing long position. This acts as insurance, limiting downside risk.

Part 4 institutional Trading Why Traders Use Options
Option trading serves multiple purposes:
Speculation: Leveraged bets on price direction.
Hedging: Protecting portfolios against adverse price movements.
Income Generation: Earning premiums through option selling.
Risk Management: Structuring trades with defined risk and reward.
Because options can be combined in various ways, traders can design strategies suited for bullish, bearish, or sideways markets.

Part 3 Institutional Trading Understanding Option Trading
An option is a derivative financial contract that gives the buyer the right, but not the obligation, to buy or sell an underlying asset (such as stocks, indices, commodities, or currencies) at a predetermined price (strike price) on or before a specific date (expiry date).
There are two main types of options:
Call Option: Gives the right to buy the underlying asset at the strike price.
Put Option: Gives the right to sell the underlying asset at the strike price.
The buyer pays a premium to the option seller (writer). This premium represents the maximum loss for the buyer and the maximum gain for the seller.
Key components of options include:
Underlying Asset
Strike Price
Expiry Date
Premium
Lot Size
Intrinsic Value and Time Value
Options derive their value from price movement, volatility, time decay, and interest rates, making them multi-dimensional instruments.

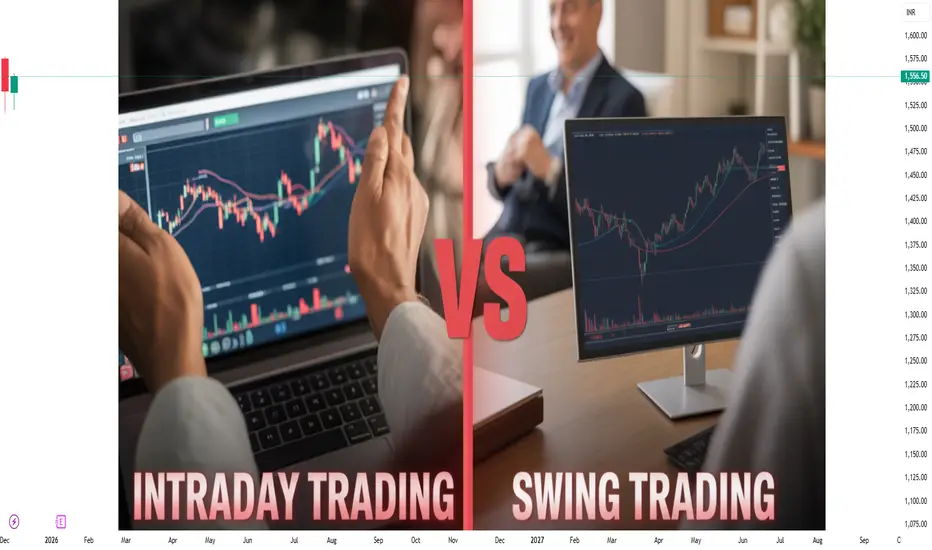
Intraday Trading vs Swing Trading1. What is Intraday Trading?
Intraday trading, also known as day trading, involves buying and selling financial instruments—such as stocks, indices, commodities, or currencies—within the same trading day. All positions are closed before the market closes, and no trades are carried forward to the next day.
Key Characteristics of Intraday Trading
Time frame: Minutes to hours
Holding period: Same day only
Charts used: 1-minute, 5-minute, 15-minute
Objective: Capture small price movements
Frequency: High number of trades
Intraday traders focus on short-term volatility. Even small price changes can result in profits when traded with proper position sizing and leverage.
2. What is Swing Trading?
Swing trading aims to capture short- to medium-term price movements, typically lasting from a few days to several weeks. Traders hold positions overnight and sometimes through market fluctuations to benefit from a “swing” in price.
Key Characteristics of Swing Trading
Time frame: Days to weeks
Holding period: More than one day
Charts used: Daily, 4-hour, weekly
Objective: Capture larger price moves
Frequency: Fewer trades
Swing traders rely more on trend analysis, chart patterns, and broader market structure rather than minute-by-minute price changes.
3. Time Commitment and Lifestyle
Intraday Trading
Intraday trading requires full-time attention during market hours. Traders must constantly monitor price action, news, and order flow. Quick decision-making is critical, leaving little room for error.
Suitable for full-time traders
Demanding and mentally exhausting
Not ideal for those with regular jobs
Swing Trading
Swing trading is more flexible. Trades are planned after market hours, and positions are monitored periodically.
Suitable for part-time traders
Less screen time required
Ideal for working professionals
4. Capital Requirements
Intraday Trading
Intraday trading often requires:
Higher capital for margin trading
Ability to absorb frequent losses
Broker leverage (which increases risk)
Because profits per trade are usually small, traders often increase position size to make meaningful gains.
Swing Trading
Swing trading can be started with:
Relatively lower capital
No dependency on high leverage
Better risk-to-reward ratios
Holding positions for longer allows traders to benefit from bigger price movements without excessive leverage.
5. Risk and Volatility
Intraday Trading Risk
High exposure to market noise
Sudden price spikes due to news or algorithmic trading
Slippage and execution risk
Emotional stress due to fast-moving prices
Even a few seconds of delay can turn a profitable trade into a loss.
Swing Trading Risk
Overnight risk due to gaps caused by news or global markets
Broader stop-loss levels
Lower impact of intraday volatility
While swing traders face gap risk, they are less affected by random intraday fluctuations.
6. Analysis and Strategy
Intraday Trading Strategies
Scalping
Momentum trading
Breakout and breakdown trades
VWAP and volume-based setups
Intraday traders rely heavily on technical indicators, price action, and volume. Fundamental analysis has minimal impact due to the short holding period.
Swing Trading Strategies
Trend-following strategies
Support and resistance trading
Chart patterns (flags, triangles, head & shoulders)
Moving average crossovers
Swing traders combine technical analysis with fundamental cues, such as earnings, sector strength, or macroeconomic trends.
7. Transaction Costs and Brokerage
Intraday Trading
High brokerage due to frequent trading
Exchange fees and taxes add up
Costs can significantly reduce net profitability
Swing Trading
Fewer trades mean lower transaction costs
Easier to maintain consistent profitability
Better cost efficiency
Over time, lower trading frequency can make a substantial difference in returns.
8. Psychology and Emotional Control
Intraday Trading Psychology
Requires extreme discipline
Fear and greed act very quickly
Overtrading is a common problem
Quick losses can lead to revenge trading
Mental fatigue is one of the biggest challenges for intraday traders.
Swing Trading Psychology
More time to think and plan
Less emotional pressure
Requires patience and trust in analysis
Easier to follow predefined rules
Swing trading suits traders who prefer calm, structured decision-making.
9. Profit Potential
Intraday Trading
Daily income potential
Compounding possible with consistent performance
However, consistency is difficult to achieve
Swing Trading
Larger profit per trade
Fewer but more meaningful opportunities
Suitable for wealth-building over time
Both styles can be profitable, but long-term success depends on discipline, risk management, and realistic expectations.
10. Which is Better: Intraday or Swing Trading?
There is no universal “best” trading style. The right choice depends on individual factors:
Factor Intraday Trading Swing Trading
Time availability High Moderate
Stress level Very high Moderate
Capital needed Higher Lower
Holding period Same day Days to weeks
Suitable for beginners Less suitable More suitable
Conclusion
Intraday trading and swing trading are two distinct approaches to market participation. Intraday trading is fast-paced, demanding, and highly stressful but can offer daily income opportunities for disciplined traders with sufficient time and experience. Swing trading, on the other hand, is calmer, more flexible, and better suited for traders who cannot monitor markets constantly.
For beginners and working professionals, swing trading often provides a smoother learning curve and more sustainable results. Intraday trading may be suitable for those who can dedicate full attention to markets and handle intense psychological pressure.
Quantitative Trading: A Comprehensive Explanation1. Introduction to Quantitative Trading
Quantitative trading, often called quant trading, is a trading approach that uses mathematical models, statistical techniques, and computer algorithms to identify and execute trading opportunities in financial markets. Unlike discretionary trading, which relies on human judgment, experience, and intuition, quantitative trading is rule-based, data-driven, and systematic.
In quantitative trading, decisions such as when to buy, when to sell, how much to trade, and how to manage risk are determined by predefined formulas and models. These strategies are widely used by hedge funds, proprietary trading firms, investment banks, and increasingly by retail traders due to advances in technology and data availability.
2. Core Philosophy of Quantitative Trading
The foundation of quantitative trading rests on three key beliefs:
Markets exhibit patterns – Prices, volumes, volatility, and correlations often show recurring behaviors.
These patterns can be measured mathematically – Using statistics, probability, and machine learning.
Automation removes emotional bias – Algorithms execute trades without fear, greed, or hesitation.
The goal is not to predict the future with certainty but to identify probabilistic edges that perform well over a large number of trades.
3. Key Components of Quantitative Trading
a) Data Collection
Quantitative trading begins with data. Common data types include:
Historical price data (open, high, low, close)
Volume and liquidity data
Order book data
Volatility data
Fundamental data (earnings, ratios)
Alternative data (news sentiment, satellite data, social media)
High-quality, clean data is critical because poor data leads to flawed models.
b) Strategy Development
A quant strategy defines precise trading rules. Examples:
Buy when a stock’s 20-day moving average crosses above the 50-day average
Sell when volatility exceeds a certain threshold
Trade mean reversion when prices deviate statistically from historical averages
Strategies are expressed in mathematical or logical form, allowing computers to execute them automatically.
c) Backtesting
Backtesting involves testing a strategy on historical data to evaluate:
Profitability
Drawdowns
Win rate
Risk-adjusted returns (Sharpe ratio)
This step helps determine whether a strategy has a statistical edge or if its performance is random.
d) Risk Management
Risk control is central to quantitative trading. Techniques include:
Position sizing models
Stop-loss and take-profit rules
Portfolio diversification
Maximum drawdown limits
A strong risk framework ensures long-term survival, even during losing streaks.
e) Execution
Execution algorithms place trades efficiently by:
Reducing transaction costs
Minimizing market impact
Optimizing order timing
In high-frequency trading, execution speed measured in milliseconds or microseconds is crucial.
4. Types of Quantitative Trading Strategies
a) Trend-Following Strategies
These strategies aim to profit from sustained price movements.
Use indicators like moving averages, breakout levels, and momentum
Work well in trending markets
Struggle during sideways or choppy markets
Trend following is popular due to its simplicity and long-term robustness.
b) Mean Reversion Strategies
Mean reversion assumes prices eventually return to their historical average.
Buy oversold assets
Sell overbought assets
Based on statistical measures like z-scores and Bollinger Bands
These strategies perform well in range-bound markets.
c) Arbitrage Strategies
Arbitrage exploits price inefficiencies between related instruments.
Statistical arbitrage
Pair trading
Index arbitrage
Though theoretically low risk, arbitrage requires fast execution and large capital.
d) Market-Making Strategies
Market makers provide liquidity by placing buy and sell orders simultaneously.
Earn profits from bid-ask spreads
Heavily dependent on speed and inventory control
These strategies are common among high-frequency trading firms.
e) Machine Learning-Based Strategies
Advanced quant systems use:
Regression models
Decision trees
Neural networks
Reinforcement learning
Machine learning helps uncover non-linear relationships in large datasets, though it increases complexity and overfitting risk.
5. Role of Technology in Quantitative Trading
Technology is the backbone of quant trading. Key elements include:
Programming languages (Python, R, C++)
Databases for storing large datasets
Cloud computing and GPUs
Trading APIs and execution platforms
Automation enables:
24/7 monitoring
High-speed execution
Consistent rule enforcement
Without technology, quantitative trading is practically impossible.
6. Advantages of Quantitative Trading
Emotion-free trading – Eliminates fear and greed.
Consistency – Same rules applied every time.
Scalability – Strategies can be applied across multiple markets.
Backtesting capability – Performance can be tested before risking capital.
Speed and efficiency – Faster reaction to market changes.
These advantages make quantitative trading highly attractive to professional traders.
7. Limitations and Risks of Quantitative Trading
Despite its strengths, quant trading has challenges:
Overfitting – Models may perform well in the past but fail in live markets.
Regime changes – Market behavior changes over time.
Data snooping bias – Excessive testing increases false confidence.
Execution risk – Slippage and latency can reduce profits.
Black swan events – Extreme events may invalidate models.
Successful quant traders continuously adapt and update their strategies.
8. Quantitative Trading vs Discretionary Trading
Aspect Quantitative Trading Discretionary Trading
Decision Making Rule-based Human judgment
Emotion Minimal High
Speed Very fast Slower
Scalability High Limited
Flexibility Lower in real-time Higher
Many modern traders combine both approaches, known as hybrid trading.
9. Quantitative Trading in Modern Markets
Quantitative trading dominates global markets today. A significant portion of equity, futures, forex, and crypto trading volume is generated by algorithms. In India, quantitative strategies are increasingly used in:
Index futures
Options trading
Statistical arbitrage
Volatility strategies
Retail participation is also rising due to affordable data and computing power.
10. Conclusion
Quantitative trading represents the fusion of finance, mathematics, and technology. It transforms trading from an art into a structured scientific process based on probability and data analysis. While it does not eliminate risk, it provides a disciplined framework for identifying and exploiting market inefficiencies.
Success in quantitative trading requires strong analytical skills, robust risk management, continuous research, and the ability to adapt to changing market conditions. As financial markets evolve, quantitative trading will continue to grow in importance, shaping the future of global investing and trading.
Real Kowledge of Chart Pattern Key Principles for Chart Pattern Analysis
A. Trend Context
Patterns are more reliable when analyzed in the context of prevailing trends. For instance, reversal patterns in strong trends may fail without sufficient volume confirmation.
B. Volume Confirmation
Volume often provides confirmation for patterns:
Breakouts with high volume are more reliable.
Low volume breakouts can indicate false signals.
C. Time Frame
Patterns may appear differently across time frames. For example, a double top on a daily chart is more significant than one on a 5-minute chart due to higher trading participation and reduced noise.
D. Pattern Failure
Not all patterns result in expected outcomes. False breakouts or trend reversals can occur due to market news, unexpected events, or low liquidity. Risk management, stop-losses, and position sizing are crucial.

Best Knowledge Of Candle Patterns Single-Candle Patterns
1. Doji:
A Doji forms when the opening and closing prices are virtually identical, resulting in a very small body. It represents indecision in the market. There are variations, such as the Long-Legged Doji, indicating high volatility with indecision, and the Gravestone Doji, often signaling a bearish reversal after an uptrend.
2. Hammer:
A Hammer has a small body near the top of the trading range and a long lower shadow. It typically appears at the bottom of a downtrend and suggests a potential bullish reversal, as sellers pushed the price lower but buyers regained control.
3. Hanging Man:
Resembling the Hammer but occurring after an uptrend, the Hanging Man signals potential bearish reversal. The long lower shadow shows that sellers tried to push the price down, and the market may weaken.
4. Inverted Hammer:
This candle has a small body at the lower end with a long upper shadow, appearing after a downtrend. It indicates potential bullish reversal if followed by confirmation from subsequent candles.
5. Shooting Star:
Opposite of the Inverted Hammer, the Shooting Star appears at the top of an uptrend, signaling a potential bearish reversal. The long upper shadow shows buyers tried to push the price higher but failed.
6. Marubozu:
A Marubozu has no shadows, only a solid body. A bullish Marubozu opens at the low and closes at the high, signaling strong buying pressure. A bearish Marubozu opens at the high and closes at the low, showing strong selling pressure.
