Part 1 Ride The Big Moves Hedging Strategies Using Options
Protective Put
A protective put involves buying a put option against an existing stock position.
Purpose: Portfolio insurance
Cost: Premium paid
Benefit: Downside protection
Used by long-term investors during uncertain markets.
Collar Strategy
A collar combines:
Long stock
Long put
Short call
This caps both upside and downside and is useful during volatile periods.
Trendcontinuation

Part 2 Intraday Master ClassRisk-Defined Spread Strategies
Bull Call Spread
This involves buying a call at a lower strike and selling another call at a higher strike.
Market View: Moderately bullish
Risk: Limited
Reward: Limited
This strategy reduces cost compared to buying a naked call.
Bear Put Spread
A bear put spread involves buying a higher-strike put and selling a lower-strike put.
Market View: Moderately bearish
Risk: Limited
Reward: Limited
It is efficient when a controlled downside move is expected.

Unlocking Market Insights through Volume AnalysisTrading in financial markets is often considered both an art and a science. Among the various analytical tools traders use, volume analysis stands out as a crucial method for understanding market behavior, predicting price movements, and making informed trading decisions. Volume refers to the total number of shares, contracts, or units of an asset traded during a specific time frame. By combining price action with volume, traders can gain insights that are often invisible through price analysis alone.
Understanding Volume in Trading
Volume is essentially a measure of market activity. High trading volume indicates strong participation and interest in a particular security, whereas low volume suggests weak participation. Importantly, volume is not just a number; it reflects the strength or weakness of price movements.
High volume with rising prices typically indicates strong buying interest and can signal the continuation of an upward trend.
High volume with falling prices often signals panic selling or strong bearish sentiment.
Low volume with rising or falling prices may indicate weak conviction, suggesting that the trend may not be sustainable.
Volume analysis is used by both short-term traders, such as day traders and swing traders, and long-term investors. Understanding how to read volume can improve entry and exit timing, risk management, and the identification of market trends.
The Role of Volume in Technical Analysis
Technical analysts use volume to confirm chart patterns, trend reversals, and breakouts. Some of the key methods include:
Volume Confirmation of Trends
A strong trend is often accompanied by increasing volume. For instance, in an uptrend, volume should increase as prices move higher and decrease during minor pullbacks. Conversely, in a downtrend, volume tends to rise on declines and shrink during temporary rallies. This confirms the trend’s legitimacy.
Volume and Breakouts
Breakouts are more reliable when accompanied by a significant increase in volume. If a stock breaks a resistance level on low volume, it could indicate a false breakout. Traders often wait for a spike in volume to confirm the move before entering a position.
Volume Oscillators and Indicators
Several technical indicators help analyze volume, including the On-Balance Volume (OBV), Chaikin Money Flow (CMF), and Volume Weighted Average Price (VWAP). These tools combine price and volume to provide insights about buying and selling pressure.
Volume in Reversal Patterns
Volume plays a key role in identifying reversals. For example, in a double-top pattern, the volume often declines on the second peak, signaling weakening bullish momentum. Similarly, in a head-and-shoulders pattern, rising volume on the breakout confirms the reversal.
Practical Applications of Volume Trading
Volume analysis is not just theoretical; it has practical implications in real trading:
Identifying Institutional Activity: Large institutions, such as mutual funds and hedge funds, leave traces in volume patterns. Sudden spikes in volume without significant news often indicate institutional buying or selling. Retail traders can use this information to anticipate larger market moves.
Improving Entry and Exit Points: Traders can use volume to fine-tune their entry and exit points. Entering trades on low-volume pullbacks in an uptrend reduces risk, while exiting when volume indicates trend exhaustion can protect profits.
Detecting Market Sentiment: Volume reflects market psychology. Rising volume on up moves indicates confidence and optimism, while increasing volume on down moves reflects fear and panic. Traders can gauge sentiment and adjust strategies accordingly.
Supporting Risk Management: Volume can help traders validate stop-loss levels. For example, if a price breaches a support level on high volume, it is more likely a genuine breakdown than a low-volume spike, guiding traders to exit positions promptly.
Volume in Different Market Conditions
Volume analysis can vary depending on market conditions:
Trending Markets: Volume helps confirm the strength of a trend. Traders look for volume expansion during trend continuation and contraction during consolidation periods.
Range-Bound Markets: In sideways markets, volume analysis can identify accumulation (buying) and distribution (selling). A sudden surge in volume at a support or resistance level can hint at a future breakout.
Volatile Markets: During high volatility, volume spikes are common. Traders need to differentiate between normal high-volume fluctuations and significant market moves by considering context and historical volume levels.
Advanced Volume Techniques
Professional traders often combine volume with other tools for a deeper analysis:
Volume Price Trend (VPT): This technique combines price changes with volume to evaluate the strength of a trend.
Volume Spread Analysis (VSA): VSA examines the relationship between volume, price spread, and closing price to detect accumulation or distribution by smart money.
Volume Profiles: These provide a graphical representation of traded volume at different price levels, helping traders identify key support and resistance zones.
Challenges in Trading with Volume
While volume is a powerful tool, it is not foolproof:
Delayed Data: Volume analysis works best with up-to-date and accurate data. Delays in reporting can mislead traders.
Market Manipulation: In some markets, volume can be artificially inflated through wash trades or spoofing, potentially giving false signals.
Context Matters: Volume should always be analyzed in conjunction with price action, market news, and broader economic factors.
Conclusion
Trading with volume is a cornerstone of market analysis. By understanding the relationship between price and volume, traders can gain deeper insights into market dynamics, identify trends, anticipate reversals, and manage risk more effectively. Volume analysis provides a window into market sentiment, revealing the actions of major players and helping traders align their strategies accordingly. While it requires careful observation and practice, mastering volume trading can significantly improve both the accuracy and confidence of trading decisions. For any trader seeking to combine technical analysis with practical market intelligence, volume is an indispensable tool that illuminates the hidden currents beneath price movements.

BTC/USD 1 Day Time Frame Live intraday BTC/USD price (1‑day timeframe): ~$90,368 USD (with a high near ~$92,705 and low near ~$89,560 today) — updated in real‑time.
Real‑time exchange aggregator sites also show similar live ranges:
• BTC ranges roughly $89,500 – $92,700 (24h low/high) on major exchanges.
• Live price data from CoinMarketCap & CoinGecko shows ~$90,100 – $92,300 in recent pricing.
📊 Daily (1D) Key Levels — BTC/USD
Support Levels (bullish buffers where price may bounce):
S1: ~$90,200 – $90,300 — near current trading zone and pivot support.
S2: ~$87,600 – $88,000 — secondary support zone from recent range structure.
S3: ~$85,500 – $86,000 — stronger support if sellers push deeper.
Resistance Levels (sell pressure zones / breakout targets):
R1: ~$94,800 – $95,000 — first upside resistance from pivot targets.
R2: ~$97,000 – $97,500 — medium‑term resistance from recent range highs.
Psychological / higher area: ~$100,000 round number. Traders watch this as a big breakout level if BTC climbs above R2. (Observed market behavior)
📈 Daily Price Range (Current 24h)
Approximate intraday price band:
Low: ~$89,500
High: ~$92,700
This defines today’s 1‑day candle range — useful for intraday support/resistance decisions.

DIXON 1 Week Time Frame 📌 Live Price Snapshot (Approx)
Current price: ~₹13,300–₹13,400 (today range ~₹13,005–₹13,422) — confirms the recent trading zone.
📊 1-Week Pivot / Key Levels
From pivot analysis based on weekly range (TSR pivot data):
Weekly Pivot Levels: (Standard pivot)
Weekly Pivot: ~~₹14,526**
Resistance:
R1: ~₹14,850
R2: ~₹15,388
R3: ~₹15,712
Support:
S1: ~₹13,987
S2: ~₹13,664
S3: ~₹13,125**
These levels are for the entire trading week and act as reference points.
Important intraday/short-term pivot reactions (classic):
R1: ~₹13,673
R2: ~₹13,829
R3: ~₹14,028
S1: ~₹13,318
S2: ~₹13,119
S3: ~₹12,963**
Useful for shorter term intra-week trading thresholds.

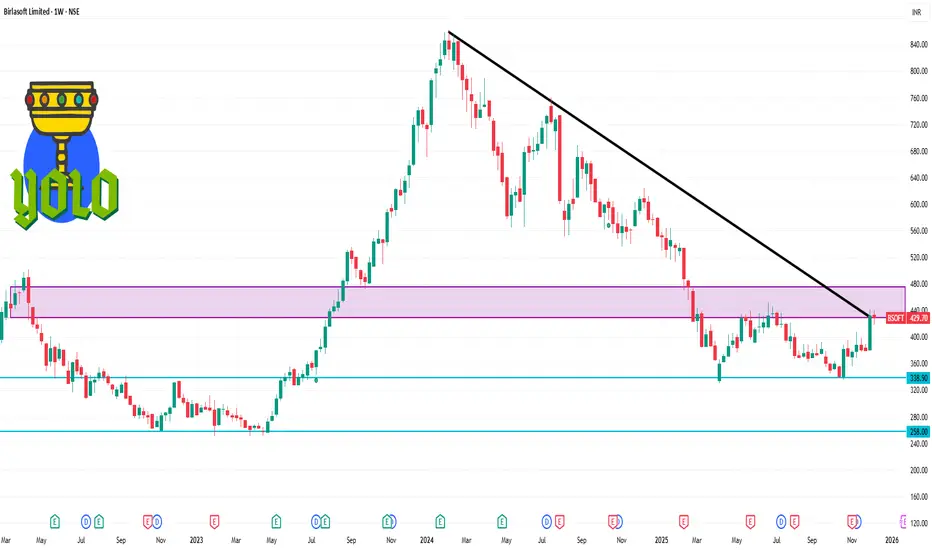
BSOFT 1 Week Time Frame 📌 Current Price Context
• Birlasoft is trading around ₹428–₹430 on NSE (Dec 12 2025).
• On a 1-week basis recently the price moved slightly down (~-0.7%).
📊 Short-Term Levels (1 Week / Swing Trading)
⚡ Immediate Support Levels
These are price zones where buyers may step in if the stock pulls back:
₹425–₹420 — first support zone (near current price cushion).
₹408–₹402 — deeper support zone if weakness extends.
~₹395 — third support level for risk-off moves.
If the price closes below ₹420 weekly, the short-term bias can turn bearish and more downside (toward ₹402–₹395) may unfold.
🚀 Resistance Levels to Watch
These are levels where the stock may struggle to break above:
₹430–₹434 — near current short-term resistance cluster.
₹438–₹443 — next resistance band above.
A clear weekly close above ₹434–₹438 would improve short-term bullish momentum.
📈 Technical Pattern Notes
Some charting interpretations from community and analysts suggest:
A double-bottom base around ₹330 with a neckline near ₹445–₹450, which is a bullish reversal pattern on higher timeframes. A breakout above ~₹450 could signal stronger upside continuation.
Part 1 Candle Stick Patterns How Traders Use Options
a. Directional Trading
Buying call/put based on expected movement.
Example:
If NIFTY is bullish → Buy Call
If NIFTY is bearish → Buy Put
b. Non-Directional Trading
Option sellers earn money when the market stays in a range.
c. Breakout Trading
Buy options during breakout of support/resistance.
d. Hedging
Long-term investors buy puts to protect portfolios.

Part 12 Trading Master Class Buyers vs Sellers
Every option contract has two sides:
Option Buyer
Pays a premium.
Has limited risk (only premium loss).
Has unlimited profit potential.
Needs significant price movement to make money.
Option Seller/Writer
Receives the premium.
Has limited profit (premium received).
Has high or unlimited risk.
Benefits when price stays stable or moves slightly.
Most professional traders prefer selling options because time works in their favour.

Part 11 Trading Master Class Types of Options
There are two basic types:
a) Call Option (CE)
A Call Option gives the right to buy the underlying at a fixed strike price.
Traders buy calls when they expect the price to go up.
Example: Nifty trading at 22,000 → You buy 22,200 CE expecting upside.
b) Put Option (PE)
A Put Option gives the right to sell at a fixed strike price.
Traders buy puts when they expect the price to fall.
Example: Nifty trading at 22,000 → You buy 21,800 PE expecting downside.

Financial Market Types: A Comprehensive Overview1. Capital Markets
Capital markets are financial markets where long-term securities with maturities of more than one year are traded. These markets are crucial for raising funds for long-term investments in projects, infrastructure, and corporate expansion. Capital markets are broadly divided into primary markets and secondary markets.
a. Primary Market
The primary market is also known as the new issue market. In this market, companies and governments raise funds by issuing new securities. Investors purchase these securities directly from the issuer, and the funds raised are utilized for capital expenditure, research and development, or expansion projects. The most common instruments in the primary market include:
Equity shares: Stocks issued by companies to raise ownership capital.
Bonds: Debt instruments issued by corporations or governments.
Debentures and preference shares: Long-term financial instruments that provide fixed income to investors.
The primary market plays a crucial role in facilitating economic growth by channeling savings into productive investments.
b. Secondary Market
Once securities are issued in the primary market, they are traded in the secondary market, also called the stock market. Investors buy and sell existing securities, creating liquidity and price discovery. The secondary market ensures that investors can convert their holdings into cash easily. Prominent examples include:
Stock exchanges: Organized exchanges like the New York Stock Exchange (NYSE), NASDAQ, and National Stock Exchange (NSE) in India.
Over-the-counter (OTC) markets: Decentralized markets where securities are traded directly between parties without an organized exchange.
The secondary market’s efficiency affects the attractiveness of primary market investments, as investors consider the ease of exit before investing.
2. Money Markets
The money market is a segment of the financial market that deals with short-term debt instruments, typically with maturities of less than one year. This market facilitates liquidity management for governments, banks, and corporations. It is considered low-risk and is essential for meeting short-term funding requirements. Key instruments include:
Treasury bills (T-bills): Short-term government securities with maturities ranging from a few days to one year.
Commercial paper (CP): Unsecured short-term debt issued by corporations to meet working capital needs.
Certificates of deposit (CDs): Time deposits issued by banks that offer fixed interest rates.
Repurchase agreements (Repos): Short-term loans backed by securities as collateral.
Money markets are critical for ensuring financial stability, providing a mechanism for central banks to control liquidity and interest rates.
3. Foreign Exchange Markets (Forex)
The foreign exchange market is where currencies are traded. It is the largest financial market in the world, operating 24 hours a day, and plays a vital role in facilitating international trade and investment. Participants include banks, multinational corporations, hedge funds, and individual investors. Major functions include:
Currency conversion: Facilitating global trade by allowing the exchange of one currency for another.
Hedging foreign exchange risk: Protecting businesses and investors from currency fluctuations using forward contracts, options, and swaps.
Speculation: Traders attempt to profit from changes in exchange rates.
The forex market is highly liquid, decentralized, and influenced by economic policies, geopolitical events, and interest rate differentials.
4. Derivatives Markets
Derivatives are financial instruments whose value is derived from an underlying asset, such as stocks, bonds, commodities, currencies, or indices. Derivatives markets provide mechanisms for hedging, speculation, and arbitrage. The two main categories are:
Futures and Forwards: Contracts obligating the purchase or sale of an asset at a predetermined price on a specific future date. Futures are standardized and traded on exchanges, while forwards are customized OTC contracts.
Options: Contracts giving the buyer the right, but not the obligation, to buy or sell an asset at a predetermined price before a specific date.
Swaps: Agreements to exchange cash flows or financial instruments, commonly used for interest rate or currency risk management.
Derivatives markets are critical for risk management in modern financial systems. They allow companies to lock in prices and manage exposure to fluctuating markets.
5. Commodity Markets
Commodity markets are platforms for trading raw materials or primary products. These markets facilitate price discovery, hedging against price volatility, and investment opportunities. They are divided into:
Physical markets: Commodities are bought and sold in tangible form, such as agricultural produce, metals, and energy resources.
Futures markets: Standardized contracts for future delivery of commodities, allowing producers and consumers to hedge against price changes.
Major commodities include gold, silver, crude oil, wheat, and natural gas. Commodity markets are sensitive to supply-demand dynamics, geopolitical events, and global economic trends.
6. Cryptocurrency and Digital Asset Markets
With technological advancement, digital assets like cryptocurrencies, non-fungible tokens (NFTs), and blockchain-based securities have emerged. These markets operate on decentralized platforms, allowing peer-to-peer trading. Key features include:
High volatility: Digital assets can experience rapid price movements.
Decentralization: Transactions are conducted without intermediaries through blockchain technology.
Innovation and adoption: Cryptocurrencies offer alternative investment options and new financial services such as decentralized finance (DeFi).
Though relatively new, cryptocurrency markets are increasingly integrated into traditional financial systems.
7. Bond Markets
Bond markets, also known as debt markets, are segments where fixed-income securities are issued and traded. Governments, municipalities, and corporations issue bonds to finance projects. Types of bonds include:
Government bonds: Considered low-risk and issued by national governments.
Corporate bonds: Issued by companies to raise capital; riskier than government bonds.
Municipal bonds: Issued by local authorities to fund public projects.
Bond markets are critical for long-term financing and provide a stable investment option for risk-averse investors.
8. Over-the-Counter (OTC) Markets
OTC markets are decentralized markets where trading occurs directly between two parties without a formal exchange. They handle securities, derivatives, and currencies. OTC markets are flexible, allowing customized contracts, but they carry higher counterparty risk. OTC trading is essential for assets not listed on exchanges and for large institutional transactions.
9. Interbank Markets
Interbank markets are specialized markets where banks lend to and borrow from one another to manage liquidity. They play a vital role in money market operations and interest rate determination. Instruments traded include overnight loans, certificates of deposit, and foreign exchange swaps. Interbank markets are crucial for banking stability and smooth functioning of the financial system.
10. Emerging Markets
Emerging financial markets refer to rapidly developing economies that are integrating into the global financial system. They offer higher growth potential but carry higher risk due to political, economic, and currency uncertainties. Examples include India, Brazil, and South Africa. These markets include equities, bonds, derivatives, and currency trading and attract both domestic and foreign investors.
Conclusion
Financial markets are the backbone of modern economies, facilitating capital allocation, liquidity, risk management, and economic growth. They range from traditional equity, debt, and money markets to advanced derivative, forex, commodity, and digital asset markets. Each type of market serves a unique function, caters to different participants, and operates under specific regulatory frameworks. By understanding the structure and role of these markets, investors can make informed decisions, companies can access necessary capital, and policymakers can maintain economic stability.
Financial markets continue to evolve with technology, globalization, and innovation. The integration of digital platforms, algorithmic trading, and decentralized finance is transforming traditional market mechanisms, making financial markets more accessible, efficient, and dynamic. For participants, comprehending the diversity and nuances of financial markets is essential to navigate opportunities and risks effectively.

Investing in Shares: A Comprehensive Overview1. Understanding Shares
Shares, also called stocks or equities, are financial instruments that represent ownership in a corporation. Each share entitles the holder to a fraction of the company's profits, typically distributed as dividends, and gives them voting rights in certain corporate decisions, depending on the type of share held. Shares are issued by companies to raise capital for business expansion, research, or debt repayment. In return, investors hope to earn returns through price appreciation and dividends.
There are two primary types of shares:
Common Shares: These represent ordinary ownership. Shareholders have voting rights and may receive dividends, but they are last in line to claim company assets in case of liquidation.
Preferred Shares: These provide a fixed dividend and have a higher claim on assets than common shares. However, preferred shareholders usually lack voting rights.
2. Why Invest in Shares
Investing in shares can offer several benefits:
Potential for Capital Growth: Shares have the potential to appreciate in value over time, allowing investors to sell them at a higher price than the purchase price.
Dividend Income: Companies often distribute a portion of profits as dividends, providing a steady income stream.
Ownership in a Company: Shareholders have a stake in the company, including the right to vote on major corporate matters.
Hedge Against Inflation: Historically, equities have outperformed inflation, helping preserve the purchasing power of money.
Liquidity: Shares traded on stock exchanges can be bought and sold easily, offering high liquidity compared to other investments like real estate.
3. How Share Prices Are Determined
The price of a share is influenced by a combination of factors:
Company Performance: Profits, revenue growth, and business strategies directly impact investor perception and share price.
Market Sentiment: Investors’ collective emotions, confidence, and speculation can drive prices up or down.
Economic Indicators: Interest rates, inflation, and GDP growth affect share valuations.
Industry Trends: Changes in technology, consumer preferences, and competition influence sector performance.
Global Events: Political instability, trade wars, and global economic conditions can significantly impact share prices.
4. Methods of Investing in Shares
There are different ways to invest in shares, depending on risk tolerance, knowledge, and financial goals:
Direct Investment: Purchasing shares of individual companies through stock exchanges using a brokerage account. Investors need to research companies, analyze financials, and monitor market trends.
Mutual Funds: Equity mutual funds pool money from multiple investors to invest in a diversified portfolio of shares. This reduces risk compared to investing in a single stock.
Exchange-Traded Funds (ETFs): ETFs track the performance of an index or sector and can be traded like individual shares. They offer diversification and low cost.
Dividend Reinvestment Plans (DRIPs): Investors reinvest dividends to purchase more shares, enabling compounding growth over time.
Systematic Investment Plans (SIPs): Investing fixed amounts periodically in equity mutual funds to benefit from rupee cost averaging.
5. Analyzing Shares
Before investing, it is crucial to analyze shares using two main approaches:
Fundamental Analysis: This involves evaluating a company’s financial statements, revenue growth, profit margins, debt levels, management quality, and industry position. Key metrics include Price-to-Earnings (P/E) ratio, Earnings Per Share (EPS), Return on Equity (ROE), and dividend yield. Fundamental analysis helps investors determine a company’s intrinsic value and decide whether the stock is overvalued or undervalued.
Technical Analysis: This focuses on historical price movements, trading volumes, and chart patterns to predict future price trends. Tools like moving averages, support and resistance levels, and momentum indicators are commonly used by traders. Technical analysis is particularly popular for short-term trading strategies.
6. Risk and Reward in Share Investing
Investing in shares involves a trade-off between risk and reward:
Market Risk: Stock prices can fluctuate due to overall market movements or economic conditions.
Company-Specific Risk: Poor management, product failures, or regulatory issues can negatively impact a company’s stock.
Liquidity Risk: Some stocks may be difficult to sell quickly without affecting the price.
Volatility: Share prices can experience rapid ups and downs, especially in emerging markets or high-growth sectors.
Mitigating Risk: Diversification, long-term investment horizons, and informed decision-making reduce risk exposure.
The potential for high returns is higher than traditional investments like fixed deposits or bonds, but so is the risk. Historical data suggests that equities outperform most asset classes over long periods, making them suitable for wealth creation.
7. Strategies for Share Investing
Successful investors adopt strategies based on goals and risk appetite:
Buy and Hold: Investors purchase quality stocks and hold them long-term to benefit from compounding and price appreciation.
Value Investing: Investing in undervalued stocks based on fundamental analysis, a strategy popularized by Warren Buffett.
Growth Investing: Focusing on companies with high growth potential, even if they appear expensive, expecting significant capital appreciation.
Dividend Investing: Prioritizing shares with consistent and high dividend payouts for stable income.
Swing Trading: Short- to medium-term trading based on technical patterns to profit from price fluctuations.
Index Investing: Investing in market indices via ETFs or index funds to replicate overall market performance with minimal effort.
8. The Role of Psychology in Share Investing
Behavioral finance highlights that emotions influence investment decisions. Common psychological pitfalls include:
Herd Mentality: Following the crowd without independent analysis.
Overconfidence: Overestimating one's knowledge or market predictions.
Fear and Greed: Emotional reactions during market volatility can lead to panic selling or excessive risk-taking.
Loss Aversion: Reluctance to sell underperforming stocks, which can magnify losses.
Successful investors maintain discipline, set clear investment goals, and stick to their strategy regardless of short-term market noise.
9. Taxation and Regulatory Considerations
Investing in shares is subject to taxation and regulatory compliance:
Capital Gains Tax: Profits from selling shares may attract short-term or long-term capital gains tax depending on the holding period.
Dividend Distribution Tax: Dividends received are taxed in some jurisdictions.
Regulations: Stock markets are regulated by government authorities (like SEBI in India) to ensure transparency, prevent fraud, and protect investors.
Awareness of these factors helps investors plan their investments efficiently.
10. Conclusion
Investing in shares is both an art and a science, blending financial analysis, market understanding, and behavioral discipline. It offers the potential to grow wealth, generate income, and participate in the growth story of companies. However, it requires knowledge, patience, and risk management. Investors should conduct thorough research, diversify portfolios, and remain focused on long-term objectives to navigate market volatility successfully.
By understanding the fundamentals, adopting effective strategies, and maintaining emotional discipline, investing in shares can become a powerful tool for achieving financial freedom and building lasting wealth. In a world where economic growth is increasingly linked to corporate success, shares remain one of the most accessible and rewarding avenues for individual investors to participate in that growth journey.

Introduction: Understanding Crypto Assets1. Blockchain Fundamentals: The Hidden Architecture
At the heart of crypto assets is blockchain technology—a distributed ledger system. The “secret” here is its simplicity combined with complexity:
Decentralization: Unlike traditional finance, no single entity controls the ledger. Control is distributed across a network of nodes, enhancing security.
Immutability: Once a transaction is recorded, it cannot be altered. This provides transparency and reduces fraud.
Consensus Mechanisms: Proof of Work (PoW) or Proof of Stake (PoS) ensures that network participants agree on the state of the ledger. Understanding these mechanisms can help investors gauge energy efficiency, security, and scalability of a blockchain.
Savvy investors know that not all blockchains are equal; scalability, transaction costs, and governance mechanisms directly influence a crypto asset’s utility and long-term potential.
2. Market Dynamics: Beyond Price Movements
Crypto markets behave differently from traditional equity or forex markets. Some lesser-known secrets include:
Liquidity Pools & Whales: Large holders, or “whales,” can significantly influence prices. Decentralized exchanges (DEXs) use liquidity pools, where the distribution of assets can create volatility or hidden opportunities for profit.
Market Sentiment & Social Media: Crypto markets are highly sentiment-driven. Twitter, Reddit, Telegram, and Discord often act as catalysts for rapid price changes. Early detection of trends on these platforms can be profitable.
Cyclicality: Crypto often follows market cycles—accumulation, hype, euphoria, and crash. Understanding these cycles allows traders to anticipate potential risk and reward.
A key secret is that volatility is not inherently bad; it is a tool for strategic positioning if one understands liquidity and sentiment flows.
3. Tokenomics: The Secret Economics
The design of a crypto asset's economy—its tokenomics—determines its value proposition:
Supply Mechanisms: Some coins have fixed supply (e.g., Bitcoin), creating scarcity, while others are inflationary or deflationary.
Utility: Tokens may represent voting rights, staking rewards, transaction fees, or access to services. Understanding a token’s utility is crucial to predicting demand.
Incentive Structures: Many networks reward participation, staking, or liquidity provision. These incentives influence holder behavior and network security.
The secret here is that strong tokenomics often lead to network effects, driving adoption and sustainable price growth.
4. Security & Custody Secrets
Crypto security is an often-overlooked aspect:
Private Keys & Wallets: Owning crypto means controlling private keys. Losing a key means losing access permanently, making personal security paramount.
Hot vs. Cold Storage: Hot wallets are online and convenient but vulnerable to hacking. Cold wallets are offline and secure but less liquid.
Smart Contract Risk: DeFi protocols rely on smart contracts. Bugs or exploits can drain funds instantly. Audited contracts mitigate risk but are not foolproof.
A secret many beginners miss: security lapses, not market moves, are the leading cause of losses in crypto.
5. Psychological Secrets of Crypto Trading
Emotional intelligence is crucial in crypto trading:
Fear of Missing Out (FOMO): Rapid price increases trigger impulsive buying. Savvy traders anticipate FOMO cycles and position themselves in advance.
Fear, Uncertainty, and Doubt (FUD): Negative news can induce panic selling. Long-term investors often exploit FUD-driven dips.
Cognitive Biases: Overconfidence, herd mentality, and anchoring affect decision-making. Recognizing these biases is essential to maintaining rational trading behavior.
The secret is that crypto is as much a psychological battlefield as it is a financial market.
6. DeFi, NFTs, and Emerging Assets
The crypto world is evolving beyond simple currencies:
Decentralized Finance (DeFi): Offers lending, borrowing, and yield farming without intermediaries. Secrets include yield optimization strategies, impermanent loss management, and governance participation.
Non-Fungible Tokens (NFTs): Represent ownership of digital assets. Market success depends on community adoption, rarity, and cultural relevance.
Layer 2 Solutions & Interoperability: Assets that solve scaling and cross-chain challenges have hidden growth potential. Technologies like rollups, sidechains, and bridges create opportunities for early adoption.
Understanding these emerging segments can give investors a competitive edge before mass adoption occurs.
7. Regulatory & Institutional Influence
Crypto assets exist in a fluid regulatory environment. Secrets include:
Regulatory Arbitrage: Some projects thrive in crypto-friendly jurisdictions, while others face restrictions. Awareness of regulations can prevent legal and financial pitfalls.
Institutional Participation: Large financial institutions entering crypto markets influence liquidity, volatility, and market confidence.
Taxation & Compliance: Different jurisdictions treat crypto differently. Strategic planning can maximize gains and minimize tax liabilities.
Ignoring regulatory trends is a common mistake that can destroy profits or even lead to legal trouble.
8. Mining, Staking, and Network Participation
Mining Secrets: Proof of Work coins like Bitcoin require computational power. Mining profitability depends on electricity costs, hardware efficiency, and network difficulty.
Staking Secrets: Proof of Stake coins reward users for locking their tokens. Staking can yield passive income but comes with risks like slashing.
Governance Participation: Active involvement in protocol decisions can shape the future of the network and provide strategic insight into token value.
These mechanisms are often overlooked by casual investors but are crucial for long-term engagement.
9. Common Pitfalls and Hidden Risks
Scams and Rug Pulls: High-yield promises and anonymous teams can indicate fraud. Research and community validation are essential.
Illiquidity: Some assets may be hard to sell without affecting the price. Avoid assets with low volume unless prepared for long-term holding.
Technical Complexity: Mistakes in transactions, contract interactions, or wallet management can lead to irreversible losses.
The secret is simple: due diligence and skepticism are more valuable than luck in crypto investing.
Conclusion: The Crypto Secret Sauce
The real “secrets” of crypto assets are not mystical—they are a combination of understanding technology, market psychology, tokenomics, security, regulatory frameworks, and emerging trends. Successful crypto investors and traders:
Treat blockchain technology as a tool, not a trend.
Study market sentiment and cycles to anticipate opportunities.
Analyze tokenomics to gauge long-term sustainability.
Prioritize security and risk management above speculation.
Manage psychological biases to prevent impulsive mistakes.
Explore DeFi, NFTs, and layer 2 innovations strategically.
Stay aware of regulatory developments and institutional activity.
In essence, crypto rewards knowledge, discipline, and foresight. Those who master these “secrets” navigate the market more effectively, turning volatility from a threat into an opportunity.

Volume Profile and Market Analysis: A Comprehensive Guide1. Introduction to Volume Profile
Volume Profile is a graphical representation that shows the amount of trading volume that occurred at specific price levels over a given period. Unlike standard volume indicators that display total volume per time period (bars or candles), Volume Profile organizes volume price-wise, highlighting where trading activity has been concentrated.
Key elements of a Volume Profile include:
Point of Control (POC): The price level with the highest traded volume, representing an area of significant interest or consensus between buyers and sellers.
Value Area (VA): The price range where a significant portion of total volume (usually 70%) occurs. This area helps identify fair value for the asset.
High Volume Nodes (HVN): Price zones with high trading activity, often acting as strong support or resistance.
Low Volume Nodes (LVN): Price zones with low trading activity, indicating potential breakout or rejection areas.
By focusing on volume at price rather than volume over time, traders gain a clearer understanding of market sentiment, institutional activity, and potential future price behavior.
2. Importance of Volume Profile in Market Analysis
Volume Profile provides structural clarity that other indicators often miss:
Identifying Key Levels: Volume Profile highlights areas where the market participants have shown the highest interest, forming natural support and resistance zones.
Understanding Market Sentiment: A market trading above its Value Area suggests bullish sentiment, while trading below indicates bearish sentiment.
Spotting Imbalances: Low-volume areas often indicate price rejection or gaps in trading activity, suggesting potential areas for rapid price movement.
Assisting Risk Management: Traders can better define stop-loss and take-profit levels based on high-volume nodes, minimizing the risk of being stopped out by normal market fluctuations.
In essence, Volume Profile provides a macro-level view of price acceptance and rejection, enabling traders to anticipate market behavior with higher precision.
3. How Volume Profile Works
To understand the workings of Volume Profile, consider a market like the Nifty 50 or a stock like Reliance.
Step 1 – Data Collection: Volume Profile uses tick-by-tick or minute-by-minute data to calculate total volume at each price level.
Step 2 – Constructing the Profile: For each price level, the cumulative volume is plotted horizontally. This forms a histogram-like structure over the price axis.
Step 3 – Analyzing the Profile: Traders analyze the histogram to find the POC, HVNs, LVNs, and Value Area. The shape of the profile often reveals market sentiment:
D-Shaped Profile: Indicates a balanced market with equilibrium between buyers and sellers. Price tends to oscillate within the Value Area.
P-Shaped Profile: Suggests strong bullish activity with absorption at lower levels and buying pressure pushing prices higher.
b-Shaped Profile: Reflects bearish sentiment, where sellers dominate and price struggles to move higher.
Understanding these shapes allows traders to anticipate whether the market is likely to trend or remain range-bound.
4. Volume Profile in Conjunction with Market Analysis
Market analysis is broadly divided into technical analysis, fundamental analysis, and sentiment analysis. Volume Profile complements all three.
a. Technical Analysis
Volume Profile enhances traditional technical tools like support/resistance, trendlines, and candlestick patterns by adding the dimension of trading activity concentration.
For example, a resistance level confirmed by a high-volume node is significantly stronger than one identified by price action alone.
Traders can also combine Volume Profile with moving averages or RSI to refine entry and exit points.
b. Fundamental Analysis
While fundamentals like earnings, macroeconomic data, or geopolitical events drive long-term price trends, Volume Profile helps gauge the short-term reaction of market participants.
For instance, if positive earnings lead to a price spike but Volume Profile shows rejection at higher levels (low-volume node), traders might anticipate a pullback.
c. Sentiment Analysis
Volume Profile captures the footprints of institutional trading.
Large participants often accumulate or distribute positions at specific price levels, which appear as high-volume nodes.
Observing these nodes provides clues about market psychology and potential directional bias.
5. Practical Applications of Volume Profile
Support and Resistance Identification:
Traders use high-volume nodes as natural support/resistance levels. Breakouts above or below these nodes are considered significant.
Trend Confirmation and Reversals:
If the price stays above the POC and Value Area, the trend is bullish.
If it drops below, the market may be entering a bearish phase.
Entry and Exit Strategies:
Volume Profile allows precise placement of entries and exits. Buying near LVNs or selling at HVNs can enhance reward-to-risk ratios.
Scalping and Intraday Trading:
Intraday traders use Volume Profile to identify areas of liquidity and price acceptance, helping in quick decision-making for short-term trades.
Gap Analysis:
Low-volume areas act as potential “gaps” where price can move rapidly, enabling traders to exploit breakout opportunities.
6. Limitations of Volume Profile
While powerful, Volume Profile is not without limitations:
Requires Accurate Data: Tick-level or high-resolution volume data is essential for precision.
Doesn’t Predict Market Direction: Volume Profile shows areas of interest but cannot guarantee future movement.
Works Best in Liquid Markets: Illiquid assets may produce misleading volume distributions.
Needs Contextual Analysis: Relying solely on Volume Profile without trend, news, or sentiment analysis can lead to poor decisions.
7. Combining Volume Profile with Other Analysis Tools
To maximize its potential, Volume Profile should be used with complementary tools:
Moving Averages: To confirm trend direction relative to high-volume nodes.
Candlestick Patterns: To validate reversals or breakouts at key levels.
Fibonacci Retracements: To identify confluences between retracement levels and high-volume zones.
Order Flow Analysis: To track live buying/selling pressure in relation to Volume Profile levels.
By integrating these tools, traders achieve a multi-dimensional understanding of market structure, enhancing both timing and accuracy of trades.
8. Conclusion
Volume Profile is a critical tool in modern market analysis, bridging the gap between price action and volume dynamics. By highlighting areas where market participants have concentrated their activity, it provides actionable insights into support, resistance, trend strength, and potential breakout zones. When combined with technical, fundamental, and sentiment analysis, it empowers traders to make informed decisions with a structured approach to risk and reward.
Ultimately, mastering Volume Profile requires practice and observation, but once understood, it becomes a powerful lens for seeing the market’s inner workings, allowing traders to anticipate movements rather than react to them. Whether for intraday scalping, swing trading, or long-term investing, Volume Profile remains a cornerstone for serious market participants aiming for consistency and precision in their trading strategies.
Zero-Day Option Trading: A Comprehensive Overview1. Introduction to Zero-Day Options
Zero-Day Option Trading refers to the practice of trading options contracts that expire on the very same day. In standard options trading, contracts may expire weeks or months in the future. However, zero-day options have a life span of only a few hours, typically expiring at the end of the trading day. This makes them extremely sensitive to price movements in the underlying asset, offering both tremendous profit potential and significant risk.
Zero-day options are also referred to as 0DTE (Zero Days to Expiry) options in modern trading parlance. They are primarily available in highly liquid markets, such as the Nifty 50, S&P 500 (SPX), and major stocks in India, the U.S., and other global exchanges.
2. Why Traders Use Zero-Day Options
Traders are attracted to zero-day options because they can leverage time decay (theta) in their favor and profit from intraday volatility without tying up capital for long periods. The key advantages include:
Rapid Profits: Small moves in the underlying asset can lead to large percentage gains in zero-day options due to high gamma sensitivity.
Intraday Hedging: Traders can hedge other positions without holding them overnight.
Speculative Opportunities: Short-term events, such as economic announcements, earnings, or geopolitical news, can create massive price swings that zero-day options can capitalize on.
However, these benefits come with high risks, as prices can also swing against the trader quickly, resulting in total loss of premium paid.
3. Key Characteristics of Zero-Day Options
High Gamma: Gamma measures the rate of change of delta relative to changes in the underlying asset’s price. In zero-day options, gamma is extremely high, meaning the delta (price sensitivity) can change very quickly with small market movements. This creates both fast profits and fast losses.
Accelerated Theta Decay: Theta represents time decay. As zero-day options approach expiration, theta decay is maximal, meaning the option loses value rapidly if the underlying does not move favorably.
High Vega Sensitivity: Vega measures sensitivity to volatility. While zero-day options are highly sensitive to volatility, the effect of volatility diminishes closer to expiration, making timing extremely crucial.
Cost-Efficiency: Compared to longer-dated options, zero-day options often have lower premiums, allowing traders to take positions with smaller capital.
4. Trading Strategies for Zero-Day Options
Zero-day option trading can be approached through multiple strategies, broadly divided into directional and non-directional trades:
A. Directional Strategies
These are used when traders have a strong belief about the market’s intraday movement.
Buying Calls or Puts:
Traders purchase calls if they expect an upward move or puts for a downward move.
Due to high gamma, even small favorable moves can yield significant profits.
The risk is limited to the premium paid, but total loss can happen within hours.
Scalping with Intraday Trends:
Traders use technical indicators like moving averages, RSI, or intraday patterns to enter trades for small moves.
Profits are booked quickly, often within minutes or hours.
B. Non-Directional Strategies
These are used when traders anticipate minimal price movement or high volatility without direction.
Selling Iron Condors:
Traders sell an out-of-the-money call and put while buying a further out-of-the-money call and put to limit risk.
Profit comes from rapid theta decay, which is extremely fast in zero-day options.
Requires careful monitoring as sudden market spikes can lead to losses.
Straddles and Strangles:
Buying straddles or strangles allows profiting from sharp intraday moves regardless of direction.
Expensive in terms of premiums but can pay off if volatility spikes unexpectedly.
5. Risk Management in Zero-Day Options
Zero-day option trading is inherently risky due to the combination of short time horizon, high gamma, and fast theta decay. Effective risk management is crucial:
Capital Allocation: Never invest more than a small portion of your trading capital in zero-day options. Many traders allocate only 1–5% per trade.
Stop Loss Orders: Set intraday stop losses based on price levels or delta changes to prevent catastrophic losses.
Hedging: Use other options or futures positions to hedge large positions.
Avoid Over-Leverage: High leverage can magnify gains but also total losses. Conservative position sizing is critical.
6. Tools and Technical Analysis for Zero-Day Trading
Traders rely heavily on technical analysis for zero-day trades due to the intraday nature:
Intraday Charts: 1-minute, 5-minute, or 15-minute charts are commonly used to spot trends and reversals.
Volatility Indicators: Bollinger Bands, ATR (Average True Range), and Implied Volatility measures help anticipate price swings.
Momentum Indicators: RSI, MACD, and Stochastic Oscillators help gauge overbought or oversold conditions for timing entries.
Order Flow Analysis: Monitoring real-time buy/sell pressure using Level 2 data can provide an edge in fast-moving markets.
7. Common Mistakes in Zero-Day Option Trading
Ignoring Time Decay: Many beginners buy zero-day options without accounting for the rapid loss in value if the underlying doesn’t move.
Overtrading: Frequent trading increases transaction costs and can amplify losses.
Leverage Mismanagement: High leverage in zero-day options can wipe out capital quickly.
Neglecting Volatility Events: Economic news or corporate announcements can cause sudden spikes, which can either make or break trades.
8. Market Examples and Popular Instruments
In India, Nifty 50 0DTE options are widely used by institutional and retail traders. In the U.S., SPX and SPY options are popular zero-day instruments. These markets are chosen due to:
High liquidity ensuring tight spreads
Significant daily volume
Availability of intraday hedging options
9. Psychological Aspects of Zero-Day Trading
Zero-day option trading demands discipline, emotional control, and focus. Traders face intense pressure as prices can move rapidly within minutes. Impulsive decisions often lead to total losses. Developing a calm, rule-based approach is crucial for consistent profitability.
10. Conclusion
Zero-day option trading is a high-risk, high-reward form of derivatives trading that appeals to intraday traders looking for quick profits from price movements and volatility. Success in this domain requires a combination of:
Deep understanding of options Greeks (Delta, Gamma, Theta, Vega)
Strong technical analysis skills
Disciplined risk management
Quick decision-making under pressure
While the potential for profit is attractive, the risk of rapid losses is equally real. As such, zero-day options are best suited for experienced traders who can manage capital, emotions, and strategy execution simultaneously.
In essence, trading zero-day options is not just a financial endeavor; it is a test of skill, discipline, and nerve, offering an intense yet potentially rewarding experience for those prepared to master it.
Part 10 Trade Like Institutions What Are Options?
Options are derivative instruments—their value is derived from an underlying asset such as Nifty, Bank Nifty, stock, commodity, or currency.
An option is a contract that gives the trader:
Right, but not the obligation,
To buy or sell an underlying asset,
At a fixed price (Strike Price),
On or before a specific date (Expiry Date).
Because you have a choice, these instruments are called “Options.”

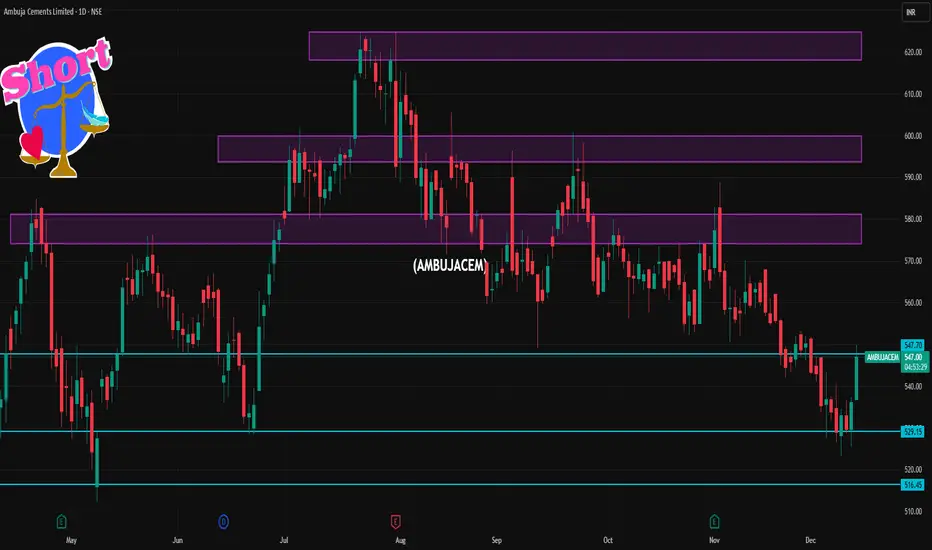
AMBUJACEM 1 Day Time Frame 📌 Current Price (approx)
• Trading around ₹536–₹547 as of today’s session.
📊 Daily Support & Resistance Levels
🔹 Pivot / Key Levels (from technical pivot calculations)
Daily Pivot Zone: ~₹534–₹549
Daily Support Levels:
S1: ~₹531–₹532
S2: ~₹525–₹528
S3: ~₹516–₹521
Daily Resistance Levels:
R1: ~₹540–₹544
R2: ~₹545–₹552
R3: ~₹552–₹559
🔹 Trading Range Today (Observed)
Day Low: ~₹525–₹526
Day High: ~₹537–₹549 range so far.
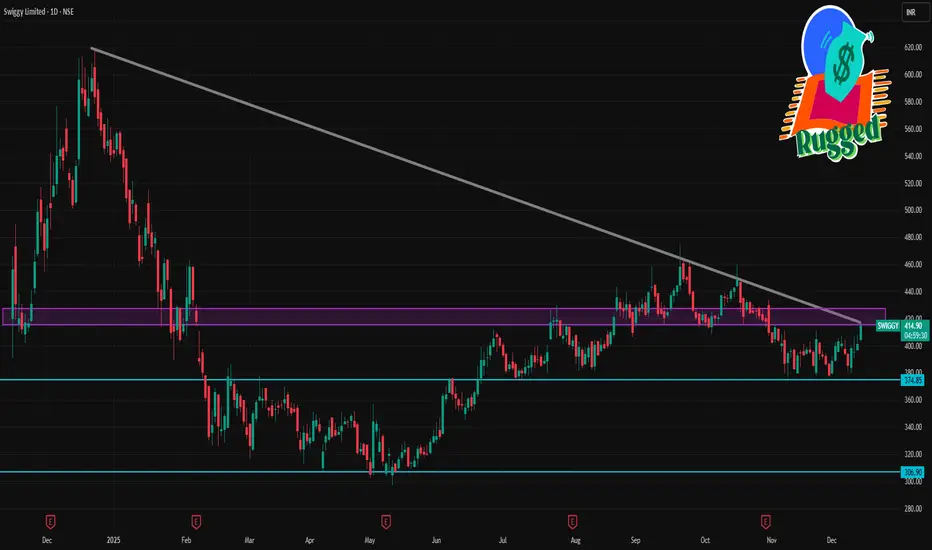
SWIGGY 1 Day Time Frame 📈 Latest Price Context (Today’s Trading)
📍 Approx Live Price: ~₹401 INR on NSE during today’s session with intraday swings between ~₹396 and ₹408.
📊 Daily Support & Resistance Levels (1-Day Chart)
🔹 Key Resistance
R1: ~₹404–₹406 — first resistance from intraday pivot/octave levels.
R2: ~₹409–₹414 — next resistance zone.
R3: ~₹420+ — extended weekly resistance.
🔸 Key Support
S1: ~₹388–₹390 — immediate support area.
S2: ~₹380–₹383 — secondary support closer to recent intraday lows.
S3: ~₹371–₹375 — deeper support if prices break down sharply.
🔁 Pivot
Daily Pivot Point: ~₹397–₹398 zone.
This pivot acts as the centerline bias — above it suggests bullish lean today, below it suggests selling pressure today.
GRANULES 1 Day Time Frame📌 Current Price (approx): ~₹570 – ₹571 (intraday price as of market hours)
🔥 Today’s Key Levels (1-Day Timeframe)
📍 Pivot Levels (Daily)
Based on pivot calculations (classic & Fibonacci based on current price action):
Level Price (Approx)
R3 ~₹577–₹578
R2 ~₹571–₹574
R1 ~₹568–₹572
Pivot (PP) ~₹568
S1 ~₹565
S2 ~₹562
S3 ~₹559
📌 Interpretation:
Above Pivot (~₹568): bullish bias
Below Pivot: risk of short-term weakness

Part 8 Trading Master Class With Experts Understanding Options: A Quick Foundation
An option is a contract giving the buyer the right, but not the obligation, to buy or sell an underlying asset at a fixed price (strike price) on or before expiration.
Call Option → Right to buy
Put Option → Right to sell
Option buyers pay a premium and have limited risk but unlimited or significant upside.
Option sellers (writers) receive the premium but hold potentially large risk.
Strategies combine long/short calls and puts to shape unique payoff structures.

Part 7 Trading Master Class With Experts Option Expiry and Settlement
Options have fixed expiry cycles:
Weekly expiry: For most index options (NIFTY, BANKNIFTY, FINNIFTY).
Monthly expiry: For stock options.
Last Thursday of each month for monthly contracts.
At expiry:
ATM options lose all time value.
ITM options settle for intrinsic value.
OTM options expire worthless.
Time decay accelerates dramatically in the last week.

Part 6 Learn Institutional Trading Buyers vs. Sellers
Option Buyers
Pay premium.
Limited risk (premium only).
Unlimited reward potential.
Low probability of profit (because time decay erodes premium).
Option Sellers (Writers)
Receive premium.
Limited profit (premium only).
Can face huge losses.
High probability of profit (because time decay works in their favor).
Professional traders often prefer selling options, but with strict risk management.

Candle Pattern Practical Tips for Using Candlestick Patterns
Combine with Trend Analysis:
Always consider the prevailing trend. A reversal pattern is more meaningful if it aligns with trend exhaustion signals.
Confirm with Volume:
Higher volume strengthens the validity of candlestick signals.
Use with Technical Indicators:
Combine patterns with moving averages, RSI, MACD, or Fibonacci levels for more reliable entries and exits.
Time Frame Matters:
Patterns are more reliable on higher time frames (daily, weekly) than lower ones (1-minute, 5-minute).
Avoid Over-reliance:
No candlestick pattern guarantees success. Always manage risk with stop-losses and position sizing.

Premium Chart Patterns Practical Application of Chart Patterns
Chart patterns are not foolproof but are valuable tools when combined with other technical indicators. Traders often use volume analysis to confirm pattern breakouts, as significant volume adds credibility to the pattern. Risk management is essential, with stop-loss orders placed strategically around pattern levels. Additionally, price targets can be estimated using pattern height or measured moves, enhancing trade planning.
Limitations of Chart Patterns
Despite their popularity, chart patterns have limitations. They rely on historical price action, which does not guarantee future performance. False breakouts and market noise can mislead traders. Patterns are subjective, and different traders may interpret the same chart differently. Therefore, combining patterns with other technical tools like moving averages, RSI, MACD, and trendlines improves accuracy.
