Part 9 Trading Master Class With Experts What Are Options?
Options are derivative contracts, meaning their value is derived from an underlying asset—most commonly stocks, indices (like Nifty or Bank Nifty), commodities, or currencies.
Every option has two key components:
Strike Price – The agreed price at which the trader can buy or sell the underlying asset.
Expiry Date – The date on which the option contract ends.
Options are of two types:
• Call Option (CE)
A call option gives the buyer the right, but not the obligation, to buy the underlying asset at the strike price before expiry.
You buy a call when you expect price to go up.
• Put Option (PE)
A put option gives the buyer the right, but not the obligation, to sell the asset at the strike price before expiry.
You buy a put when you expect price to fall.
The keyword is right, not an obligation—this makes options different from futures.
Trendcontinuationpatterns

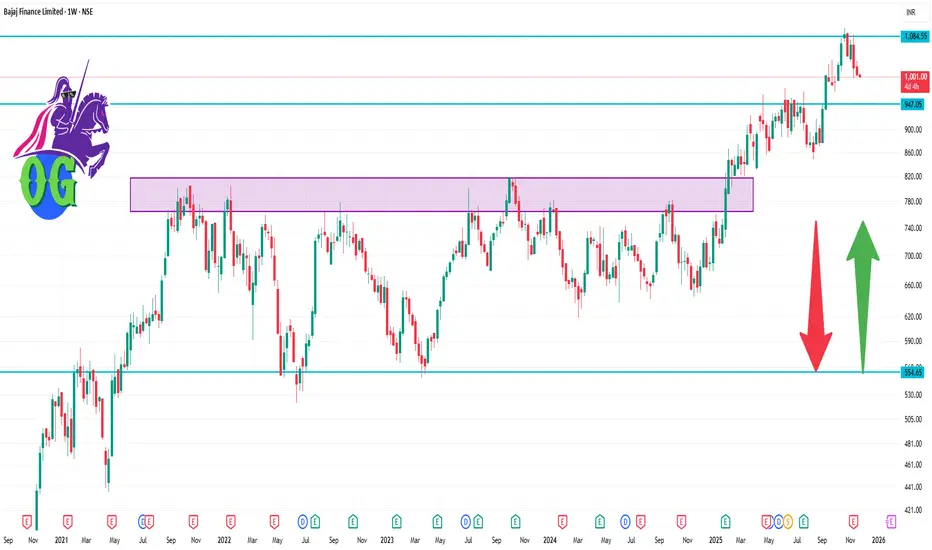
BAJFINANCE 1 Week Time Frame📊 Key Technical Levels
- Current price: ~ ₹1,004 (per Moneycontrol quote)
- Support zone:
~ ₹960-₹970 appears a meaningful near-term support (recent consolidation area)
If breakdown happens, a deeper support around ₹920-₹930 could become relevant
- Resistance zone:
~ ₹1,050-₹1,060 is the first hurdle (recent highs + psychological round number)
A stronger resistance around ₹1,100 (near the 52-week high ~₹1,102.50)
- Range estimate for week:
If neutral: ₹960-₹1,050
If bullish breakout: toward ₹1,100
If bearish breakdown: toward ₹920-₹930 or lower
Why Candlestick Patterns Matter in Trading🔸 Types of Candlestick Patterns
Candlestick patterns can be broadly classified into:
A. Single-Candle Patterns
Hammer
Hanging Man
Inverted Hammer
Shooting Star
Doji
Spinning Top
Marubozu
B. Double-Candle Patterns
Bullish Engulfing
Bearish Engulfing
Piercing Pattern
Dark Cloud Cover
Tweezer Top
Tweezer Bottom
Harami
Harami Cross
C. Triple-Candle Patterns
Morning Star
Evening Star
Three White Soldiers
Three Black Crows
Three Inside Up
Three Inside Down

Smart Loss Management Guide in the Trading Market1. Why Loss Management Is More Important Than Profit-Making
Most new traders focus on making money and ignore risk control. But experienced traders know that your downside determines your survival. If capital is destroyed early, even a good trading system cannot help. Here’s why loss management matters:
Capital Preservation: If you lose 50% of your account, you need a 100% gain to recover. Avoiding deep drawdowns is essential.
Consistency Over Luck: A trader with average profits but disciplined risk control will outperform an aggressive trader without rules.
Uncertainty of Markets: Even the best strategies have losing streaks. Smart loss management keeps you disciplined during uncertain phases.
Simply put, losing small and winning medium-to-large is the essence of profitable trading.
2. Key Principles of Smart Loss Management
2.1 Risk Per Trade Rule
Professional traders follow a simple rule:
Risk only 1–2% of trading capital per trade.
This ensures that even after 10 losing trades in a row, your capital stays strong. A 1% rule means:
If your capital = ₹1,00,000
Max loss per trade = ₹1,000
This protects you from emotional decisions and ensures controlled drawdowns.
2.2 Position Sizing
Position size determines how much quantity you buy or sell. It must be based on:
Stop-loss distance
Capital
Risk per trade percentage
Formula:
Position Size = Risk Amount / Stop-Loss Distance
Example:
Capital = ₹1,00,000
Risk per trade = 1% = ₹1,000
Stop-loss = 5 points
Position size = 1000 / 5 = 200 quantity
This keeps your risk uniform across trades.
2.3 Placing Effective Stop-Loss Orders
Not all stop-losses are equal. Smart traders use:
Technical stop-loss: based on chart levels (support, resistance, swing high/low).
Volatility-based stop-loss: dynamic stops using ATR (Average True Range).
Time-based stop-loss: exit if trade doesn’t work within a fixed time window.
Avoid placing stops too close, which results in premature exits.
2.4 Avoiding Averaging Down
Many traders double their position when price goes against them thinking it will “bounce back”.
This is dangerous.
Averaging down increases exposure when your analysis is already wrong. Professional traders do the opposite—they scale out or exit.
2.5 Maintain Reward-to-Risk Ratio
Every trade must have a minimum Risk-to-Reward (RR) ratio of 1:2 or 1:3.
Example:
If risk = ₹1,000
Target should be ₹2,000 or ₹3,000
This ensures that even with a 40% win rate, you remain profitable.
3. Psychological Pillars of Smart Loss Management
Market losses are emotionally painful. Most poor decisions come from emotions like fear, hope, greed, and frustration. Smart traders master the psychology of loss.
3.1 Accept That Losses Are Normal
Every trader—beginner or expert—has losing trades. Accepting losses helps:
Reduce revenge trading
Maintain discipline
Focus on process, not outcome
3.2 Don’t Take Losses Personally
A losing trade is not a failure of your personality. It is simply part of the game. Traders who attach ego to trades often avoid closing losing positions, leading to bigger losses.
3.3 Control Overtrading
After a loss, many traders try to recover immediately. This emotional urge leads to irrational decisions. Smart loss management requires:
Stop trading after big loss
Follow pre-defined trade limits
Reset emotionally before next trade
3.4 Develop Emotional Discipline
The best loss management tool is self-control. This includes:
Sticking to stop-loss
Avoiding impulsive orders
Following a checklist before entering trades
Discipline converts a strategy into consistent profits.
4. Techniques for Smart Loss Management
4.1 Use Trailing Stop-Loss
Trailing stops help protect profits as the trade moves in your favor. For example:
If trade goes 20 points up, move stop-loss to breakeven
If trade goes 40 points up, trail stop to +20
This locks in gains and avoids giving back profits.
4.2 Hedging Positions
Advanced traders use hedging techniques like:
Options hedging (buying puts to protect long positions)
Futures hedging
Ratio spreads
Hedging reduces the impact of sudden volatility or news events.
4.3 Diversify Trades
Avoid putting all your capital into one trade or one sector. Diversification ensures:
Reduced exposure
Stable overall performance
Lower emotional pressure
But don't over-diversify; focus on 4–8 quality trades.
4.4 Use a Daily Loss Limit
Set a maximum daily loss that stops you from trading further.
Example:
Daily Max Loss = 3% of capital
If you hit that limit, stop trading for the day.
This prevents emotional breakdowns and unnecessary revenge trades.
4.5 Create a Trading Journal
Record:
Entry and exit
Stop-loss
Reason for trade
Emotional state
Reviewing your journal reveals patterns, mistakes, and ways to refine your strategy.
5. Common Mistakes to Avoid
5.1 Moving Stop-Loss Further Away
Traders sometimes shift stop-loss thinking the market will reverse. This is a mistake. A stop-loss must be respected at all times.
5.2 Trading Without a Defined Exit
A trade without a clear exit strategy becomes a gamble. Smart traders pre-plan both stop-loss and target.
5.3 Ignoring Market Conditions
A strategy that works in trending markets may fail in sideways markets. Loss management includes reducing position size during choppy or news-heavy environments.
5.4 Emotions-Based Position Sizing
Increasing lot size after a win or reducing after a loss emotionally disturbs risk management. Position size must always be formula-based.
6. Building Your Smart Loss Management System
Step 1: Define Your Risk Rules
Risk per trade, daily loss limit, maximum open trades.
Step 2: Create Position Sizing Formula
Based on stop-loss distance and capital.
Step 3: Pre-Plan Stop-Loss Levels
Technical, volatility-based, or time-based.
Step 4: Maintain a Journal
Track mistakes, patterns, and improvements.
Step 5: Maintain Emotional Discipline
Follow rules no matter what the market does.
7. Conclusion
Smart loss management is the foundation of profitable trading. Markets reward discipline, not emotion. By controlling risk, using effective stop-loss techniques, maintaining psychological discipline, and applying structured methods, traders protect their capital and grow consistently over time. Every successful trader understands that losses are unavoidable, but big losses are preventable. With a strong loss management system, you turn volatility from a threat into an opportunity and ensure you remain a long-term player in financial markets.
Index Rebalancing Impact1. Why Index Rebalancing Happens
Indices are meant to represent a particular segment of the market. Over time, however:
Some companies grow while others shrink.
Market capitalizations change.
New leaders emerge in sectors.
Corporate actions (mergers, delistings, bankruptcies) occur.
Market liquidity and trading patterns evolve.
To maintain accuracy and credibility, index providers periodically evaluate components based on criteria such as:
Free-float market capitalization
Liquidity (trading volumes and turnover)
Sector representation
Corporate governance and regulatory compliance
Financial performance
Rebalancing ensures that the index remains aligned with the current structure and performance of the market.
2. How Rebalancing Works
The rebalancing process typically includes:
a. Announcement Phase
Index providers (NSE Indices, MSCI, FTSE Russell, S&P Dow Jones) release the final list of changes ahead of implementation, typically 2–4 weeks in advance. This gives institutional investors time to prepare.
b. Execution Day
On the official rebalancing date—often coinciding with the end of a quarter—index funds and ETFs must:
Buy stocks that are being added.
Sell stocks that are being removed.
Adjust weightings for stocks that remain but whose weight has changed.
This creates heightened trading activity, especially in the closing session (closing auction window).
c. Post-Rebalance Adjustment
Stocks may continue to adjust over the next few sessions as traders reposition and arbitrage strategies unwind.
3. Impact of Index Rebalancing
A. Price Impact on Stocks Being Added
When a stock is added to a major index:
Index funds buy the stock, leading to strong demand.
Prices often surge in the short term (known as the index inclusion effect).
Liquidity improves due to higher institutional participation.
Valuations may rise as more ETFs and passive funds accumulate holdings.
This effect is especially pronounced in indices with large passive following such as Nifty 50, S&P 500, or MSCI Emerging Markets.
However, this rise may be temporary—after the initial bounce, prices may stabilize or even decline as speculative traders exit.
B. Price Impact on Stocks Being Removed
Stocks removed from the index face:
Forced selling by index funds.
Immediate drop in price due to excess supply.
Reduced liquidity as passive funds exit.
Potential long-term decline in visibility and analyst coverage.
This is called the index deletion effect and can significantly hurt sentiment.
C. Impact on Index Levels
Rebalancing can change:
Sector weights (e.g., financials vs. IT)
Market-cap distribution
Risk and volatility characteristics
If high-weight stocks are added or removed, the impact on the overall index value can be sizeable.
D. Impact on Trading Volumes and Liquidity
Rebalancing typically results in:
Surge in trading volumes, especially in the last hour.
Increased delivery-based buying from funds.
Temporary widening of spreads due to volatility.
Short-term liquidity mismatches, particularly in mid-cap or small-cap rebalancing.
Index rebalancing days are often among the highest volume days of the year.
E. Impact on ETFs and Passive Funds
Passive funds must replicate the index exactly. Rebalancing forces:
High turnover in ETF portfolios.
Transaction costs, which may be passed on to investors.
Tracking error risks if markets are too volatile on rebalancing day.
This mechanical trading adds to price distortions.
F. Impact on Derivatives Markets
Index rebalancing impacts:
Nifty Futures and options due to hedging adjustments.
Volatility around expiry, especially if rebalancing coincides with derivatives expiry.
Straddle and strangle traders who position based on anticipated price swings.
Quant traders and arbitrage desks particularly exploit these windows.
G. Impact on Market Sentiment
Inclusion in a major index is often seen as:
A sign of strong fundamentals.
Higher institutional confidence.
Better corporate governance.
Removal, on the other hand:
Signals deterioration.
May reduce analyst and investor focus.
4. Who Benefits from Index Rebalancing?
i. Short-Term Traders
They profit from:
Price surges in stocks being added.
Price drops in stocks being removed.
Volatility spikes on execution day.
High-frequency traders (HFTs) and algorithmic funds dominate this space.
ii. Arbitrageurs
They exploit price inefficiencies created by:
Temporary demand-supply imbalance.
Tracking errors in ETFs.
Lag between announcement and execution.
iii. Corporates
Being added to an index increases visibility and prestige, potentially lowering cost of capital.
5. Risks and Challenges of Index Rebalancing
a. Excess Volatility
Prices swing sharply on announcement day and execution day, often unrelated to fundamentals.
b. Temporary Distortions
Stocks may become:
Overvalued after inclusion.
Undervalued after exclusion.
These distortions eventually normalize but create risk for traders.
c. Market Manipulation or Speculation
Some traders attempt to anticipate rebalancing outcomes, leading to front-running—buying in advance of the official announcement.
d. Overdependence on Indexing
As passive investing grows, mechanical buying/selling can destabilize markets during rebalances.
6. Global vs. Local Impacts
MSCI Rebalancing: impacts global flows in emerging markets including India.
Nifty/Sensex Rebalancing: impacts domestic flows.
Sectoral Index Rebalancing: affects specific industries.
Global indices often cause bigger price swings due to foreign fund flows.
Conclusion
Index rebalancing is a critical process in ensuring that stock market indices remain accurate and relevant. While it may seem purely technical, its impact is widespread—from stock price movements and liquidity changes to investor sentiment and fund flows. For traders, rebalancing events offer opportunities to capitalize on predictable demand patterns, but they also come with significant volatility-related risks. For long-term investors, while the day-to-day swings may not matter much, understanding how rebalancing works can help explain sudden price movements and shifts in market dynamics.
Overall, index rebalancing reinforces the efficiency and representativeness of financial markets, but it also introduces short-term inefficiencies that active participants can exploit.

Nifty & Bank Nifty Options Trading1. Understanding Nifty & Bank Nifty as Option Underlyings
Nifty 50
A diversified index covering 13 sectors, representing India’s overall equity market.
Lower volatility compared to Bank Nifty
Stable and predictable movements
Preferred by positional traders and institutional hedgers
Bank Nifty
Composed of major banking stocks, highly sensitive to interest rates, RBI actions, liquidity flows, and global banking events.
Extremely high volatility
Fast intraday swings (frequently 300–700 points in a day)
Preferred by aggressive intraday option buyers and advanced traders
Liquidity in both instruments is extremely high, making them ideal for buying and selling options.
2. How Index Options Work
Option Types
You deal with two primary instruments:
Call Options (CE) – You profit when the index goes up
Put Options (PE) – You profit when the index goes down
Expiry Cycles
Both Nifty and Bank Nifty have:
Weekly expiry
Monthly expiry
Quarterly (some strikes)
Bank Nifty earlier had only weekly expiry on Thursday, but now expiries rotate due to SEBI’s rules. Nifty expires every Thursday as usual (unless it is a trading holiday).
Lot Sizes
Nifty lot size: typically 50 units
Bank Nifty lot size: typically 15 units
(These vary slightly during periodic revisions.)
3. Pricing Dynamics: Why Option Premiums Move
Option premiums are governed by:
i. Intrinsic Value
The real, quantifiable value.
CE intrinsic value = Spot price – Strike
PE intrinsic value = Strike – Spot
ii. Time Value (Theta)
Time value decreases as expiry comes closer.
Buyers get hurt by theta decay
Sellers benefit from theta decay
Bank Nifty has rapid intraday time decay, so sellers often dominate.
iii. Volatility (Vega)
Bank Nifty has higher volatility, meaning:
Higher premiums
Larger impact of news
Bigger risk and reward potential
iv. Delta
Measures how quickly the premium moves with respect to the index.
Example:
Delta 0.50 → Option moves 50% of index move
ATM options typically have delta ~0.5
Bank Nifty deltas shift faster due to rapid price movement.
4. Why Nifty & Bank Nifty Are Perfect for Options Trading
1. Deep liquidity
Instant order execution, tight spreads.
2. Weekly expiries
Fast premium decay → perfect for option sellers
Low cost → attractive for option buyers
3. High volatility (Bank Nifty)
Good for intraday scalping.
4. Large participation
FIIs, DIIs, proprietary desks, retail traders provide continuous order flow.
5. Common Trading Styles
A. Option Buying
Best for:
Trending markets
Breakout strategies
Intraday volatility plays
Pros:
Limited risk (premium paid)
High returns when market trends strongly
Cons:
Theta decay kills slow markets
Needs precise timing and direction
Bank Nifty is favored by buyers due to sudden moves.
B. Option Selling
Best for:
Range-bound markets
High probability income
Weekly expiry trading
Pros:
Higher win-rate
Time decay works in seller’s favor
Cons:
Potential for large losses if market trends
Must use hedging
Nifty is preferred by conservative sellers due to calmer moves.
Bank Nifty selling is profitable but demands skill and hedging discipline.
6. Key Strategies Used in Nifty & Bank Nifty
1. ATM/ITM Scalping (Intraday)
Used for 1–3 minute charts.
Buyers use fast entries on breakouts; sellers sell on reversals.
2. Straddles
Sell ATM CE + ATM PE.
Ideal when expecting low volatility.
Highly used on:
Expiry days
Fridays in monthly series
3. Strangles
Sell OTM CE + OTM PE.
Safer than straddles, with wider breathing space.
4. Credit Spreads
Bear call spread
Bull put spread
Controlled-risk selling strategies.
5. Iron Condor
For sideways markets with limited risk.
6. Directional Option Buying
Buyers typically look for:
Trendline breakouts
VWAP bounces
CPR (Central Pivot Range) breakout
Previous day high/low rejection
Bank Nifty gives the best directional follow-through.
7. Hedge-Based Positional Trades
Nifty traders often hold:
Bull Call Spreads
Bear Put Spreads
Calendar spreads
for monthly swings.
7. Expiry Day Dynamics
Expiry days (especially Thursday) are unique:
For Nifty & Bank Nifty
Accelerated theta decay
Frequent stop-hunt wicks
Sudden option premium collapse
Wild moves in the last 30 minutes
Scalpers thrive; beginners get trapped.
Option selling is usually profitable on expiry days, but only if:
You hedge
You manage risk
You avoid naked selling
Option buying works only during big directional moves or volatility spikes.
8. Risk Management (Non-Negotiable)
Without risk management, Nifty & Bank Nifty options will punish you. Follow these guidelines:
1. Use Stop-Loss Always
Options move insanely fast.
Bank Nifty can wipe out capital in minutes.
2. Never Sell Naked Options
Unhedged selling can cause large losses.
3. Control Position Size
Risk per trade should not exceed:
1–2% of capital (positional)
0.5–1% (intraday)
4. Avoid Overtrading
Chasing every move is a losing habit.
5. Understand News Events
Avoid trading near:
RBI policy
Budget
FOMC
Inflation data
Major geopolitical news
These events create sudden spikes.
9. Psychological Discipline
Options trading is 70% psychology.
Don’t chase runaway premiums
Don’t revenge trade
Don’t hold losing trades hoping they “come back”
Don’t keep adding to a losing position
If you can stay calm during fast index swings, you will trade better than most participants.
10. Final Practical Advice
I’ll be direct with you—Nifty & Bank Nifty options can help you grow your capital fast only if you learn structured trading. Otherwise, they can drain your account.
Here’s the right mindset:
Learn the basics thoroughly
Trade small and build skill
Specialize in one or two strategies
Stick to charts, not emotions
Think like a risk manager first, trader second
If you invest time in practice and discipline, index options can become your strongest trading edge.

Part 2 Ride The Big Moves Why Option Selling is Popular
Option selling is preferred because:
Time decay works in seller’s favour
Most options expire worthless
Sellers act like insurance companies
They earn small but consistent profits
But selling requires high capital and strict risk management.

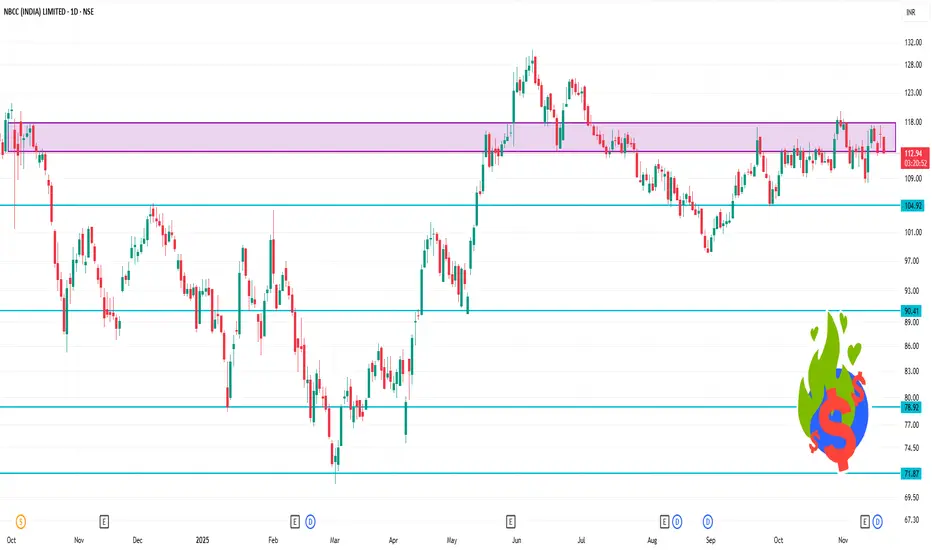
NBCC 1 Day Time Frame 📊 Key numbers
Current trading range (today): ~ ₹112.87 (low) to ₹115.50 (high) on the NSE.
Previous close: ~ ₹115.99.
52-week range: ~ ₹70.80 (low) to ~ ₹130.70 (high).
Valuation / fundamentals: P/E ~50.9x, P/B ~11.72x.
⚠️ Important disclaimers
These levels are based on publicly available intraday ranges and technical observations — not guaranteed.
Market conditions (volume, news, macro events) can shift levels rapidly.
I’m not providing personalized financial advice. You should cross-check live charts, use proper risk management, and adapt to your trading style.
For longer-term trends (beyond 1 day) you’d want to consult moving averages, trend lines, daily/weekly charts etc.
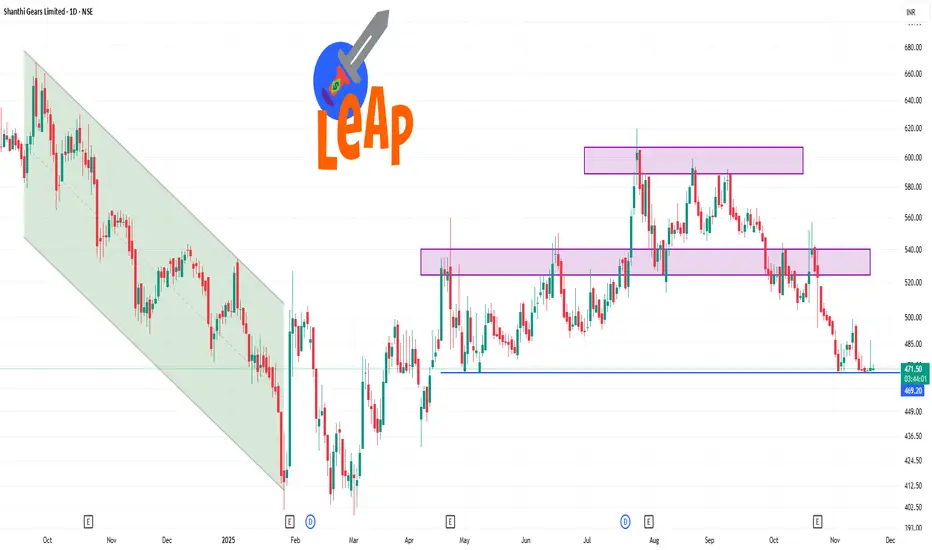
SHANTIGEAR 1 Day Time Frame 📍 Pivot / Support / Resistance Levels (1-day)
From the data available:
Pivot point (classic) ~ ₹ 471.35.
Resistance levels: R1 ~ ₹ 472.65, R2 ~ ₹ 474.30, R3 ~ ₹ 475.60 (classic)
Support levels: S1 ~ ₹ 469.70, S2 ~ ₹ 468.40, S3 ~ ₹ 466.75 (classic)
Bollinger lower band ~ ₹ 475.62, upper band ~ ₹ 547.04 (20-day)
🔍 My Interpretation
Given the indicators and levels:
The stock is under selling pressure in the short term; trend favors the downside.
Primary resistance is around ₹ 472-475 range. If the price moves up, it may struggle to clear that.
Primary supports around ₹ 466-469 zone. A break below this zone could open for further downside.
Because RSI is near oversold, there could be a short-term bounce, but unless the trend changes (moving averages turn up, price breaks above resistance), any bounce may remain limited.
ESG and Carbon Credit Trading1. Introduction to ESG
ESG refers to a set of standards used to evaluate a company’s sustainability performance and ethical impact. It goes beyond traditional financial metrics and evaluates how responsibly a company operates.
Components of ESG
1. Environmental
Focuses on how a company impacts the planet.
Key indicators include:
Carbon emissions
Energy efficiency
Renewable energy usage
Waste and pollution management
Water conservation
Biodiversity protection
2. Social
Analyzes how a company manages relationships with people, culture, and society.
Key indicators include:
Employee welfare and diversity
Human rights
Community development
Customer data privacy
Workplace safety
Supply chain ethics
3. Governance
Evaluates how a company is governed, including its leadership structure.
Key indicators include:
Board diversity
Executive compensation
Shareholder rights
Transparency and reporting
Anti-corruption measures
Strong governance ensures smooth business operations and builds investor trust.
2. Importance of ESG in Modern Business and Investment
Institutional investors, banks, asset managers, and regulators increasingly prioritize ESG factors to evaluate long-term risk, sustainability, and ethical behavior.
Key reasons for ESG adoption
1. Investor Demand
Global investors prefer companies with:
Sustainable long-term strategies
Lower environmental and regulatory risks
Ethical practices and transparency
ESG-compliant firms often attract more capital and have stronger market valuations.
2. Regulatory Pressure
Governments worldwide are:
Imposing emission rules
Mandating ESG disclosures
Encouraging green investments
For example, Europe’s SFDR, India’s BRSR norms, and the U.S. SEC climate disclosure proposals are major steps.
3. Business Competitiveness
Companies that adopt ESG practices achieve:
Cost savings (through energy efficiency)
Lower legal and compliance risks
Better brand reputation
Higher customer loyalty
4. Risk Mitigation
Ignoring ESG exposes companies to risks such as:
Climate-related disruptions
Regulatory penalties
Social backlash
Poor governance scandals
Thus, ESG acts like a shield against long-term uncertainties.
3. What Are Carbon Credits?
Carbon credits are tradable certificates that represent the right to emit one metric ton of carbon dioxide or its equivalent (CO₂e). These credits are generated through projects that reduce, capture, or avoid greenhouse gas emissions.
Types of Carbon Credits
1. Compliance Credits
Used by industries under mandatory government regulations such as:
EU Emission Trading System
California Cap-and-Trade
China’s national carbon market
2. Voluntary Carbon Credits
Purchased by companies voluntarily to offset emissions and meet sustainability goals.
Companies may buy credits to reach:
Carbon neutrality
Net-zero goals
ESG compliance
4. How Carbon Credit Trading Works
Carbon credit trading operates on market principles where supply and demand influence price. The trading systems can be broadly categorized into Cap-and-Trade and Voluntary Markets.
1. Cap-and-Trade Mechanism (Compliance Market)
This is the most widely used carbon trading system globally.
How it works:
Government sets a cap or limit on total emissions allowed for industries.
Companies receive or buy emission allowances.
If a company emits less than its quota, it can sell the excess credits.
If it emits more, it must buy credits to offset the difference.
This economically encourages companies to adopt cleaner technologies.
2. Voluntary Carbon Market (VCM)
Here, companies voluntarily purchase carbon credits.
Sources of voluntary credits include:
Reforestation projects
Renewable energy installations
Methane capture
Carbon sequestration in soil
Waste recycling and reduction
These credits are bought to meet corporate commitments or to enhance ESG scores.
5. Why Companies Buy Carbon Credits
Carbon credits serve multiple strategic purposes:
1. Achieving Carbon Neutrality
Companies offset their greenhouse gas emissions to become carbon neutral.
2. Meeting Regulatory Requirements
In mandatory markets, businesses must comply with government caps.
3. Enhancing ESG Scores
A strong environmental performance boosts a company’s ESG rating, attracting:
Investors
Global customers
Financial incentives
4. Avoiding Penalties
Failing to offset emissions often leads to regulatory fines.
6. Economic and Market Impact of Carbon Credit Trading
Carbon markets create new financial opportunities while combating climate change.
Key Market Impacts
1. Revenue Generation
Governments earn through auctions of emission permits.
2. Support for Green Projects
Carbon offset projects receive funding from credit sales.
3. Cost Efficiency for Businesses
Buying credits is often cheaper than modernizing operations.
4. Market Liquidity
Carbon credits are traded on exchanges, improving liquidity and price discovery.
7. Integration of ESG with Carbon Markets
Modern ESG ratings include factors related to carbon footprint, net-zero plans, and participation in carbon markets.
How ESG and Carbon Trading Intersect
Environmental Score
Emissions reduction and carbon offsetting directly raise the E score.
Investor Confidence
Companies participating in regulated carbon markets are viewed as future-ready.
Corporate Strategy Alignment
ESG-driven firms adopt internal carbon pricing, invest in carbon offset projects, and integrate climate risk into long-term business planning.
Financial Products
ESG funds increasingly include companies with strong carbon mitigation strategies.
8. Benefits and Challenges of Carbon Credit Trading
Benefits
Encourages emission reduction
Funds environmental projects
Creates new financial markets
Helps companies meet sustainability goals
Supports global climate agreements
Challenges
Price volatility
Lack of standardization
Risk of “greenwashing”
Fraudulent or low-quality credits
Verification challenges in voluntary markets
These challenges highlight the need for strong regulation, transparency, and reliable auditing systems.
9. Future of ESG and Carbon Credit Trading
Both ESG and carbon markets are expected to grow significantly due to:
Global climate commitments (Paris Agreement)
Rise in sustainability-driven investments
Increasing corporate carbon-neutral pledges
Technological innovations in monitoring and reporting
Artificial intelligence, satellite data, and blockchain technology are also making carbon markets more trustworthy and efficient.
In the future:
Carbon credits may become more mainstream financial instruments.
ESG ratings will become stricter and more transparent.
Companies with poor ESG scores may face limited access to capital.
Carbon pricing may influence global trade and supply chains.
Conclusion
ESG and carbon credit trading together represent a major transition toward a sustainable global economy. ESG provides the framework for responsible corporate behavior, while carbon credit trading offers a market-based mechanism for reducing greenhouse gas emissions. As investors, regulators, and corporations increasingly prioritize sustainability, the integration of ESG principles with carbon markets is becoming essential for long-term growth, risk management, and global climate action.
Both concepts are not just regulatory requirements—they are fundamental pillars of the future economic system, shaping how businesses will operate and compete in the coming decades.

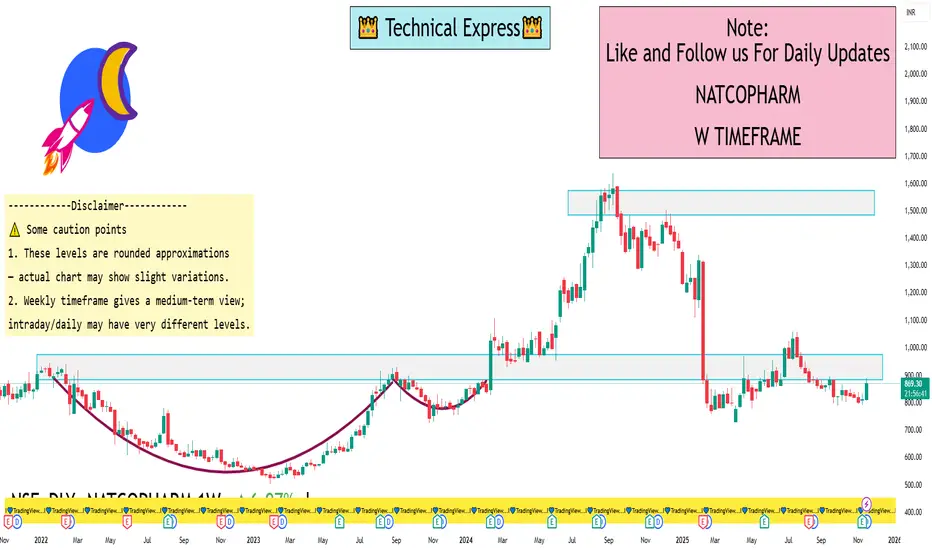
NATCOPHARM 1 Week View📌 Key figures:
Latest price around ₹870–₹875 (approx) per share.
52-week range: Low ~ ₹726.80, High ~ ₹1,505.00.
Weekly pivot point (standard) ~ ₹832.38, weekly support ~ ₹812.22, weekly resistance ~ ₹852.12.
📊 Important weekly levels to watch:
Support around ~ ₹812–₹832 (this is the pivot zone and near current price)
Stronger support if breakdown: ~ ₹792–₹772 region.
Resistance near ~ ₹852–₹872 zone.
If momentum picks up: moving beyond ~ ₹900+ could become the next resistance area (though less validated currently)
Part 2 Master Candle Stick PatternsWhat Drives Option Prices Intraday?
Several factors affect option prices every minute:
1. Underlying price movement (Delta)
2. IV changes (Vega)
3. Time decay (Theta)
4. Liquidity
5. Market sentiment
6. Hedge adjustments by institutions
Understanding these micro-dynamics helps you avoid false breakouts.

Part 1 Master Candle Stick Patterns Why Option Buyers Lose More Frequently
Option buyers lose mainly due to:
Time decay
Wrong direction
Lack of momentum
Low probability bets
Emotional trading
Most buyers attempt lottery-like trades in weekly expiries.
This is why professional traders prefer selling strategies.

Part 2 Support and ResistanceOption Premium Breakdown – Intrinsic vs Extrinsic
1. Intrinsic Value
Actual value if exercised TODAY.
For Call: Spot – Strike (if positive)
For Put: Strike – Spot (if positive)
2. Extrinsic (Time + Volatility)
Value due to time left + expectations.
This is where traders either make or lose money.

Part 1 Support and ResistanceBuyer vs Seller (Writer): The Battle
Every option trade has two sides:
Option Buyer Option Seller
Pays premium Receives premium
Limited loss Limited profit
Unlimited profit Unlimited risk (if naked)
Needs movement Makes money without movement
Option buyers need direction + momentum.
Option sellers need time + stability.
About 70–80% of options expire worthless, which is why many traders prefer selling over buying.

Part 12 Trading Master Class With ExpertsMoneyness of Options
Options are classified as:
In the Money (ITM)
At the Money (ATM)
Out of the Money (OTM)
Call Options
ITM: Stock price > Strike price
ATM: Stock price = Strike price
OTM: Stock price < Strike price
Put Options
ITM: Stock price < Strike price
ATM: Stock price = Strike price
OTM: Stock price > Strike price
Moneyness affects premium value, risk, and probability of profit.

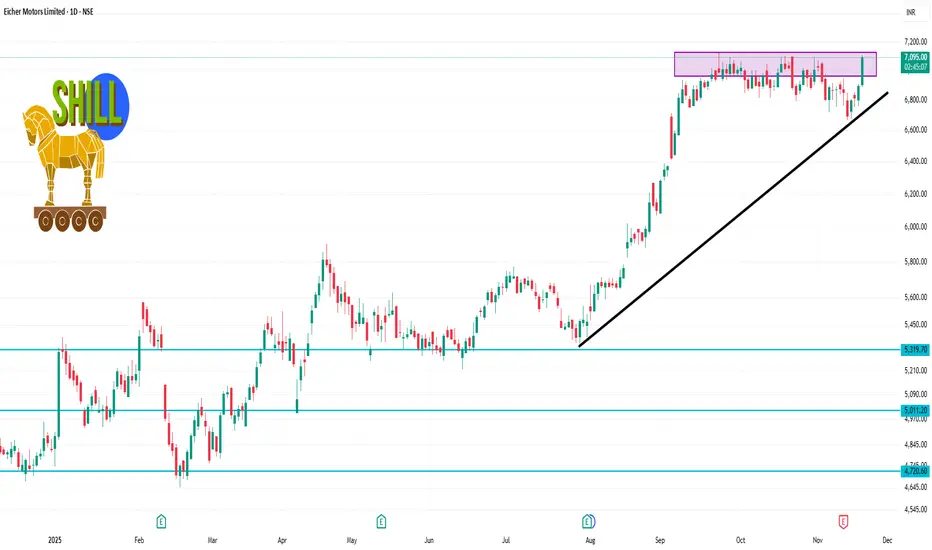
EICHERMOT 1 Day Time Frame 📋 Key price info
Current quote: ~ ₹7,084.50 (as of around midday)
Today’s high: ~ ₹7,108.00
Today’s low: ~ ₹6,886.50
52-week high: ~ ₹7,122.50
52-week low: ~ ₹4,646.00
✅ Bias / scenario (for day-frame)
Bullish: If price decisively breaks above ₹7,120 with volume, momentum could carry further.
Caution: Because price is near its highs, downside risk exists if it stalls or reverses from this resistance zone.
Intra-day trade idea: Watch how it behaves around the support ~₹6,850-₹6,900 — if it holds, you might look for a bounce; if it breaks sharply, risk of deeper pullback.
Part 11 Trading Master Class With Experts What Are Options?
Options are financial contracts that give you the right, but not the obligation, to buy or sell an underlying asset (usually stocks, indices, or commodities) at a fixed price within a specific period.
There are two types of options:
Call Option – Gives the buyer the right to buy the asset at a pre-decided price (strike price).
Put Option – Gives the buyer the right to sell the asset at a pre-decided price.
Each option contract has three key components:
Strike Price – The fixed price at which you may buy or sell.
Premium – The price you pay to purchase the option.
Expiry Date – The date on which the option ceases to exist.
In India, options are cash-settled and expire weekly (for indices) or monthly (for stocks).

AI Trading Profits1. What Is AI Trading?
AI trading refers to the use of machine learning models, algorithms, and automation to analyze markets, predict price movements, and execute trades. Unlike traditional trading, where decisions depend on human judgment, AI uses data patterns to make logical, emotion-free decisions.
AI trading systems usually combine:
Machine Learning Models
Neural Networks
Natural Language Processing (NLP)
High-frequency trading (HFT) algorithms
Automated execution engines
These systems can scan thousands of indicators, news events, and market variables in seconds — something that is impossible for a human trader.
2. How AI Trading Generates Profits
AI earns profits primarily through accuracy, speed, pattern recognition, and disciplined execution. Let’s break it down:
a) Predictive Accuracy
AI systems analyze past price action, volume, volatility, order flow, sentiment, and macro data to forecast short-term or long-term price movements.
Profits are generated when AI predicts:
Trend continuation
Trend reversal
Breakouts
Market structure shifts
High-probability entry and exit points
A well-trained AI model can identify winning setups with higher precision than manual analysis.
b) Speed and Efficiency
Markets move fast — especially in intraday or high-frequency trading.
AI reacts in microseconds, allowing it to:
Enter and exit trades before retail traders react
Capture small price inefficiencies
Take advantage of rapid sentiment changes
This speed gives AI a competitive edge that converts directly into profits.
c) Removing Human Emotions
Human traders often suffer from:
Fear
Greed
Overtrading
Emotional reactions
Confirmation bias
AI avoids all emotional biases.
Once trained, it follows logic-based rules, improving consistency and profitability.
d) 24/7 Market Monitoring
AI never sleeps.
It continuously scans market conditions, technical signals, global news, and sentiment changes.
This constant monitoring allows AI to:
Identify opportunities instantly
Avoid bad trades
React faster to volatility
The result? More accurate trades and higher profit probability.
e) Backtesting and Optimization
Before trading live, AI models test strategies on historical data.
This process includes:
Validating accuracy
Measuring risk-reward
Fine-tuning indicators
Eliminating unprofitable setups
Backtesting ensures that only statistically profitable strategies go live.
3. AI Trading Strategies Used for Profit
AI can be deployed in multiple trading styles. Each strategy targets different types of profits:
**1. Trend-Following Algorithms
AI identifies strong bullish or bearish trends early and rides them until the trend weakens.
It predicts:
Higher highs/lows
Momentum strength
Trend exhaustion
Profits come from capturing major directional moves.
**2. Mean Reversion AI Models
AI detects when prices deviate too far from their average (mean).
It forecasts when price is likely to:
Bounce
Revert back
Correct after overbuying/overselling
Profits come from short-term rebounds.
**3. Breakout and Breakdown Detection
AI is excellent at spotting breakout patterns before they occur.
It analyzes:
Volume spikes
Liquidity clusters
Pressure zones
Market structure
Profits come from sharp moves after a breakout or breakdown.
**4. High-Frequency Trading (HFT)
HFT uses ultra-fast algorithms to profit from small price changes.
AI helps:
Detect micro-patterns
Execute instantly
Create thousands of tiny profitable trades
This strategy generates small but consistent profits.
**5. Arbitrage Trading
AI identifies price differences between:
Exchanges
Brokers
Markets
Derivatives vs spot
It instantly buys low and sells high, locking in risk-free profits.
**6. Sentiment Analysis-Based Trading
AI uses NLP to scan:
News
Social media
Analyst reports
Earnings updates
Economic data
It converts sentiment into actionable trades.
Example: detecting early negative sentiment before a stock falls.
**7. Options AI Trading
AI is widely used in options due to complex pricing dynamics.
It predicts:
Implied volatility
Premium movement
Option Greeks shifts
Probability of strike price touching
Profits come from precision in volatility forecasting.
4. Why AI Trading Is So Profitable
1. Pattern Detection Beyond Human Capability
AI sees patterns in data that humans can’t detect.
2. Ability to Process Massive Data
Millions of data points are processed per second.
3. Discipline and Consistency
AI stays consistent in all market conditions.
4. Lightning-Fast Execution
AI acts instantly when price levels hit.
5. Adaptability
AI models adjust to changing market conditions by retraining or rebalancing strategies.
5. Real-World Examples of AI Trading Profitability
Hedge Funds
Many funds using AI (e.g., Renaissance Technologies, DE Shaw) have generated billions in returns, outperforming traditional traders.
Banks
J.P. Morgan, Goldman Sachs, and Citi use AI to improve:
Risk models
Trade execution
Market predictions
Retail Traders
With AI bots and automated systems, retail traders can:
Avoid emotional mistakes
Trade professionally
Increase win rate
6. Risks and Limitations of AI Trading
Even though AI can be highly profitable, it is not foolproof.
Risks include:
1. Overfitting
Model becomes too dependent on past data and fails in live markets.
2. Black Swan Events
AI struggles during unexpected market crashes.
3. Data Quality Issues
Wrong data = wrong predictions.
4. High Cost of Development
Reliable AI models require:
Huge data sets
Expensive training
High computational power
5. Excessive Confidence
Believing AI is 100% accurate can lead to unnecessary risk.
7. Final Summary
AI trading generates profits by:
Predicting market movements with high accuracy
Executing trades at lightning speed
Eliminating emotional decisions
Continuously learning and adapting
Identifying micro-patterns invisible to humans
While it can be extremely profitable, success depends on good strategy, quality data, and proper risk management.

Part 9 Trading Master Class With Experts Best Practices for Safe Option Trading
Start with buying options, not selling.
Use a defined stop-loss and target.
Avoid trading during low liquidity.
Choose ATM/ITM options for better probability.
Follow trend + volume + price action.
Don’t trade based on emotions or rumours.
For selling, always hedge positions.
Keep risk per trade under 1–2% of capital.

Part 7 Trading Master Class With Experts 1. Delta
Measures how much the option premium changes with a ₹1 move in the underlying.
Call delta: +0.0 to +1.0
Put delta: –0.0 to –1.0
2. Theta (Time Decay)
Measures how much value the option loses each day.
Buyers suffer from Theta
Sellers benefit from Theta
3. Vega
Measures impact of volatility.
High volatility → higher premium
Low volatility → lower premium
4. Gamma
Measures how fast delta changes.
High gamma = high speed of price movement.

Premium Charts Top Premium Chart Patterns
Below are the most powerful, widely used, institutionally-backed chart patterns. Each section includes:
Structure
Psychology
Volume behavior
Entry methods
Stop-loss placement
Profit targets
Smart-money traps
Let’s explore them.

Divergence SecretsRisks in Option Trading
1. Option Buying Risks
Premium becomes zero if market doesn’t move
Time decay erodes value daily
Volatility crush hurts premiums
Beginners often lose due to poor timing.
2. Option Selling Risks
Unlimited losses if market breaks range
Requires strict discipline & risk management
Sudden news, gap-ups, crash can blow the account
Margin requirement is high for safety.
3. Emotional Trading
Options move very fast.
Greed, fear, impatience can cause severe losses.
